Li(2p ←2s)+Na(3s)pressure broadening in the far-wing and line-core profiles
F Talbi, N Lamoudi, L Reggami, M T Bouazza,4,†, K Alioua, and M Bouledroua
1Physics Department,Badji Mokhtar University,B.P.12,Annaba 23000,Algeria
2Laboratoire de Physique des Rayonnements,Badji Mokhtar University,B.P.12,Annaba 23000,Algeria
3Laboratoire d’Etude des Surfaces et Interfaces de la Mati`ere Solide(LESIMS),Badji Mokhtar University,B.P.12 Annaba 23000,Algeria
4Laboratoire LAMA,Laboratoire des Mat´eriaux Avanc´es(LAMA),Badji Mokhtar University,B.P.12 Annaba 23000,Algeria
5Laboratoire de Physique de la Mati`ere et du Rayonnement LPMR,Universit´e Ch´erif Messaidia,B.P.1553,Souk-Ahras 41000,Algeria
Keywords: pressure broadening,line-core broadening,far-wing spectra,photoabsorption
1. Introduction
The investigations on the line core and the far wings of molecular spectral profiles have been lately become a subject of great interest in astrophysics,spectroscopy,quantum chemistry and laser physics. In fact,the interpretations of the collisional broadened line profiles of alkali-metal atoms allow us to investigate the interstellar mediums,because several observations demonstrate that the environment of astronomical objects are primary dominated by the alkali-metal atoms.[1–3]Due to this high importance, a large number of experimentalists and theoreticians have long been interested in studying the spectral line broadening in the core and in the far wings caused by the interaction of alkali-metal atoms with atoms of their surrounding environment. The theoretical studies have employed semi-classical[4–6]and quantum[7–12]models.Over the last few years,our group has simulate quantum-mechanically the photoabsorption spectra of alkali-metal atoms broadened by collision with like, unlike or rare-gas atoms. In our recent paper,[13]we have carried out the absorption spectra of a radiating sodium atoms Na(3p←3s) perturbed by ground lithium Li(2s) atoms. The current paper is concerned with the quantal study of pressure-broadening phenomena which affects the Li(2p←2s) resonance line in the wings and core when the lithium atoms are interacting with ground sodium Na(3s)atoms. In the next section we will describe the method used to construct the required potential-energy curves and the transition dipole moments. In Section 3, we will use them to carry out the radiative lifetime of the ro-vibrational levels of the excited molecular states. In Section 4, we will calculate the diffusion coefficients of ground Li(2s) and excited Li(2p) lithium atoms in sodium gas to see how accurate the LiNa potentials are. Section 5 is divided into two subsections,Subsection 5.1 is devoted to the computation of the reducedabsorption coefficients; this part is more concerned with the designation of satellite peak positions and origins in the blue and red wings. In Subsection 5.2,the width and shift of linecore will be evaluated and their variation laws with temperature will be examined.
Unless otherwise stated, atomic units (a.u.) are used all over this paper; in particular, energies are in Hartrees (Eh),distances in Bohrs(a0),and ¯h=1.
2. Potential and dipole moments constructions
The quantum-mechanical investigation of the line broadening in the core or in the wings of the lithium Li(2p←2s)spectra,perturbed by ground sodium atoms,needs to be started by the determination of the potential-energy curves along which the dimers Li(2s)+Na(3s) and Li(2p)+Na(3s) interact. More precisely, this section is devoted to the construction of the singlet X1Σ+and triplet a3Σ+potential-energy curves via which Li(2s)interacts with Na(3s)and of the singlet A1Σ+and B1Π and the triplet b3Π and c3Σ+potential curves via which Li(2p)interacts with Na(3s).
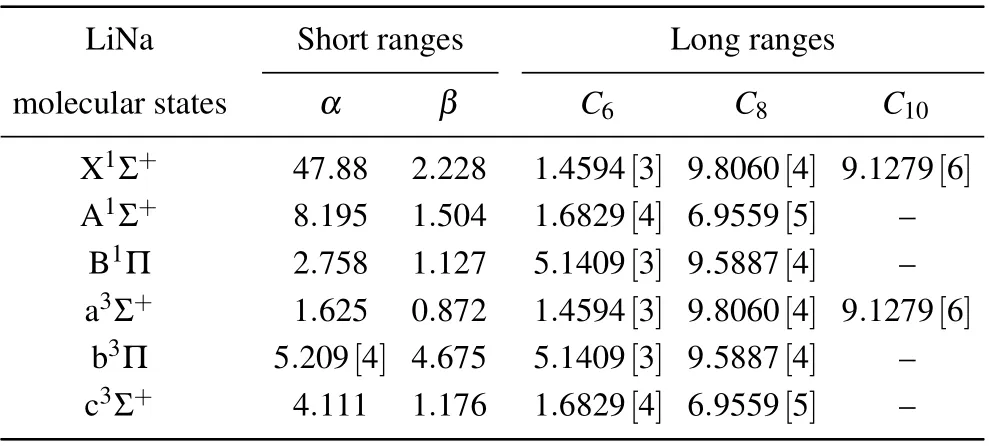
To this aim,we adopted theab initiodata points generated by Aubert–Fr´econ M,[14]which we extended smoothly to the Born–Mayer potential[15]V(R)~αexp(-βR), in the shortrange internuclear distancesR, and to the well-known formV(R)~-∑nCnR-n, in the long-range distances. In these formulas,αandβare two constant parameters andCn, withn=6,8,and 10,are the dispersion coefficients adopted from Marinescu and Sadeghpour.[16]All these constants are listed in Table 1.

Table 1. Adopted short- and long-range parameters (in a.u.) for the construction of ground Li(2s)+Na(3s)and excited Li(2p)+Na(3s)potentialenergy curves. All the dispersion coefficients are from Marinescu and Sadeghpour.[16] Numbers in square brackets represent powers of ten: [m]=10+m.

Fig.1. Li(2s)+Na(3s)and Li(2p)+Na(3s)potential-energy curves V(R)variation with the internuclear distance R. All singlet and triplet curves are compared with theoretical data from Ref.[17].
Figure 1 shows the constructed potential curves relative to the singlet and triplet LiNa molecular states. Some of the theoretical data points of Schmidt–Minket al.[17]are also presented for comparison. Mabrouk and Berriche[18]determined the energy difference 0.0679 between both 2s–3s and 2p–3s asymptotic dissociation limits,which is identical to the experimental value cited in Ref.[18]. This energy turns to be very close to 0.0680 computed by Aubert–Fr´econ.[14]The corresponding spectroscopic data derived from the present curves,namely, the equilibrium distanceRe, the dissociation energyDe, and the minimum-to-minimum electronic excitation energyTe, are given and compared with some theoretical[17–20]and measured values[21–23]in Table 2.To further verify the accuracy of the constructed potentials,we have determined their rotational-vibrational energy levels and compared them with the corresponding available published data. Tables 3 and 4 display, for a few number of vibrational quantum numberv,the rotational-vibrational energy levels-E(v,J), withJ=0 for Σ states andJ=1 for Π states.

Table 2. Spectroscopic constants related to the ground and excited LiNa dimer. They are compared with some published results.

Table 3. Rotationless-vibrational energy levels-E(v,J),in cm-1,of the singlet LiNa molecular states.

Table 4. Rotationless-vibrational energy levels-E(v,J),in cm-1,of the triplet LiNa molecular states.
We also need to know in the following calculations the transition dipole momentsD(R) (TDMs) correlated with the allowed molecular transitions among the singlet A1Σ+←X1Σ+and B1Π←X1Σ+and the triplet b3Π←a3Σ+and c3Σ+←a3Σ+states. In the present constructions we utilize the data points generated by Aubert–Fr´econ M,[14]which we connected in small distances to a linear form and for large distancesRtoD(R)~D∞+AR-3, proposed by Chu and Dalgarno.[24]Here,D∞⋍2.359 is the atomic dipole moment obtained asR →∞, and the calculations yieldA=+3474.61 andA=-1668.11 for the ΣΣ and ΣΠ transitions, respectively. The TDM curves are shown in Fig.2, where the X–A dipole moments are compared withab-initiodata points from Mabrouk and Berriche.[18]

Fig.2.Transition dipole moments as a function of internuclear R.The singlet X–A moments are compared with theoretical data from Ref.[18].
3. Radiative lifetimes
We propose in this section to calculate with our constructed potentials and transition dipole moments the radiative lifetimes of the ro-vibrational levels of the excited LiNa molecular states.
The radiative lifetimeτ= 1/A(v′JΛ′) of an upper rotational-vibrational molecular state (v′JΛ′) is defined in quantum mechanics as the inverse of the sum of the probabilities[11,25]


withΛbeing the projection of the orbital angular momentum on the internuclear axis.[25]The free states are associated with the energy-normalized wave functions,while the bound states are space-normalized wave functions.
The obtained lifetime results of a few rotationalvibrational levels, relative to the singlet A1Σ+and B1Π and to the triplet b3Σ+and c3Π states, are compiled in Table 5.In addition, by considering in the vicinity of the dissociation limits the highest rotationless-vibrational states, it is possible to determine the atomic radiative lifetimeτafor Li(2p)excited state.This can be done by averaging the four lifetimes that correspond to the highest rotationless vibrational levels,shown in bold in Table 5.In such a case,the atomic lifetimeτais related to the statistically weighted sum ofA(v′JΛ′)with

The present theoretical calculations yield the radiative lifetime 27.16 ns for the 2p lithium state. The deduced value is consistent with the experimentally determined values 27.1018(14) ns of Le Royet al.,[26]27.09(4) ns of Schmittet al.,[27]27.11(6) ns of Volz and Schmoranzer,[28]and 27.22(20) ns of Carlsson and Sturesson.[29]McAlexanderet al.deduced from their experiments the values 26.99(16) ns for the7Li(2p2P°) state,[31]and 27.102(2) ns,for the7Li(2p2P°1/2) state.[31]The NIST recommended value is 27.11 ns.[32]
In all cases,the above comparisons show minute discrepancies with published works,which lead us to fully trust in our constructed LiNa potentials and TDMs.

Table 5. LiNa radiative lifetimes(in ns)of the singlet,A1Σ+ and B1Π,and triplet,b3Σ+ and c3Π,states.
4. Diffusion properties
We have also suggested, to assess the potential-energy curves constructed above, to look at the diffusion of ground Li(2s) and excited Li(2p) atoms into a dilute gas made of sodium atoms. The temperature-dependent diffusion coefficientD(T)for dilute gas is calculated by using the Chapman–Enskog method.[33]For one temperatureTand atomic densityn,this coefficient is given by

wherekBis Boltzmann’s constant,μis the reduced mass of the two colliding atoms,andΩ(1,1)(T)is the collision integral defined as

withQD(E) being the quantum-mechanical effective cross section in diffusion

wherek= (2μE)1/2is the wave number andηlis the phase shift obtained by solving the corresponding radial wave Eq.(2).For the diffusion of the ground Li(2s)atom in sodium gas,the diffusion cross section is given by the average

and by the following average:

for the diffusion cross section of the excited Li(2p)in sodium gas.
The diffusion coefficients in the temperature range 100 K–2000 K at gas pressurep=1 atm are listed in Table 6 for ground and excited states. To our knowledge,no published results are available for the LiNa system, so our results may serve as a prediction for future works.

Table 6. Diffusion coefficients D(T)for ground Li(2s)and excited Li(2p)in Na(3s)at several temperatures.
5. Far-wing and line-core pressure broadening
In the remaining sections, we are interested in the pressure broadening phenomena that a lithium atom absorbing a photon undergoes while it interacts with a ground sodium atom. The Li(2p←2s)photoabsorption is practically examined when the absorbing atom is moving into a dilute sodium gas at a fixed temperatureT. In such a case,the natural spectrum is physically affected in its line core and its far wings.Thus, the aim of this work is twofold: (i)to determine quantum mechanically the far-wing absorption profiles of the absorbing atom, and (ii) to quantify the amount of broadening of the 2p←2s line and its displacement from the unperturbed wavelengthλ0⋍670.8 nm.
5.1. Far-wing spectra
The collisional broadening phenomenon has been reviewed by Allard and Kielkopf[34]and Szudy and Baylis.[35]However,the far-wing pressure broadening process is quantified in molecular spectroscopy by means of the reduced absorption coefficients. The main relationships for these coefficients are given in Refs.[12,36].
For the case of the LiNa quasi molecule, the total reduced absorption coefficient is the sum of contribution corresponding to the four allowed transitions A1Σ+←X1Σ+,B1Π←X1Σ+,b3Π←a3Σ+,and c3Σ+←a3Σ+. Usually,for an allowed molecular transition, the photoabsorption coefficient is the sum of four absorption coefficients corresponding to four possible transitions, namely, bound–bound (b–b),bound–free (b–f), free–bound (f–b), and free–free (f–f). The equations which give different reduced absorption coefficients relating to each type of transition are given by the following expressions:

Figure 3 illustrates our results of simulation of the reduced photoabsorption coefficients corresponding to LiNa system carried out with our full quantum-mechanical calculations,at the temperatureT=2000 K for wavelengths ranging from 400 nm to 1200 nm. In our computation,we have taken into account all the bound and quasibound ro-vibrational levels, and we have used a frequency step Δν=10 cm-1. The total spectrum represented in Fig.3(a)shows clearly the existence of two satellites in the red wing located around 862 nm and 1070 nm. In Fig.3(b),we display the contribution of the four partial transitions. From this curve, it is easy to see that the singlet A←X and B←X bands dominate the red and blue wings,respectively. Indeed,the A←X transitions generate the 1070 nm satellite in the red wing,whereas both triplet b←a and c←a transitions are solely presented in the blue wing and have almost no effects on the general shape of the total spectrum.However,the b←a transitions participate with the satellite occurring at 862 nm.
From the classical theory,[34,35]the positions of such satellites are expected to occur at wavelengths corresponding to the extrema of the potential difference curves. Hence we have plotted in Fig. 4 the potential difference ΔVA←X,ΔVB←X, ΔVb←a, and ΔVc←ain terms of internuclear distanceR.Effectively,ΔVA←X,ΔVb←a,and ΔVB←Xpresent an extrema atRequal to 0.053 a.u., 0.041 a.u., and 0.104 a.u., respectively, corresponding to the wavelengths 868 nm, 1115 nm,and 440 nm. The potential difference curve ΔVc←adisplays no extrema. As the potential difference predicts the possible existence of satellite near the wavelength 440 nm,we represent,in Fig.5 in arbitrary units,the modified reduced absorption coefficient(Δω)2×kr(Δω),calculated at 2000 K as function of the frequency detuning Δω=|ω-ω0|in cm-1from the lithium atomic resonance lineω0. This modification, suggested by Lyyraet al.,[37]is able to highlight the weak satellites. Figure 5(a)shows the existence of a satellite for Δω=6310 cm-1in the blue wing,which corresponds to the wavelength 470 nm,close to the value predicted by the potential difference ΔVB←X.Figure 5(b)confirms the existence of two satellites in the red wing,already detected.

Fig.4. The LiNa difference potentials.

Fig. 5. Modified reduced absorption coefficient (Δω)2×kr(Δω) at T =2000 K as a function of detuning Δω =|ω-ω0|.
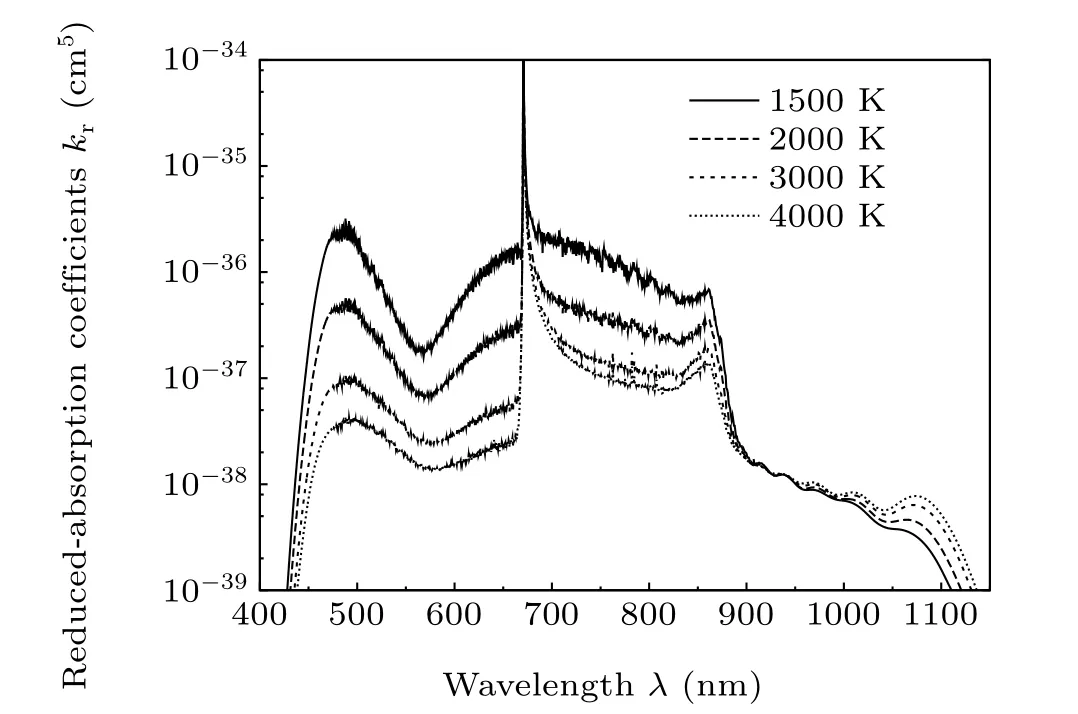
We have also investigated the effect of temperature on the profile of the photoabsorption spectrum for temperature range 1500 K–4000 K. It is noted that the spectrum intensity decreases with increasing temperature, as shown in Fig. 6 because the spectrum is dominated by the A←X (in the red wing) and B←X (in the blue wing) contributions which are mainly resulted from bound-bound transitions. AsTincreases, the population of the lower levels decreases leading to a drastic diminution of the photoabsorption spectrum intensity. Table 7 recapitulates the three satellite positions.
Once the calculations are achieved for the line-wing profile,it is now interesting to look also at the pressure broadening phenomena in the line-core.

Fig.6. Temperature effect on the shape of the photoabsorption profile. The temperatures are ranging from 1500 K to 4000 K.
5.2. Line-core pressure broadening
The atomic spectral lines are not really narrow and symmetrical, this is caused by several effects, such as natural,Doppler and pressure broadenings.[34]We are here interested in the phenomenon of pressure broadening which remains dominant in the considered temperature range.
The part of this study treats the core region of the resonance line. In other words, we attempt to calculate the full width at half maximumwand the shiftsof the the lithium resonance line atom Li(2s-2p)perturbed by the sodium Na(3s)atoms,where these atoms form a gas in the vicinity of emitting atoms. To accomplish this calculation,we adopted the simplified quantum mechanical model of Baranger.[38]This model treats the case where the spin-orbit effect is neglected in the range of considered temperatures.
Line-width and line-shift The line-widthwand the lineshiftsof Li(2p←2s) resonnance line perturbed by Na(3s)atoms are expressed by the following formula:[38]

where the minus sign in the shift means a blue or a red shift andnis the density number of the perturbing gas. The average〈v·Qw〉avand〈v·Qs〉avare calculated assuming the Maxwell distribution of relative velocitiesv. In terms of relative energyE=(¯hk)2/2μof the colliding atoms, these expressions become

withQwandQsare the line-width and the line-shift cross sections,given by the sums[38]


The elastic phase shiftsηl(E) for each energyEand angular momentumlare determined by solving numerically the radial wave equation

in which the wavefunctionsψl(R)vary asymptotically asR →∞like

which are defined by the following weighted averages[33]

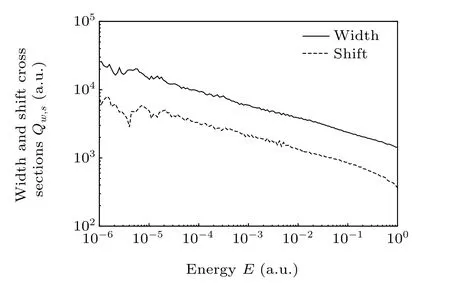
Our computed total line-width and line-shift cross sections for energies from 10-6a.u. to 1 a.u.are plotted on Fig.7.

Fig.7. Line-width and line-shift cross sections varying with energy.
Figure 8 illustrates the change of the rate coefficientsw/nands/nof the width and the shift, respectivily. We note the importance of these two coefficients at high temperature,and the same two figures show the significant divergence from the temperatureT. We present also in Table 8 some values of the width and the shift rates calculated by the quantum model of Baranger.[38]
In order to find the variation law of the line-width and line-shift rates as a function of temperatureT,we fit correctly the computed results of these rates to the mathematical expression of the form~αTβwithαandβbeing constant parameters. Their values are listed in Table 9. Representations of the width and shift rates in termsof temperatureTare made on the same Fig.8.

Table 8. The width and shift rate values at different temperatures.

Table 9. Fitting parameters of the width and shift rate coefficients as they appear in ~αTβ.

Fig.8. Width and shift rate coefficents w/n and-s/n as a function of temperature.
6. Conclusion
In this paper, we have primarily constructed the LiNa ground and excited interatomic potential curves as well as the transition dipole moments that connected them. To evaluate the reliability of our constructions, the rotational vibrational energy levels, the radiative lifetimes of excited states,and the diffusion coefficients have been carried out. We have then performed full quantum-mechanical calculation to simulate the Li(2p←2s)+Na(3s) absorption profile spectra and to determine the line-width and line-shift parameters. The results demonstrate the sensitivity of the far wing profiles on temperature and the appearance of two red satellite peaks located around the wavelength 862 nm and 1070 nm. However,the blue satellite predicted by the potential difference close to 440 nm has been detected by means to the modification already suggested by Lyyraet al.[37]which is able to highlight the weak satellite.
Acknowledgments
This work has been realized within the framework of the PNR project 8/423/4388. The authors acknowledge support from the Algerian Ministry of Higher Education and ANDRU.
- Chinese Physics B的其它文章
- Real non-Hermitian energy spectra without any symmetry
- Propagation and modulational instability of Rossby waves in stratified fluids
- Effect of observation time on source identification of diffusion in complex networks
- Topological phase transition in cavity optomechanical system with periodical modulation
- Practical security analysis of continuous-variable quantum key distribution with an unbalanced heterodyne detector
- Photon blockade in a cavity–atom optomechanical system

