
Spray-drying assisted layer-structured H2TiO3 ion sieve synthesis and lithium adsorption performance
2022-06-28 06:09:52MinxiaLiuDangWuDonglingQinGangYang
Minxia Liu, Dang Wu, Dongling Qin, Gang Yang
College of Chemical Engineering, Nanjing Tech University, Nanjing 211816, China
Keywords:Spray-drying Ion sieve Adsorption Lithium Dissolution loss
ABSTRACT A spray-drying assisted solid-state method to prepare spherical layer-structured H2TiO3 ion sieve(LSTIS)particles is reported herein.The effects of synthesis parameters (calcination temperature, calcination time, and the lithium-titanium molar ratio) on adsorption-desorption performance (the delithiation ratio, titanium dissolution loss, and the adsorption capacity) were investigated.The as-prepared LSTIS exhibited an equilibrium adsorption capacity of 30.08 mg·g-1 (average of 25.85 mg·g-1 over 5 cycles)and ultra-low titanium dissolution loss of less than 0.12% (average of 0.086% over 5 cycles).The LSTIS showed excellent selectivity toward Li+ in Na+, K+, Mg2+, and Ca2+ coexisting saline solutions where its adsorption capacity reached 27.45 mg·g-1 and the separation factors of Li+ over the coexisting cations exceeded 100.The data suggests that the LSTIS is promising to competitively enrich Li+ from saline solutions.
1.Introduction
The increasing demand for environmentally-benign vehicles has especially drawn attention to lithium-ion batteries, which involve several cathode materials such as LiCoO2, LiMn2O4,LiFePO4, and ternary cathode materials[1-17].The favorable electrochemical characteristics[18,19]of lithium leading to the rapidly growing lithium demand.It is critical to exploit lithium resources with high efficiency to ensure the supply of lithium feedstocks(Li2-CO3).Economically competitive lithium resources are found in minerals and brines.Comparatively, brines mining face technical challenges in dealing with problems such as the low Li+concentration and the interfering components, which remains far from settlement.More than 79% of the lithium reserves in China exist in salt lake brines and underground oil fields [20,21].The efficient brine lithium extraction technologies are therefore urgently needed to break through the bottleneck of the civil lithium supply[22].
Separating Li+from brines which contains massive cations with similar chemical properties is challenging.And huge efforts have been made [23]on solvent extraction [24,25], adsorption[26-28],and membrane technologies[29,30]over the last two decades.The possibility of Mg2+/Li+separation through membranes was confirmed,however,the rejection of nanofiltration membrane for monovalent cations showed little discrepancy [31-33].The lithium ion-sieves (LISs) has gradually been recognized promising thanks to the better cost-effectiveness evaluated in aspects of the adsorption capacity, selectivity as well as environmental-friendly nature[23].A series of manganese type LISs derived from LiMn2O4,Li4Mn5O12, and Li1.6Mn1.6O4have proven to be efficient for Li+recovery from saline solutions [34-36].However, the Mn2+dissolution loss caused by the disproportionation of skeleton Mn(III)during the de-intercalation of Li+remains unsatisfied which hinders further application [23,37,38].
A novel layer-structured H2TiO3ion sieve (LSTIS) [39]has become the research focus recently owing to its low metallic dissolution loss of several thousandths [40-43]and higher theoretical maximum adsorption capacity of 141.84 mg·g-1compared with manganese type LISs (39.69 mg·g-1of LiMn2O4, 58.98 mg·g-1of Li4Mn5O12, 72.35 mg·g-1of Li1.6Mn1.6O4).The LSTIS is fabricated in two steps.First, the precursor Li2TiO3is synthesized by the hydrothermal synthesis [43], the sol-gel [44], or the solid-state methods [34].Then the as-prepared Li2TiO3is immersed in acid to obtain LSTIS.The solid-state method seems preferred for industrialization for its simple, cost-effective, and high-yielding.However, the inadequate mixing of raw materials would lead to inaccurate stoichiometric product, sintering, and large particles[45], which is unfavorable for adsorbent.The sol-gel and hydrothermal synthesis though ensure the even mixing, are relatively sophisticated and costly, and thus difficult to industrialize.
Spray drying, a scalable drying technology well-established in many fields [46], can help directly transform solutions, suspensions, and slurries into solid powders with good dispersion and regular morphology [47-49].In this way, mixture powder with uniform composition and regular morphology is available[50,51], and therefore contributes greatly to fabrications of advanced materials [52-54].
In this work, the spray-drying was introduced to improve the uniformity of the precursors.Low melting point C2H3O2Li·2H2O was chosen as the lithium source.Fusible C2H3O2Li·2H2O helps to further enhance the dispersion of lithium source and titanium source [55].In addition, the thermal decomposition of C2H3O2-Li·2H2O during calcination releases a large amounts of gas, which can effectively avoid sintering of Li2TiO3particles.This work deals in detail with several synthesis factors (including the calcination temperature and time, and the Li/Ti molar ratio), physicochemical properties of LSTIS, and adsorption-desorption performance of LSTIS examined in low pH saline solution.
2.Experimental
2.1.Materials and reagents
Lithium acetate dihydrate(C2H3O2Li·2H2O,99%),absolute ethanol(CH3CH2OH,99.7%),hydrochloric acid(HCl,36%),lithium chloride (LiCl, 97%), ammonia (NH4OH, ≥25%-28%) was purchased from Sinopharm Chemical Reagent Co.,Ltd.(China).Titanium dioxide(IV)(TiO2,anatase,99.8%)was purchased from Aladdin Reagent Co., Ltd.(China).Ammonium chloride (NH4Cl, PT) was purchased from Shanghai McLean Biochemical Technology Co., Ltd.(China).
2.2.Preparation of LSTIS
Anatase TiO2and ethanol solution of C2H3O2Li·2H2O(0.056 g·ml-1)were mixed at various Li/Ti molar ratios and stirred magnetically with 530 r·min-1speed for 24 h to form a suspension.The resultant suspension was spray-dried using a spray-drier with a feed rate of 7 ml·min-1to obtain a uniformly mixed raw material powder.Atomizing gas (N2) with a flow rate of 37 L·min-1and atomizing pressure of 0.7 MPa was heated to 90 °C, and the outlet air temperature was 65°C.Then,the mixed powder was calcined at temperatures from 600 to 850 °C with an increasing speed of 2 °-C·min-1for different time(1,2,4,6 and 8 h),and naturally cooled to room temperature to obtain the precursor Li2TiO3.LSTIS was obtained by immersing Li2TiO3in 0.2 mol·L-1hydrochloric acid at 65 °C for 24 h under agitation conducted at 300 r·min-1.
2.3.Characterization
The crystalline structure was determined using an X-ray diffractometer (XRD, Rigaku Miniflex600, Japan) with Cu Kα radiation operating at 40 kV, 15 mA, 2θ scanning interval 10°-80°, scanning speed 10 (°)·min-1, scanning step size 0.02°.Thermal analysis was carried out using thermo gravimetric analyzer (TG-DSC, Netzsch STA449F3,Germany).Field emission-scanning electron microscope(FESEM, Hitachi S4800, Japan) and transmission electron microscope (TEM, JEOL JEM-2100Plus, Japan) were employed for morphological and structural analysis.The particle size information was obtained using a dynamic light scattering(DLS,Malvern Zetasizer Nano ZS90, UK).A Fourier-transform infrared spectrometer(FT-IR, Nicolet IS5, USA) was applied to analyze surface functional group.A surface area and porosimetry analyzer (Micromeritics,ASAP-2460,USA)was used to analyze specific surface areas of samples.The concentrations of different cations were measured using an inductively coupled plasma optical emission spectrometer(ICP-OES, PerkinElmer Optima 3000 DV, USA).
2.4.Adsorption-desorption properties
LSTIS was dispersed in 100 ml of NH4Cl/NH3·H2O buffered lithium-containing solution (pH = 9.4, 100 mg·L-1) with an adsorbent dosage of 1 g·L-1under magnetic stirring.The supernatant was sampled to measure Li+concentration.The adsorption capacities of LSTIS was calculated according to Eqs.(1) and (2):
whereQtis the amount of adsorbed Li+per gram adsorbent at timet,mg·g-1;C0is the initial Li+concentration,mg·L-1;Ctis the concentration of Li+at timet,mg·L-1;Vis the solution volume,L;mis the mass of the adsorbent added,g;Qeis the amount of adsorbed Li+per gram of adsorbent when adsorption reaches equilibrium,mg·g-1;Ceis the concentration of Li+when adsorption reaches equilibrium,mg·L-1.
The LSTIS regeneration was performed by soaking in 0.2 mol·L-1hydrochloric acid at 65 °C for 12 h.The eluent was sampled to determine the Li and Ti content by ICP-OES and calculate the lithium extraction ratio and titanium dissolution loss, denoted asRxherein, as shown in Eq.(3):
whereCxis the mass concentration of thexelement in the pickling solution,mg·L-1;Vis the volume of the pickling solution,L;andmxis the mass of thexelement in the precursor, mg.
2.5.Adsorption kinetics
Kinetic models pseudo-first-order and pseudo-second-order fittings based on solution/solid phase adsorption process were performed to simulate the lithium adsorption process of LSTIS.The dynamic equations are shown in Eqs.(4) and (5), respectively[56-59]:
whereK1andK2represent the pseudo-first-order and pseudosecond-order adsorption rate constants, respectively.
2.6.Adsorption isotherm
To understand the effects of initial lithium concentration on the equilibrium adsorption capacity, LSTIS was dispersed in lithiumcontaining solutions (10, 30, 50, 100, 150, 200 mg·L-1, pH = 9.4).The supernatant was sampled regularly until the attainment of equilibrium.The adsorption isotherms were fitted according to the Langmuir model (Eq.(6)) and Freundlich model (Eq.(7))[56,57,59]:
whereQmis the theoretical maximum adsorption capacity of the adsorbent, mg·g-1;KLis the Langmuir coefficient;KFis the Freundlich coefficient;nis an empirical constant.
2.7.Selectivity
LSTIS was dispersed in 100 ml of artificial saline solution(pH = 8.7) comprised of Li+, Na+, K+, Mg2+, and Ca2+with an adsorbent dosage of 1 g·L-1.The supernatant was collected to analyze the initial and equilibrium contents of different cations.The selectivity of LSTIS was evaluated by the distribution coefficientsKDcalculated according to Eq.(8) and separation factorcalculated according to Eq.(9):
where,KDis the distribution coefficient, ml·g-1;is the separation factor, andMrepresents the coexisting cations (K+, Na+, Ca2+,Mg2+) in the artificial saline solution;KD1is the distribution coefficient of Li+, ml·g-1; andKD2is the distribution coefficient ofM,ml·g-1.
3.Results and Discussion
3.1.Preparation of LSTIS
Thermogravimetric analysis was applied to investigate preliminary synthesis conditions.Fig.1 shows the TG-DSC curves of spraydried C2H3LiO2·2H2O and anatase TiO2mixture with a Li/Ti molar ratio of 2.00.The endothermic peak at 62.5°C without weight loss is ascribed to the melting of C2H3LiO2·2H2O.The endothermic peak at 132.5 °C accompanied with mass loss of 28.8% meets the dehydration of C2H3LiO2·2H2O which involves 25.3% theoretical mass loss.The higher mass loss is probably ascribed to minor lithium salt evaporation loss.Between 270 and 560°C,a endothermic peak and a strong exothermic peak accompanied with 34.7% mass loss are observed, suggesting the further pyrolysis of C2H3LiO2and reaction between C2H3LiO2and anatase TiO2(theoretical mass loss of 35.9%).Above 600°C,no significant change is observed in TG and DSC curves, indicating the termination of the reaction.
The Li/Ti molar ratio of previously spray-dried powder was fixed at 2.10 and calcined at aimed temperatures (600, 700, 750,800,and 850°C)for 2 h.Fig.2(a)shows the XRD patterns of Li2TiO3synthesized under different calcination temperatures, no impurity phase is observed, all samples are in accordance with monoclinic β-Li2TiO3standard XRD patterns(JCPDS 33-0831).The samples calcined at 600 °C exhibit weak and broad diffraction peaks, indicating that the crystallization of Li2TiO3occurs at low temperatures,which is mainly attributable to thorough mixing of lithium source and titanium source and exothermic reaction heat.The intensity of the XRD peak,especially the(002)peak at 18.6°increases with the calcination temperature, suggesting further grain growth [60].
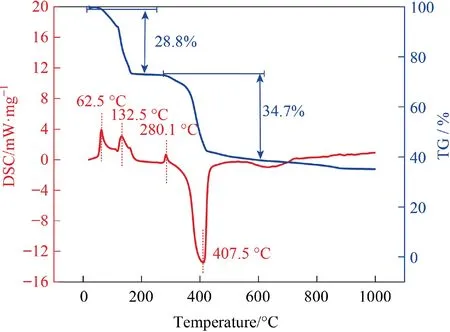
Fig.1. TG-DSC curves of spray-dried C2H3O2Li·2H2O and anatase TiO2 in air.

Fig.2. (a) XRD patterns of Li2TiO3 under different calcination temperatures (600,700, 750, 800, and 850 °C).(b) Effects of calcination temperature on lithium extraction ratio, titanium dissolution loss, and adsorption capacity.
As shown in Fig.2(b),the dissolution loss of titanium gradually decreases as the calcination temperature increases.When the calcination temperature rises to 750°C and above,the titanium dissolution loss of LSTIS were less than 0.1%.The lithium extraction ratios of LSTIS calcined between 600-800 °C remain at about 95%,but a sudden drop is observed at 850°C(90%).The adsorption capacity first rise to 29.8 mg·g-1at 800°C and decreases at 850°C.It is worth noting that Li2TiO3synthesized under high calcination temperature tends to exhibit both low titanium dissolution loss and relatively low lithium extraction ratio.This largely accounts for the high crystallinity and growth of grains that hinder the lattice diffusion in Li2TiO3[44,58,61].In turn,the incomplete delithiation leads to fewer lithium adsorption sites in LSTIS, resulting in worse adsorption performance in the subsequent adsorption section.Therefore, 800 °C was the optimal calcination temperature based on its adsorption capacity and dissolution loss.
Fig.3(a)shows the XRD patterns of samples with a raw material Li/Ti molar ratio of 2.10 calcined at 800°C for 1,2,4,6,and 8 h.The phase transformation takes place within 1 h, and no significant change is observed with continuous heating.
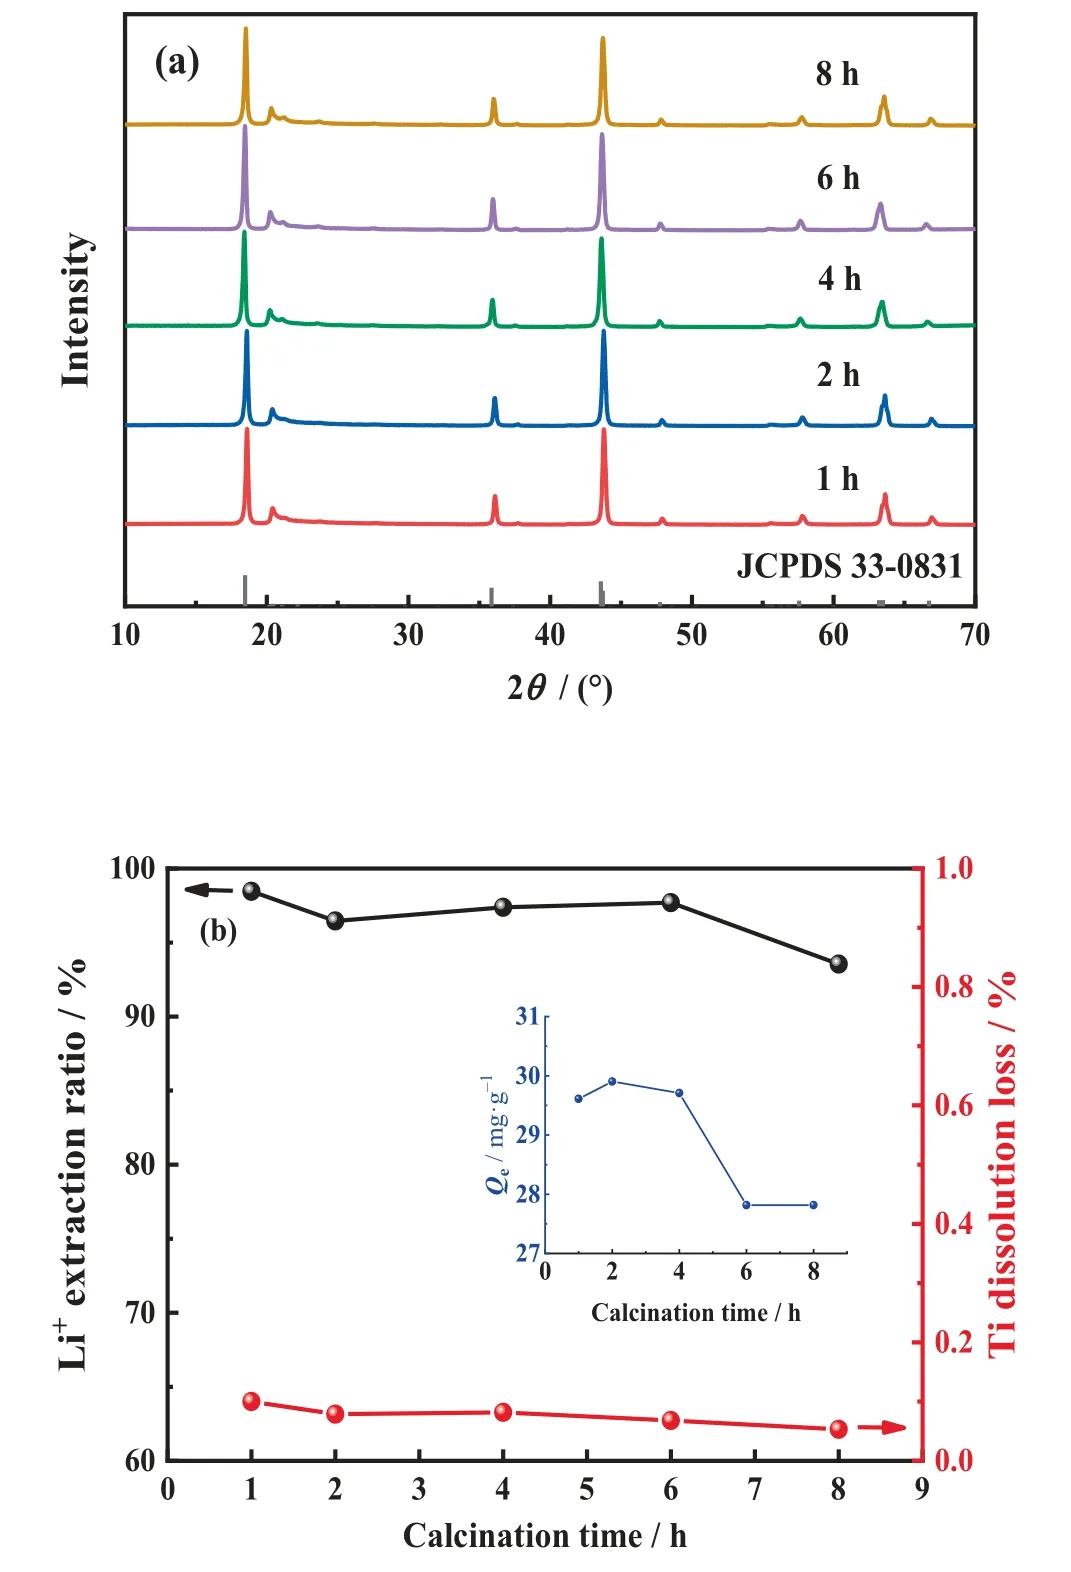
Fig.3. (a) XRD patterns of Li2TiO3 at different calcination time (1, 2, 4, 6, and 8 h).(b)Effects of calcination time on lithium extraction ratio,titanium dissolution loss,and adsorption capacity.
The desorption and adsorption properties of LSTIS are shown in Fig.3(b).As the calcination time increases to 2 h,the titanium dissolution loss decreases to 0.079%, further extended calcination time makes no obvious change.Nevertheless, the lithium extraction ratio decreases slightly with prolonged time, and therefore the adsorption capacity decreases correspondingly.In addition,longer calcination time leads to the unfavorable agglomeration of particles[45,62].Thus 2 h was selected as the optimized calcination time.
Samples with different raw material Li/Ti molar ratios (1.80,2.00, 2.05, 2.10, 2.15, and 2.20) were calcined at 800 °C for 2 h,and the XRD patterns are shown in Fig.4(a).The presence of the cubic spinel Li4Ti5O12phase in samples with Li/Ti molar ratios lower than 2.10 is ascribed to the deficiency of lithium, indicating that minor evaporation loss of the lithium source during the calcination.As the Li/Ti molar ratio increases to 2.10 and above, the characteristic peaks match well with monoclinic β-Li2TiO3.
It can be observed from Fig.4(b) that the titanium dissolution loss are lower in samples with Li/Ti molar ratios greater than 2.00, while the extraction ratio of lithium decreases when the Li/Ti molar ratio rises above 2.10.The adsorption capacity reaches a maximum of 29.25 mg·g-1at a Li/Ti molar ratio of 2.10 and then decreases as the Li/Ti molar ratio rises.This phenomenon is mainly ascribed to the nonstoichiometry defects, lithium-destitute would lead to the reduction of adsorption sites and lithium-rich would lead to lattice distortion [60,63].Both defects adversely affect the intercalation-deintercalation of Li+,resulting in an inferior adsorption capacity [44,64].Therefore, the Li/Ti molar ratio of 2.10 was out of comprehensive consideration to ensure both desorption and adsorption performance, hence 2.10 was selected as the optimized Li/Ti molar ratio.
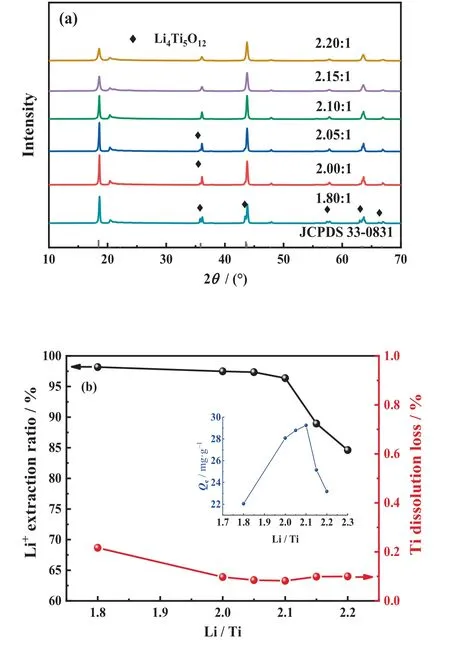
Fig.4. (a)XRD patterns of Li2TiO3 at different Li/Ti molar ratios(1.8,2.0,2.05,2.10,2.15, 2.2).(b) Effects of Li/Ti molar ratio on lithium extraction ratio, titanium dissolution loss, and adsorption capacity.
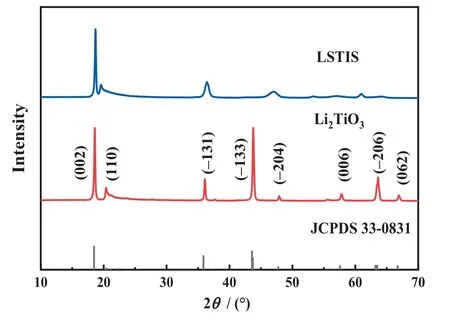
Fig.5. XRD patterns of Li2TiO3 and LSTIS obtained by Li2TiO3 after acid leaching.
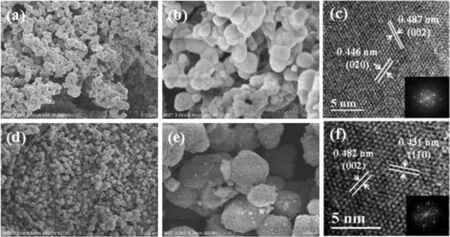
Fig.6. (a,b)SEM images of precursor Li2TiO3;(c)HRTEM images of precursor Li2TiO3(inset is the FFT pattern);(d,e)SEM images of LSTIS;(f)HRTEM images of LSTIS(inset is the FFT pattern).
3.2.Sample characterization
Fig.5 shows the XRD patterns of Li2TiO3and LSTIS.Although some characteristic peaks shift to higher angles, broaden, weaken,or even disappear after acid leaching, LSTIS still maintains the structure of monoclinic β-Li2TiO3.The deviation of diffraction peaks (002), (-131), and (-204) is attributed to the Li-H ionexchange which decreases the lattice parameters according to the Bragg equation [65].However, the ion-exchange reaction may occurex-situpartially owing to the different chemical nature of H+and Li+,i.e., H+tends to exists in the crystal in a way of electrostatic attraction, while Li+tends to be ionically bonded in the Li2TiO3framework.This leads to the damage of the crystal structure,manifested as the broadening of the(-131)and(-204)peaks and the reduction in (-133), (062), and (-206) peaks [60].
The crystallite size was also calculated by the Scherrer equation based on the XRD patterns(Fig.5).For Li2TiO3and LSTIS,the crystallite sizes are 41.7 nm and 39.5 nm respectively.The shrinkage of crystallite can be ascribed to the reduction of lattice parameters.
As shown in Fig.6(a)and(b),the precursor Li2TiO3particles are spherical with a smooth surface and have a uniform particle size of 400-500 nm.After acid treatment,the LSTIS particles(Fig.6(d)and(e)) maintain the spherical structure with a rougher surface and more polydispersity.The particle size distributions depicted in Fig.7(a)and(b)further confirm the reduction of particle size after pickling.While the crystallite size of Li2TiO3and LSTIS calculated using Scherrer equation are about 40 nm, indicating these submicro particles are consist of fine primary particles.The HRTEM images show high-quality lattice fringes assigned to the (002)and(020)planes in Li2TiO3and the(110)and(002)planes in LSTIS,indicating the high degree of crystallization and structural stability of LSTIS.
Based on the IUPAC classification, the N2isotherms for Li2TiO3and LSTIS depicted in Fig.8 are both type IV.The H4 hysteresis loopin the N2isotherm of LSTIS depicted in Fig.8(b)indicates the introduction of more mesopores during pickling [66,67], which is further confirmed by the BJH pore size calculation method (Li2TiO35.1453 nm,LSTIS 8.1329 nm).The acid treatment also has a significant effect on the specific surface area.The BET surface area of Li2-TiO3is determined to be 6.97 m2·g-1and enlarged to 76.60 m2·g-1after acid treatment.There are two reasons for the increment,i.e.,the improved polydispersity (verified by the SEM images) and the introduction of mesopores.
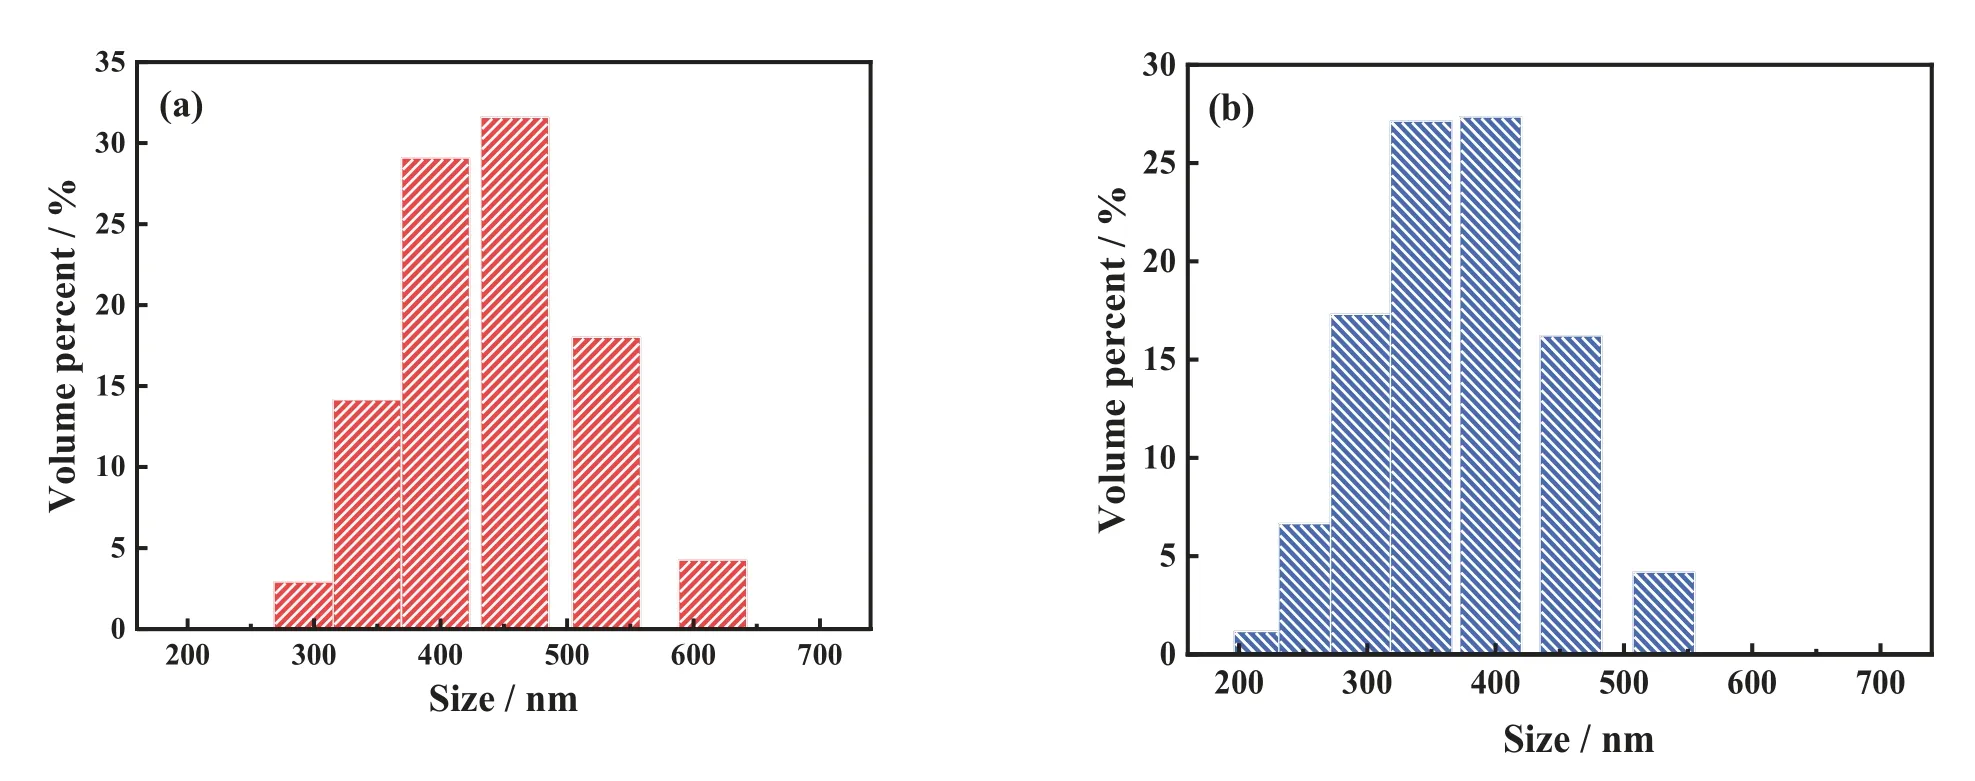
Fig.7. The particle size distributions of (a) precursor Li2TiO3 and (b) LSTIS.
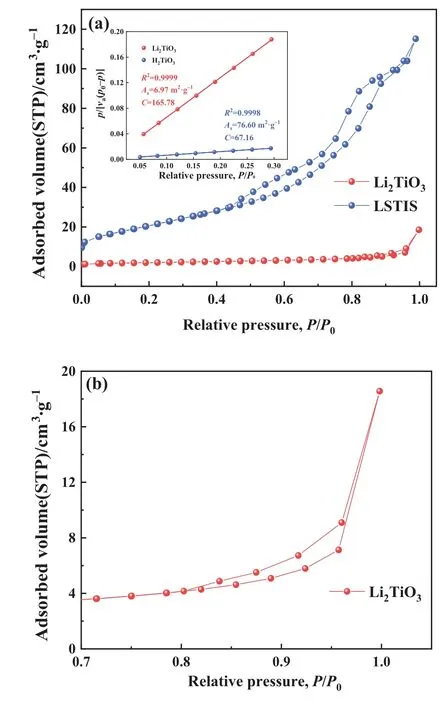
Fig.8. Nitrogen adsorption and desorption curves of precursor Li2TiO3 and LSTIS.

Fig.9. FT-IR spectra of precursor Li2TiO3 and LSTIS.
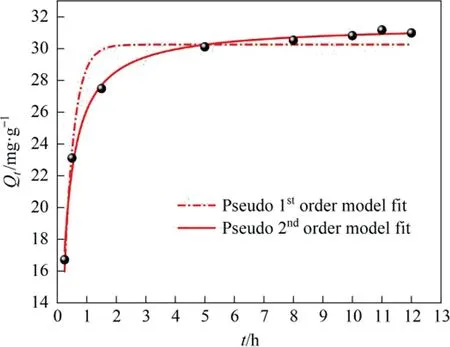
Fig.10. Variation of lithium adsorption capacity as a function of time and corresponding pseudo-first-order and pseudo-second-order kinetic models.
Fig.9 shows the FT-IR spectra of Li2TiO3and LSTIS.Both Li2-TiO3and LSTIS display broad -OH stretching vibration bands between 3600 and 3000 cm-1.Nevertheless, for LSTIS, the adsorption bands within 3600-3000 cm-1are stronger and a distinct adsorption peak appears at 3489 cm-1, confirming massive adsorbed water [68]and another type of -OH.Herein, it is presumed that the adsorption appears at 3489 cm-1should be ascribed to the combination of lattice oxygen and H+during Li-H ion-exchange reaction.Three observed bands at 2360,1650, and 570 cm-1correspond to Ti-O [69], incorporated water bending vibration of H-O-H, and Li-O stretching vibrations [70],respectively.
3.3.Adsorption kinetics
As shown in Fig.10, the adsorption capacity reaches 27 mg·g-1in the first 2 h.Then, the growth rate slows down and the adsorption capacity reaches 30.2 mg·g-1(98% of the equilibrium adsorption capacity) after 5 h and finally attains equilibrium(30.98 mg·g-1) after 12 h.The descending adsorption rate is due to the continuous reduction of adsorption sites during the Li+adsorption process.The fitting results depicted in Table 1 show that the pseudo-second-order kinetic model (R2= 0.9927) better describes the adsorption process of LSTIS than the pseudo-firstorder kinetic model (R2= 0.9308).concentrations (10, 30, 50, 100, 150, and 200 mg·L-1).
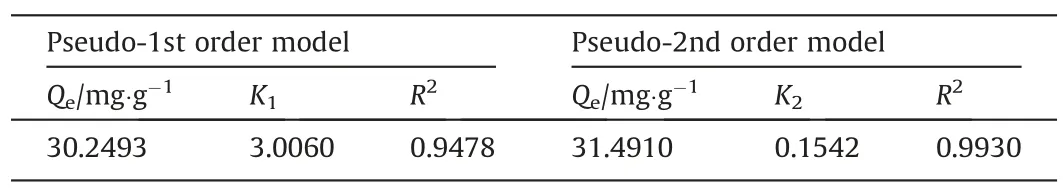
Table 1Fitting parameters of the pseudo-first-order kinetic model and pseudo-second-order kinetic model
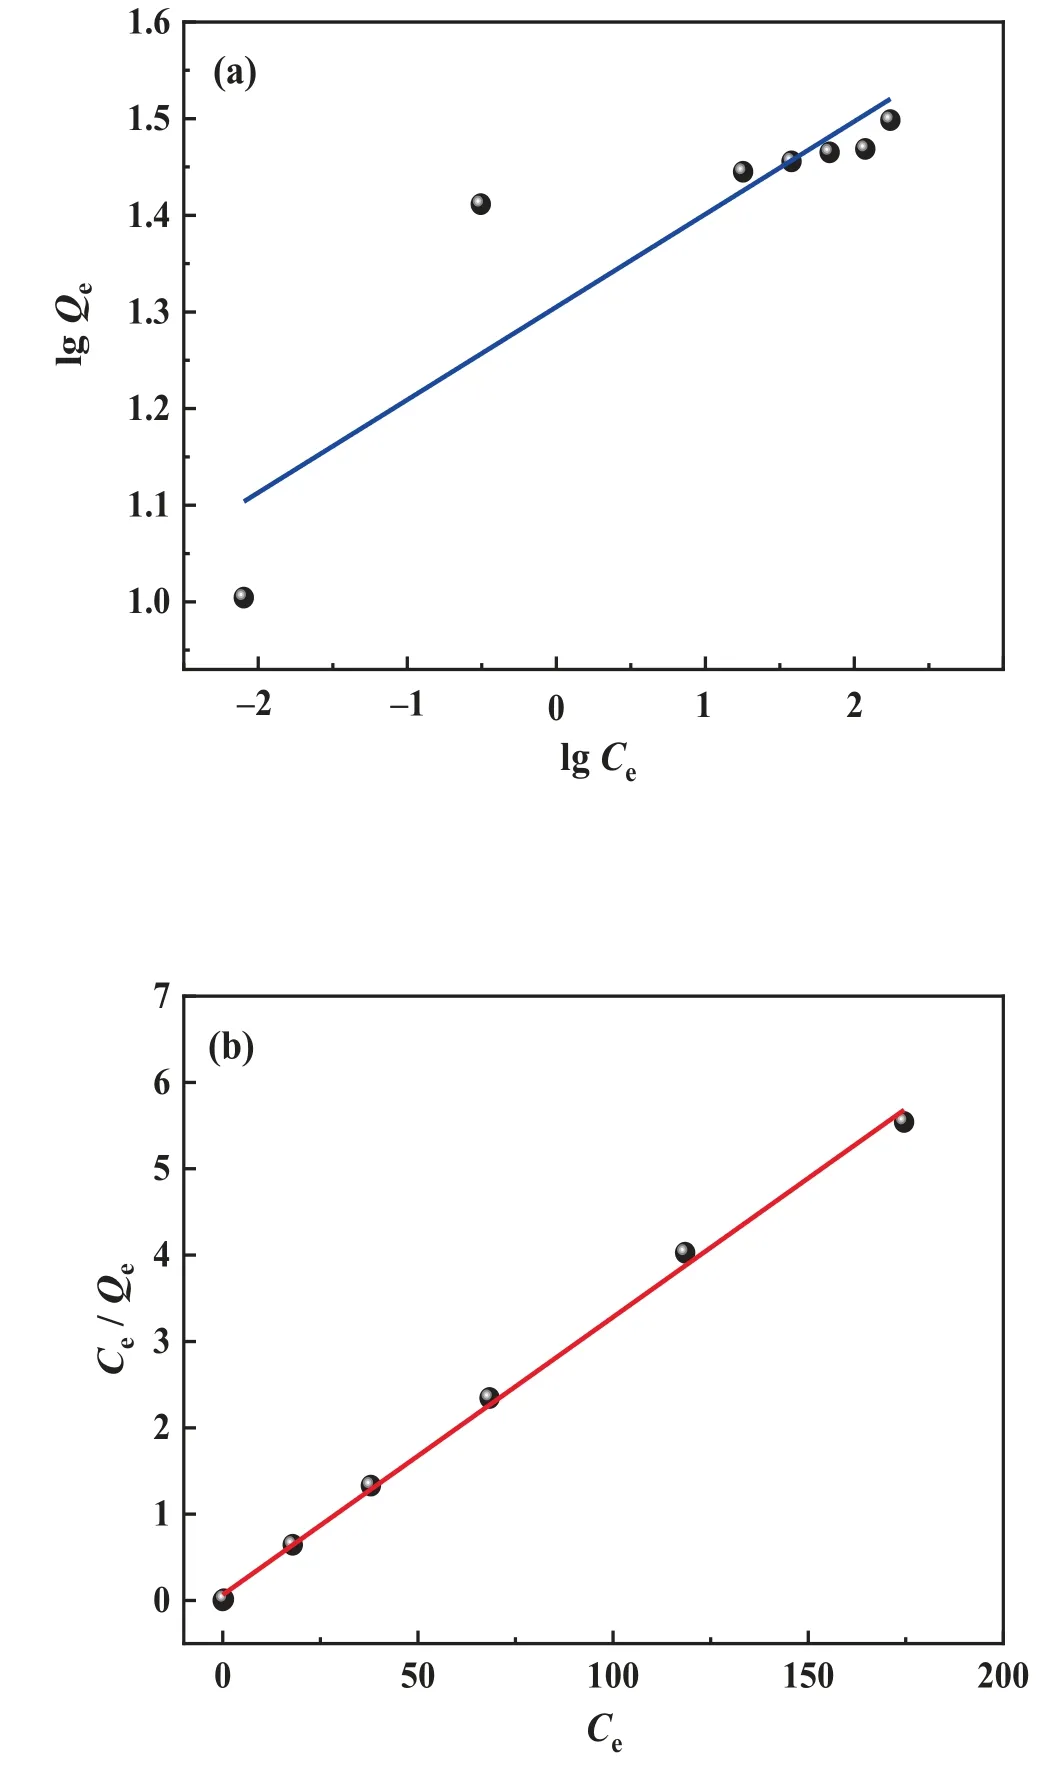
Fig.11. (a)Freundlich and(b)Langmuir adsorption isotherm model fitting of LSTIS using
3.4.Adsorption isotherm model
The LSTIS adsorption isotherm was obtained usingbuffered lithium-containing solutions(pH=9.4)with different initial concentrations.The Langmuir adsorption isotherm model and the Freundlich isotherm model were employed to analyze the data.The resultant fitting curves and parameters are shown in Fig.11 and Table 2, respectively.The result shows that the Langmuir model (0.9974) is more suitable in describing the Li+adsorption isotherm behavior of the LSTIS as compared with the Freundlich model (R2=0.7583).The calculated maximum adsorption capacity was 31.08 mg·g-1, almost equivalent to the actual equilibrium adsorption capacity (30.98 mg·g-1), this result reveals that the Li-H ion-exchange of LSTIS occursviamonolayer adsorption [71].The result is lower than the theoretical maximum adsorption capacity,which is owing to only part of the adsorption site in LSTIS is active.There are two types of lithium in Li2TiO3, which are distributed in the Li layer and the [Li1/3Ti2/3]O2layer [72].During the acid treatment of Li2TiO3, lithium in both layers completely exchanges with H.Nevertheless, the fully exchanged [H1/3Ti2/3]O2layer is inert and would not undergo further ion-exchange reactions [60,73], and thus results in a lower adsorption capacity (see Fig.12).
3.5.Selectivity and reusability
The selective adsorption results are given in Table 3.The equilibrium adsorption capacity for competitive alkali and alkaline earth cations is no more than 0.26 mg·g-1, whilst the lithium uptake reaches 27.45 mg·g-1, which is slightly lower than that in as-prepared Li+solution with pH = 9.4.Because ion sieve adsorption is a Li-H ion-exchange process, a higher pH is beneficial in the neutralization of the H+deintercalated during the ionexchange process.The separation factors of Li+to Na+, K+, Mg2+,and Ca2+all exceeded 100, further demonstrating that LSTIS has good selectivity for lithium in saline systems.

Table 2Fitting parameters of Freundlich and Langmuir adsorption isotherm models
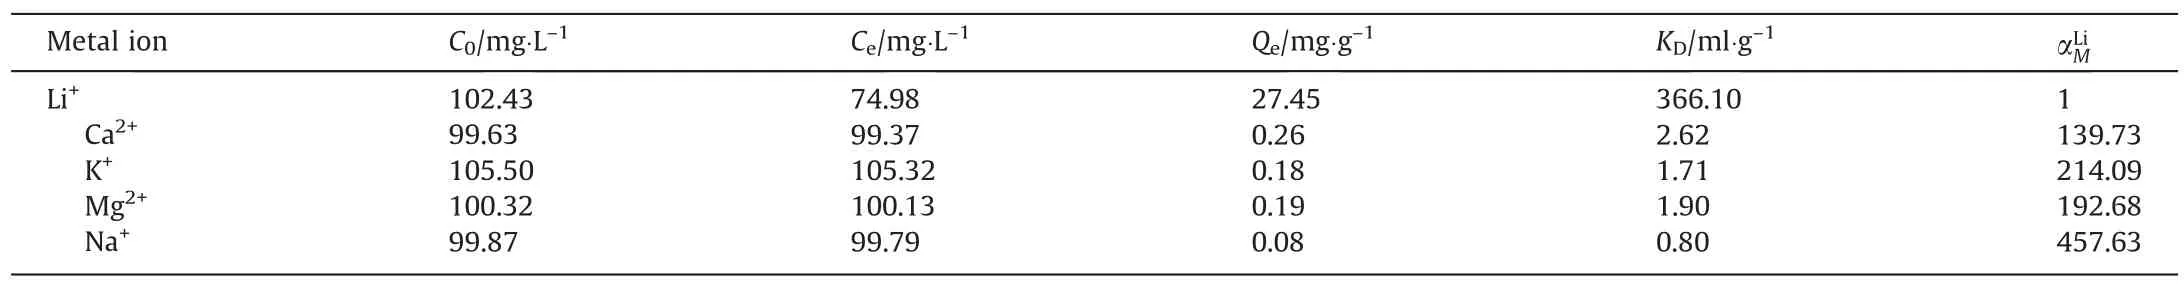
Table 3Separation properties of LSTIS in saline solution
The dissolution loss and equilibrium adsorption capacity are important parameters for adsorbent evaluation,and the cyclic performance is of guiding significance to further applications.Fig.13 shows the cyclic performance of LSTIS.The titanium dissolution loss remained very low (below 0.12%), and a slow decay tendency was observed, and the lithium equilibrium adsorption capacity remained above 22.7 mg·g-1(about 73% of the initial adsorption capacity) after 5 cycles.
High selectivity towards Li+and favorable cyclic performance prove that LSTIS is a superior adsorbent for lithium extraction which provides new possibilities for industrial applications.
4.Conclusions
LSTIS was successfully prepared using a highly-dispersive,spray-drying assisted solid-state method.The effects of several factors including the calcination temperature, calcination time, and the Li/Ti ratio of the raw materials on adsorbent properties were comprehensively investigated.High calcination temperature and long calcination time contribute to improve the stability of LSTIS and thus reduce the dissolution loss.At the same time, however,the extraction ratios of lithium reduce.Both excessive lithium and deficient lithium have adverse effects on the lithium exchange capacity and titanium dissolution loss.Herein, the verified optimum synthesis conditions are as follows:raw material Li/Ti molar ratio of 2.1 and calcination at 800 °C for 2 h.Under the optimum conditions, the titanium dissolution loss of LSTIS was less than 0.12% (average of 0.086% over 5 cycles) and the equilibrium adsorption capacity reached 30.98 mg·g-1(average of 25.85 mg·g-1over 5 cycles).The adsorption study suggested that the adsorption occurs via a monomolecular layer chemical adsorption process.The high selectivity towards Li+and favorable cyclic performance prove that LSTIS is a superior adsorbent for lithium extraction which provides new possibilities for industrial applications.
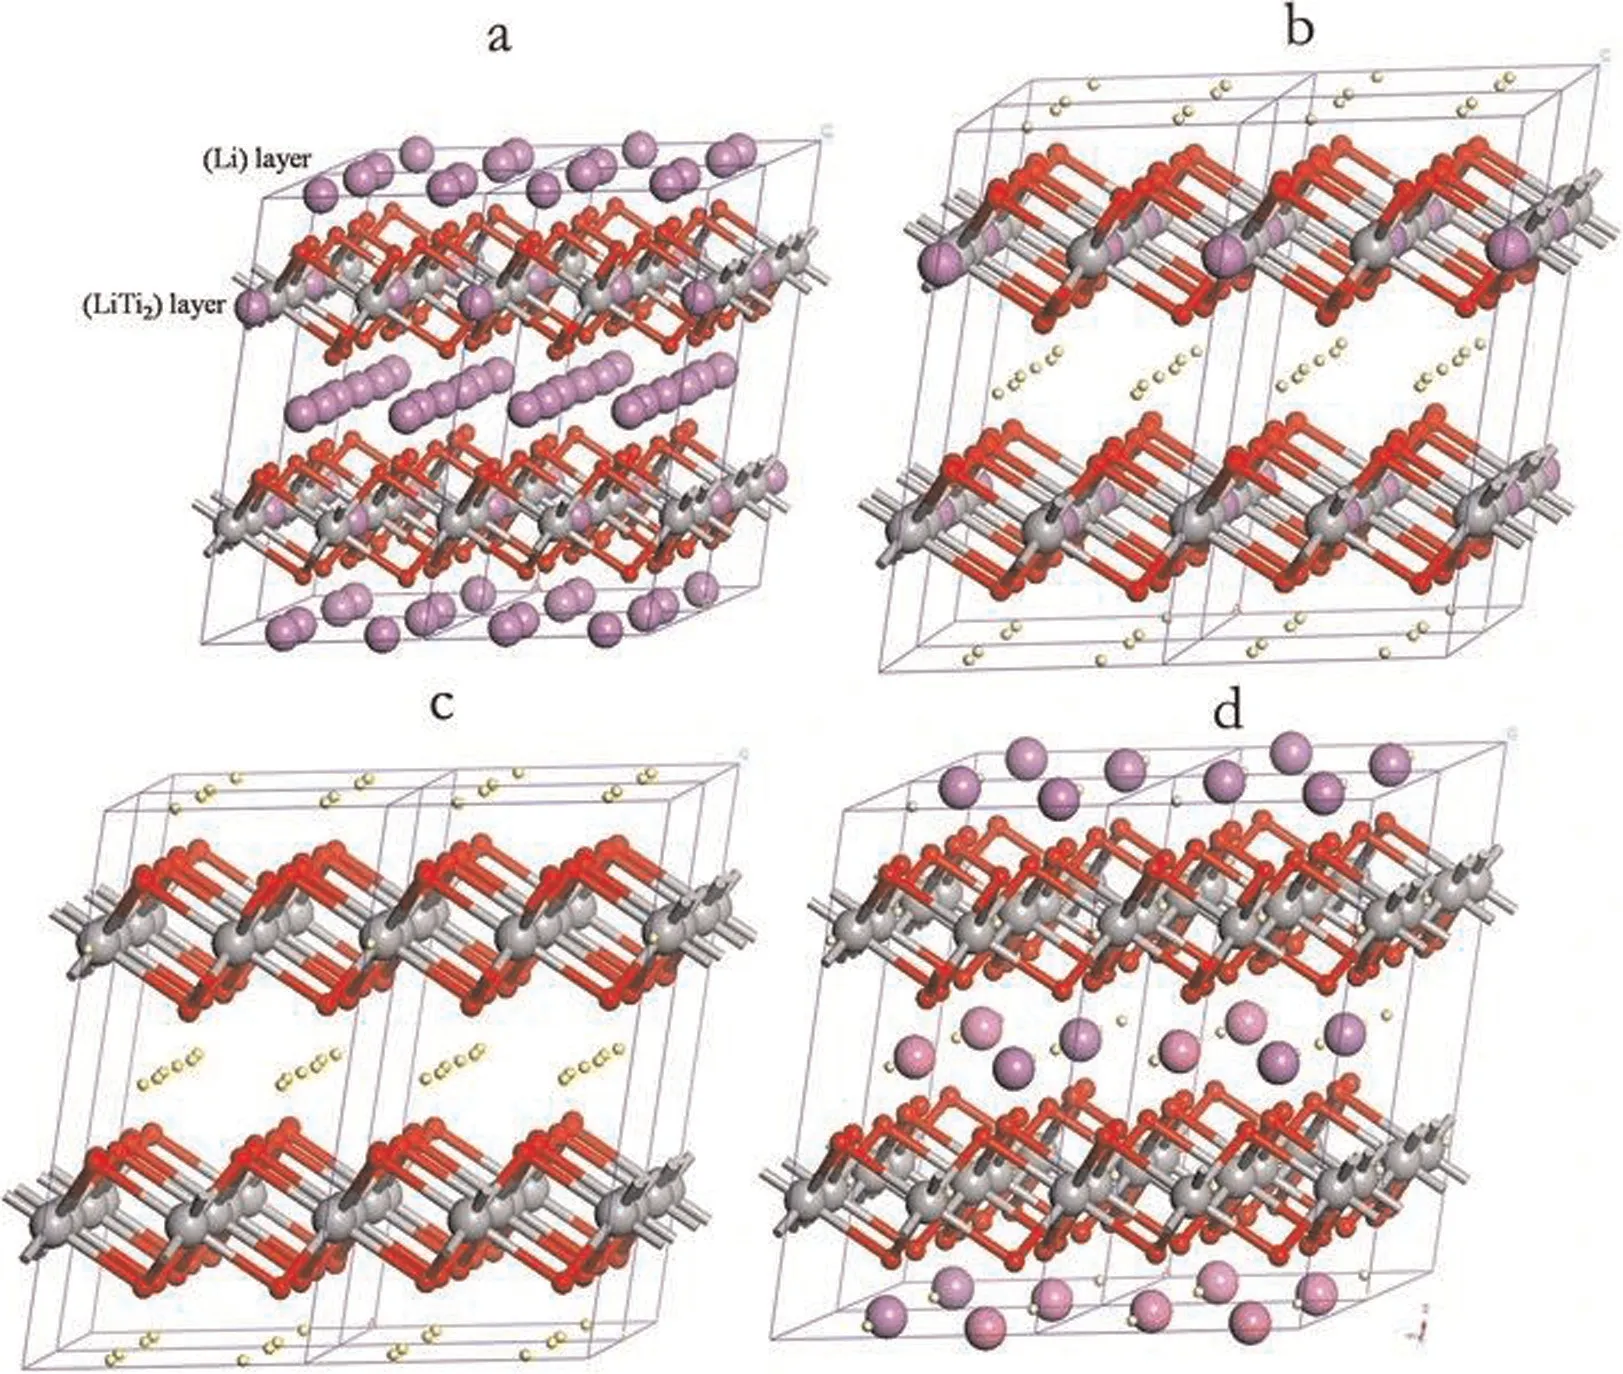
Fig.12. Crystal structures of (a) the layered Li2TiO3; (b,c) during pickling; (d) after ion exchange (Li as purple ball, H as yellow ball, O as red ball, Ti as gray ball) [60].
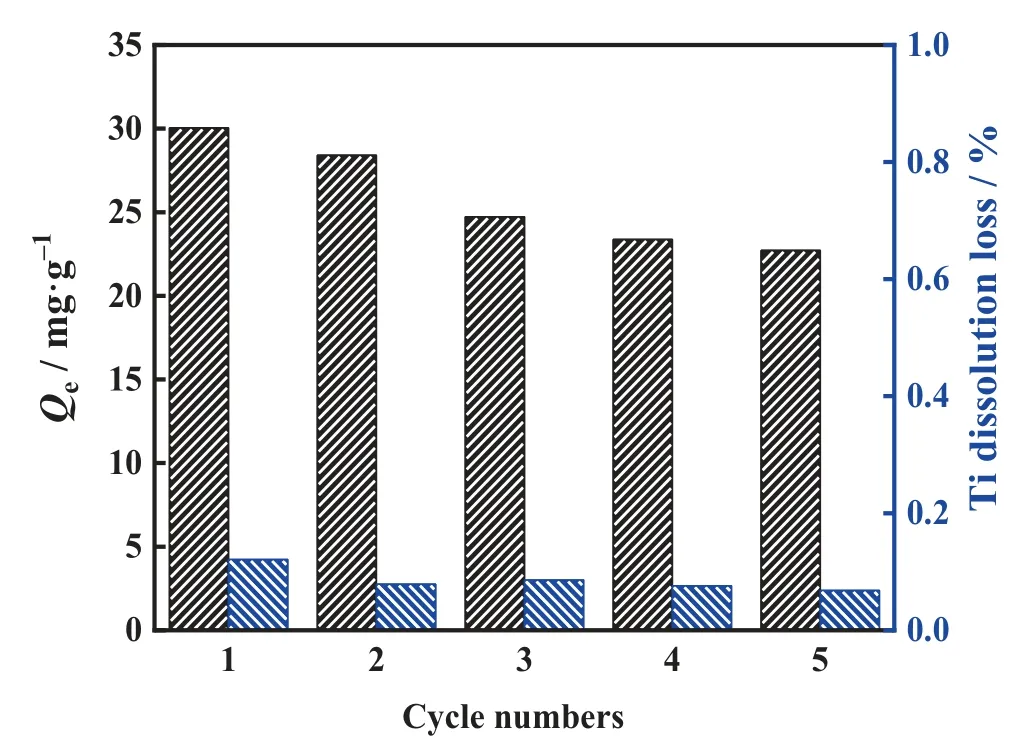
Fig.13. Cyclic adsorption-desorption performance of LSTIS.
Declaration of Competing Interest
The authors declare that they have no known competing financial interests or personal relationships that could have appeared to influence the work reported in this paper.
Acknowledgements
This work was financially supported by the Prospective Joint Research Project of Industry, University and Research in Jiangsu Province (BY2016005-11), and National Science and Technology Support Plan (No.2013BAE111B03).
 Chinese Journal of Chemical Engineering2022年5期
- Chinese Journal of Chemical Engineering的其它文章
- Notes for Contributors
- Solubility determination and thermodynamic modeling of bis-2-hydroxyethyl terephthalate (BHET) in different solvents
- Insights into the cross-amyloid aggregation of Aβ40 and its N-terminal truncated peptide Aβ11-40 affected by epigallocatechin gallate
- Numerical study on hydrodynamic characteristics of spherical bubble contaminated by surfactants under higher Reynolds numbers
- Innovative hydrophobic/hydrophilic perfluoropolyether (PFPE)/polyvinylidene fluoride (PVDF) composite membrane for vacuum membrane distillation
- Fabrication and characterization of hierarchical porous Ni2+ doped hydroxyapatite microspheres and their enhanced protein adsorption capacity