
On-chip classification of micro-particles using laser light scattering and machine learning
2022-06-20 06:19MushirHussinXiolongLiuJunZouJinYngZeeshnAliHmoodUrRehmnNongyueHeJinguoDiYongjunTng
Chinese Chemical Letters 2022年4期
Mushir Hussin,Xiolong Liu,Jun Zou,Jin Yng,Zeeshn Ali,Hmood Ur Rehmn,Nongyue He,Jinguo Di,*,Yongjun Tng,*
a Innovation Practice,Shenzhen Polytechnic,Shenzhen 518055,China
b School of Materials and Chemical Engineering,Hunan Institute of Engineering,Xiangtan 411104,China
c Department of Electrical Engineering,College of EME,National University of Sciences and Technology,H-12 Islamabad,Pakistan
d State Key Laboratory of Bioelectronics,School of Biological Science and Medical Engineering,Southeast University,Nanjing 210096,China
ABSTRACT The rapid detection of microparticles exhibits a broad range of applications in the field of science and technology.The proposed method differentiates and identifies the 2 μm and 5 μm sized particles using a laser light scattering.The detection method is based on measuring forward light scattering from the particles and then classifying the acquired data using support vector machines.The device is composed of a microfluidic chip linked with photosensors and a laser device using optical fiber.Connecting the photosensors and laser device using optical fibers makes the device more diminutive in size and portable.The prepared sample containing microspheres was passed through the channel,and the surrounding photosensors measured the scattered light.The time-domain features were evaluated from the acquired scattered light,and then the SVM classifier was trained to distinguish the particle’s data.The real-time detection of the particles was performed with an overall classification accuracy of 96.06%.The optimum conditions were evaluated to detect the particles with a minimum concentration of 0.2 μg/mL.The developed system is anticipated to be helpful in developing rapid testing devices for detecting pathogens ranging between 2 μm to 10 μm.
Keywords:Particle’s detection Laser light scattering Waveform features Support vector machines Lab-on-chip
During the last decade,a lot of research has been done in developing new techniques for particle detection and characterization.Real-time detection of microparticles has several applications in medical sciences,including point-of-care biosensing,particle contamination,and diagnosis and detection of diseases.The method based on surface-enhanced Raman scattering(SERS)was developed for the rapid determination of alternariol(AOH)in pear fruits[1].The on-chip sensor was developed to detect particle contamination in hydraulic oil using an impedance sensor[2].The microfluidic chip was designed to detectStaphylococcus aureususing immunomagnetic separation and fluorescence labeling[3].Light scattering techniques have three advantages;(1)non-invasive and complicated sample preparation is not required except sample dilution,(2)light scattering methods are easy to use and provide rapid results,and(3)relatively inexpensive instruments are used to develop the particle detection system[4].In addition,several design factors are considered for developing detection devices,including miniaturization,portability,user-friendly,economical testing,and less production cost[5,6].
Various techniques are being used to characterize particles,including dynamic light scattering,elastic light scattering,inelastic light scattering,and MIE theory[7].These techniques require implementing statistical analysis and mathematical modeling on the data for distinguishing particles,which are complex and use more computational power.Flow cytometry is one of the commercially available equipments used for analyzing and counting particles present in fluids.Flow cytometry characterizes the particles by measuring optical scattering properties.The commercial instrument offers high output up to 105particels/s[8].However,there are several drawbacks associated with cytometry,including high cost,sophisticated and bulky instruments.The fine particle sensor was developed using multi-angle light scattering.Three photodiodes were used to collect the scattered light,and the data fusion theory was applied to calculate the particle size[9].However,the technique is valid only for detecting particles from the atmosphere or in air medium.The hybrid integrated microsystem using CMOS technology was developed for particle detection in liquid suspension.The detection procedure was based on imaging technology with a detection limit of 10 μm sized particles.The chip circuitry is complicated because of embedded electrical components that make the chip much expensive[10].
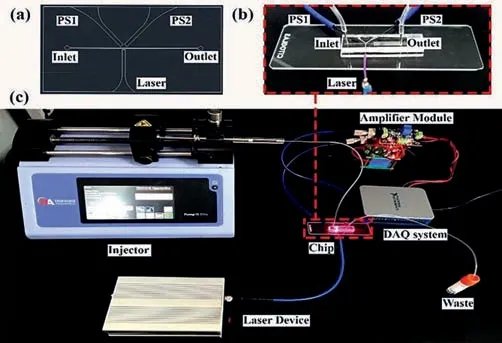
Fig.1.(a)The 2D scheme of the microfluidic chip designed using AutoCAD software.(b)Fabricated microfluidic device connected with optical fibers,inlet,and outlet channel.(c)Experimental setup for performing the sample classification experiment to acquire scattering light data.
The research aimed to develop an integrated and miniaturized microfluidic device that reduces the manufacturing cost,lowers the instrument size,improves portability,and shortens detection time.Our work follows the preceding research for detecting microbial particles based on measuring laser scattering from the sample[11–13].The previously developed system was bulky,and the detection method was based on acquiring dynamic light scattering from the sample.Here,we present the design,fabrication,and testing of an on-chip device linked with optical fibers for passing and collecting the scattered light.The proposed method uses forward light scattering as the basic principle for the rapid classification of particles.The variation in size,shape,and material of the particles create unique light patterns[14].Therefore,different intensities of the forward scattered light at various angles can be used to identify particles.
The microfluidic chip with a single channel was fabricated to pass the testing sample.The laser light and a pair of photosensors were coupled inside the chip using an optical fiber.The light was passed from the channel where the test sample passed,and a pair of photosensors collected the scattered light.The scattered light was converted from the light to an electrical signal(voltage)using photosensors.The noise was removed from the data,and the time-domain features were extracted.The acquired features were trained to develop support vector machines(SVM)classifier for data classification.The results were validated by testing the classifier using testing data.
The assembly for optical scattering consists of four parts:microfluidic chip,laser light,photosensors,and data acquisition device.The initial design of the microfluidic chip was created using AutoCAD software(version R.47.0.0,2021,Autodesk,USA).The microfluidic chip was fabricated using soft lithography and polydimethylsiloxane material(PDMS)[15].The laser light with a wavelength of 650 nm was pointed towards the channel where the sample flowed continuously.A pair of photodiodes were positioned at 45° in forward direction of the laser light referenced to the microfluidic channel.The positioning of the photodiodes is to ensure the capturing of maximum scattering of light.Equipment details are mentioned in Supporting information.Fig.1a shows the 2D design of the microfluidic chip created by using AutoCAD software.The two optical fibers were connected with photosensors,while the other was connected with a laser device.Fig.1b shows the image of the developed microfluidic chip connected with optical fibers for linking two photosensors(PS1 and PS2)and laser light.Whereas the inlet was used to inject the test sample,and the chip outlet was used to remove the sample waste.Fig.1c shows the overall experimental setup for acquiring the scattered light from the sample using a microfluidic device.
The NI-USB 6001(National Instruments,United States)is the data acquisition device set at a 1 kHz sampling frequency to read 1000 data values per second.The data acquisition assembly was interfaced with a computer using MATLAB software(version R2020b,MathWorks).The acquired data were further processed for features evaluation after removing unwanted noise using the Butterworth filter[16].
The sample concentration is the critical parameter in particle classification using light scattering.When the concentration of particles is too less,insufficient light scattering will be achieved,leading to a loss in data and affecting the measurement results.Similarly,when the concentration of the particles is very high,the light scattering will be distorted,and unstable data will be achieved due to particle-particle interactions[17].In both cases,the output results will be noisy,and the wrong interpretation of the particles will be expected.Therefore,the evaluation of the optimum concentration is essential to achieve accurate results.The 2 μm(22305–10)and 5 μm(22306–1)sized spherical particles with an initial 10 mg/mL concentration were purchased from Beaver Beads,China.The concentration of the particles was diluted to create five different dilutions of 200,20,2,0.2,and 0.02 μg/mL.Each dilution was used as a test sample to estimate the optimum dilution for acquiring higher classification accuracy.Then,the samples were injected into the microfluidic chip for collecting light scattering.
A pair of photosensors were used for collecting the scattered light from the sample in the microfluidc chip.Therefore,two waveforms were acquired for each experiment.Five different timedomain waveform features were evaluated from the data after removing noise.Each feature provides the unique attribute of the waveform.The data segmentation was applied that split the data into small segments with a segment size of 250 ms for evaluating features.The segment was displaced over the waveform with an increment of 150 ms after evaluating features from the previous segment[18].The data features are presented by five different statistical moments:standard mean,standard variance,skewness,kurtosis,and coefficient of variation.The standard mean defines the average values in the segmented waveform.Standard variance measures that how far the waveform moves away from the mean value.Skewness describes the symmetry of signal distribution that indicates how the waveform moves away from the normal distribution.Kurtosis defines the distribution shape of a signal relative to Gaussian distribution.The coefficient of variation is the value acquired by the ratio of standard deviation to the mean value.The coefficient of variation is the value acquired by the ratio of standard deviation to the mean value[19].
The support vector machine algorithm is based on statistical learning tool.SVM is a supervised machine learning method used for finding a function in multidimensional space to separate training data with known labels[20].The calculated features from two different samples were labeled to define each class of particles.The features obtained from the 2 μm sized particles were labeled by 1,whereas the obtained features from 5 μm sized particles were labeled by 2.The labeled features were combined and arranged randomly for applying SVM.The features were divided into two groups,the training data set contained 70% of the features,and the remaining 30% features were used as a testing dataset.The training data were used to create SVM model,and then the trained SVM model was tested by predicting the testing data.
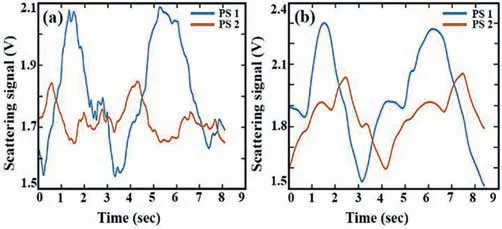
Fig.2.The output waveforms were acquired by light scattering from the particles:(a)2 μm,(b)5 μm.
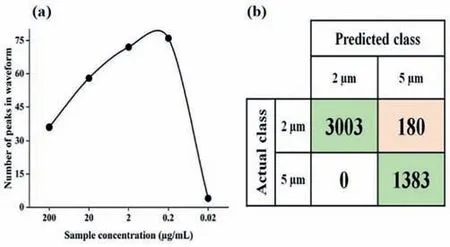
Fig.3.(a)Number of peaks acquired from five different dilutions of the sample.(b)Confusion matrix plotted from the parameters obtained from the classification of 2 μm and 5 μm sized spherical particles.
A single syringe pump was used to inject the diluted samples into the chip with a speed of 50 μL/h.The experiments were performed separately for different samples containing 2 μm and 5 μm sized particles.The laser light was passed through the sample,and the surrounding pair of photosensors acquired the scattered light converted to an electrical signal.Fig.2 shows the data collected by scattered light waveform from two different samples containing 2 μm and 5 μm sized particles.The waveforms acquired from two different samples show unique variations with time.Thus,the nature of non-uniform signals is efficient in generating distinct features used for classifying the signals.
Initially,five different concentrations of the samples(200,20,2,0.2,and 0.02 μg/mL)were prepared and tested to get the scattered light waveforms.Then,the number of peaks was acquired from the waveform to estimate the optimum concentration.The peaks are the maxima and minima of the waveforms used to describe the variations occurring in the data.The recorded number of peaks were 36,58,72,76,and 4 for each of the concentrations 200,20,2,0.2,and 0.02 μg/mL,respectively,as shown in Fig.3a.The higher number of peaks was 76 at a concentration of 0.2 μg/mL from the given results.Therefore,the sample concentration was maintained at 0.02 μg/mL for performing the identification experiments.
The two samples containing 2 μm and 5 μm sized particles were prepared with a concentration of 0.02 μg/mL to perform particle classification experiments.Each of the two samples was injected separately in the microfluidic chip,and the acquired data were used to estimate the time-domain features.Five distinct time-domain features were evaluated from each waveform.Therefore,the total number of ten features was obtained from the two waveforms of each experiment.The features from both samples were combined and labeled for performing SVM classification.
The performance evaluation of the classifier was estimated by creating a confusion matrix using SVM outcomes,as shown in Fig.3b.There are four parameters used to create a confusion matrix,including true-positive(TP),true-negative(TN),false-positive(FP),and false-negative(FN).TheTPandTNvalues define the cor-rect or true predicted outcomes of both samples.Whereas theFPandFNare the incorrect or false predicted outcomes.The parameter values from the confusion matrix were used to assess the performance analysis of the trained model using accuracy,precision,recall,specificity,and F-score.The accuracy measures the correctly identified outcomes.Precision is the ratio of correctly identified outcomes to total predicted values of the respective sample.The recall is the ratio of correctly identified outcomes to all observations in the actual class.Specificity estimates the proportion of correctly identified false results to the total number of false predicted values.F-score is the weighted average of precision and recall[21].The parameters to evaluate the performance analysis are presented as Eqs.1–(5):
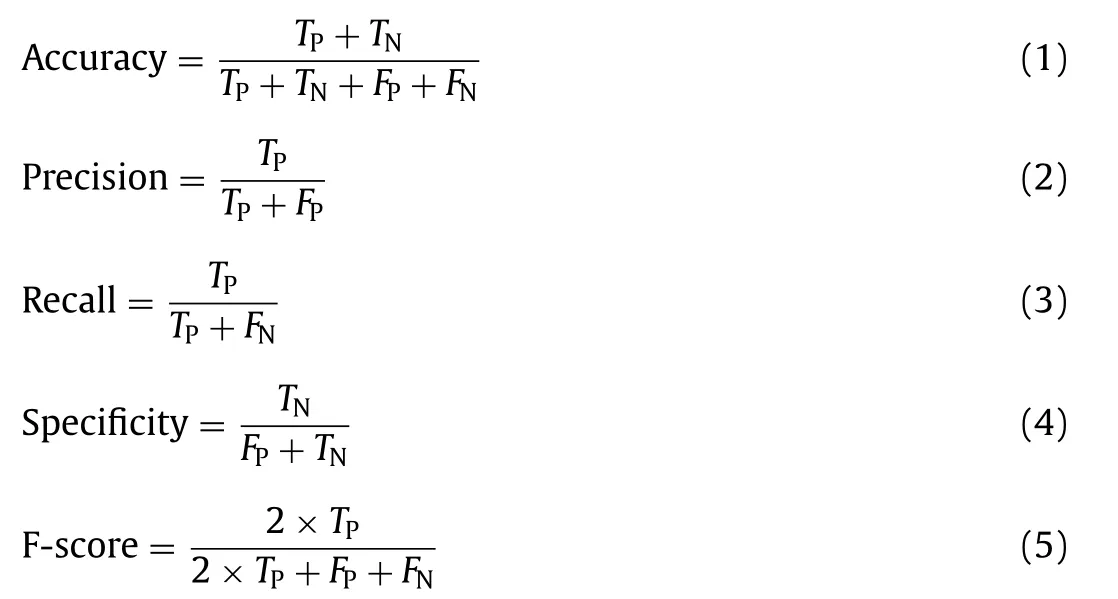
The overall classification accuracy of the model is based on the number of correctly predicted outcomes divided by the total number of outcomes(Eq.6).

The confusion matrix consists of two rows and two columns.The values in the confusion matrix represent the number of features set that the SVM trained model predicted.The values in rows represent the actual class,while column values represent the expected outcomes of the test sample.The value in first row and first column of the confusion matrix shows that 3003 values were correctly identified for data acquired using 2 μm sample.Similarly,1383 values were correctly determined for data obtained by 5 μm sample.On the other hand,the first row and second column parameter shows that 180 values of 2 μm sample were incorrectly identified as 5 μm sample.Whereas there was no misclassification occurred for the 5 μm sample.The overall values acquired by the confusion matrix are termed asTP= 3003,TN= 1383,FP= 180,FN= 0.The confusion matrix values were applied on Eqs.1–6 to estimate the performance analysis of the trained model,presented in Table 1.The trained model shows a higher classification accuracy of 96.06% to classify samples containing 2 μm and 5 μm sized particles.The performance analysis for each sample was obtained by specifying the parameters.The classification accuracy for each sample containing 2 μm and 5 μm sized particles were 94.3% and 100%,respectively.The higher classification accuracy of the sample with 5 μm sized particles compared with a sample of 2 μm particles is because bigger size particles create a higher scattering of light.Differences in the scattering of light make distinct waveform features.The acquired results show promising results that validate the proposed technique for the identification of the particles.
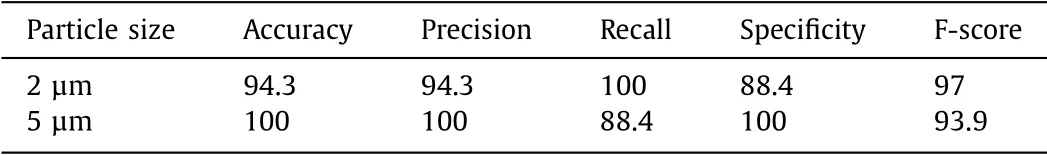
Table 1 Assay metrics for the identification of particles.
This paper provides an investigation for the on-chip detection of the spherical microparticles.The experiments were successfully performed for the classification of 2 μm,and 5 μm sized particles.The basic principle of methodology is to analyze the scattering of light from particles of different sizes.The given method is based on the classification of the forward scattering light using machine learning.The device is composed of a microfluidic chip for passing samples,using the minimal test sample.Furthermore,the photosensors and laser device were used for detecting the scattered light.The photosensors and laser device were linked with optical fibers that were embedded in the microfluidic device.The given assembly makes the device portable and can be easily reassembled.The optimum concentration was evaluated to acquire a higher classification accuracy.The sample was injected into the chip,and data were obtained for acquiring time-domain features.The features were trained using an SVM classifier,and the testing data were used to evaluate the classification accuracy and other performance analysis.The higher classification accuracy validates the device for detecting particles of different sizes.The proposed particle detection technique will be implemented on various other applications for analyzing and characterizing biological samples in the future.
Declaration of competing interest
The authors declare that they have no known competing financial interests or personal relationships that could have appeared to influence the work reported in this paper.
Acknowledgments
This work was supported by the Natural Science Youth Foundation of China(No.61801307),and the Scientific Research Fund of the Shenzhen International Cooperation Projects(No.GJHZ20190819151403615).
Supplementary materials
Supplementary material associated with this article can be found,in the online version,at doi:10.1016/j.cclet.2021.09.044.
 Chinese Chemical Letters2022年4期
- Chinese Chemical Letters的其它文章
- Key progresses of MOE key laboratory of macromolecular synthesis and functionalization in 2020
- Small nanoparticles bring big prospect:The synthesis,modification,photoluminescence and sensing applications of carbon dots
- Cell membrane-coated nanoparticles for immunotherapy
- Diketopyrrolopyrrole-derived organic small molecular dyes for tumor phototheranostics
- Exosome based miRNA delivery strategy for disease treatment
- Recent advances in targeted stimuli-responsive nano-based drug delivery systems combating atherosclerosis