Analyzing neural degeneration of the retina with connectomics
Charles L. Zucker, John E. Dowling
Electron microscopy (EM) provides a unique ability to visualize structural detail with a resolution orders of magnitude better than other imaging techniques. Applied conventionally, its limitation is that each acquired image represents a small area with a section thickness significantly less than 100 nm. Recently, techniques have been developed that allow thousands of relatively large serial-sections to be collected and efficiently imaged at full EM resolution,with the images then being stitched back together to produce a 3D volume. Within such a volume, every subcellular structure or cellular connection can be identified and mapped, i.e. connectomics. These methods offer the opportunity of revealing a comprehensive view of large volumes of neural tissue. With the increasing use of automated technologies, it is now possible to use large-scale serial-section electron microscopy to generate reconstructions of various brain regions with a resolution of 4 nm or better (Kasthuri et al., 2015; Baena et al., 2019). At this resolution, excitatory and inhibitory chemical synapses can be seen;the existence of electrical synapses (gap junctions), the presence of neuromodulatory peptides and biogenic amines, and the identification of local microcircuits can all be observed (Swanson and Lichtman, 2016).Furthermore, relationships with various types of glial cells are readily seen, and cells associated with vascular elements and nonneuronal/glial cell types can be distinguished.Further, the fine structure of organelles,including mitochondria, endoplasmic reticulum, lysosomes, and autophagosomes,along with cytoskeletal elements are within the resolution of these techniques. Thus,a continuum of scale, from sub-organelle structure, through the cellular level, up to a wide field tissue perspective can be viewed and analyzed simultaneously. Such techniques have been used to map nerve regeneration in 3D (Leckenby et al., 2019),to investigate developmental rewiring in the cerebellum (Wilson et al., 2019); to explore the network connectivity in visual thalamus(Morgan and Lichtman, 2020), and to define the neuronal connectivity and relationships with glial cells in the human fovea (Dacey et al., 2017; Packer et al., 2017).
In a recent study, we demonstrated the utility of a targeted high-throughput connectomics approach in a retinal disease (Zucker et al., 2020). For learning about pathological mechanisms, where many samples need to be analyzed, it is not practical to image and reconstruct the entire volume - the more‘traditional’ connectomics approach. Rather,with a block of tissue covering a retinal area up to about 3.5 mm x 6 mm, with a thickness on the order of one third of a millimeter,we can slice the volume into approximately 10,000–15,000, 30 nm thick sections which are then collected onto plastic tape with an automated tape-collecting ultramicrotome(Baena et al., 2019). Lower resolution overview images of every 100thsection are then acquired. This intermediate step is used for guiding the imaging of regions of interest for further high-resolution imaging using either a single-beam or a 61-beam scanning electron microscope. These techniques effectively allow us to navigate through the full tissue volume in the X, Y, and Z dimensions to examine at high-resolution,local details of connectivity or pathology.
Macular Telangiectasia type 2 (MacTel), is a rare form of slowly progressive macular degeneration associated with a loss in the retina of Müller glial cells and the amino acid serine, which is synthesized by the Müller cells (Gantner et al., 2019). The clinically significant manifestation of the disease is confined mainly to a central retinal region called the MacTel zone, which is approximately 3 mm (horizontal) by 2.5 mm(vertical), and includes the macula and fovea.Discrete lesions in the MacTel zone cause dramatic losses of visual sensitivity and scotomas (blind spots) in the affected areas.We have used our connectomics techniques optimized for disease analysis to study the retinas from two woman (mother and daughter) suffering from MacTel. With this approach, we have been able to investigate the disease process from the subcellular/organelle level, up to the cellular and tissue levels.
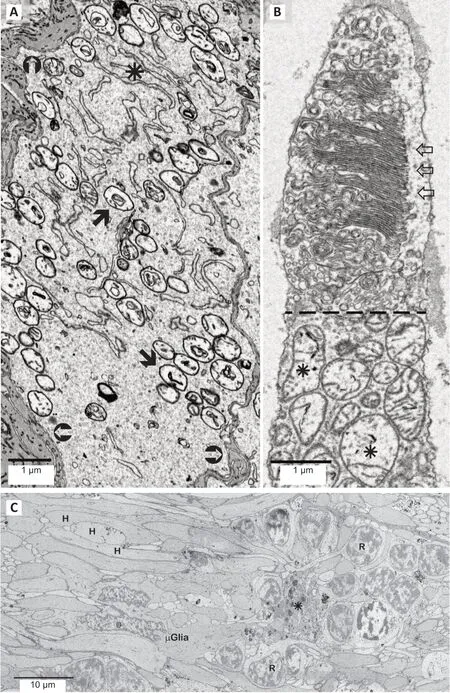
At the subcellular level, we demonstrated that mitochondrial structure is altered in all retinal cell types within, and well beyond the region where functional pathology manifests; more severe mitochondrial damage is found within the region where vision is also severely affected. The first changes in mitochondrial structure appear as accumulations of dense material among the cristae. Loss of cristae typically follow, leaving the mitochondria swollen and empty. Well beyond the MacTel zone, the mitochondria in the output neurons of the retina, the ganglion cells, show profound structural changes (Figure 1A).
Photoreceptors are amongst the most metabolically active cells known. The maintenance and function of their light absorbing and transducing outer segments is thus highly dependent upon the functional integrity of their mitochondria rich ellipsoids found just below the outer segments. This integrity is compromised in the photoreceptor ellipsoids. In the macula region of MacTel retinas we also find that the normally highly-ordered stacks of membranous outer segment discs appear to be in a disordered disassembled state(Figure 1B). Note the swollen and empty mitochondria in the ellipsoid below the dashed line.
At the cellular and tissue levels, we have identified a circumscribed transition zone between a region affected profoundly by neurodegenerative changes juxtaposed by a surrounding region with more subtle subcellular (mitochondrial) changes, but with maintained near normal functional circuitry. The MacTel transition zone appears to represent a region where the disease process is progressing, and where there is an active cellular response to neuronal and glial degeneration (Figure 1C). In the macula region of the human retina, the axons (Henle fibers) and synaptic terminals of photoreceptors are normally ensheathed by processes from Müller glial cells, isolating each one from its surrounding neighbors.Within the MacTel zone, this ensheathment is lost; but is maintained outside the MacTel zone only a few tens of microns away(Zucker et al., 2020). Along the border of this transition zone, numerous microglial cells infiltrate islands of cellular debris and ectopic photoreceptor cell bodies (normally only found within the outer nuclear layer that overlies the Henle fiber layer).
The methods and approach we outline here have allowed us to provide insight into the subcellular locus and progression of a neurodegenerative disease of the retina. Other recent studies are showing that an underlying cause of MacTel involves the synthesis and metabolic pathways involving the amino acid serine. Since Müller cells synthesize retinal serine, we propose that a deficiency of serine, required for mitochondrial maintenance, causes mitochondrial changes that underlie MacTel development. This knowledge is now leading to the development of therapeutic strategies that need evaluation at the tissue,cellular, and subcellular level. Using both donor tissue and cell based strategies (e.g.human retina organoids grown from donorderived induced pluripotent stem cells),high-throughput targeted connectomics can reveal the extent to which interventions may restore or prevent pathological development. Ultrastructural analysis through connectomics provides a powerful tool to investigate the normal functional architecture of the brain, the changes that occur following disease or injury, and how restorative efforts in model and patient systems may roll back damaged circuitry in a functionally meaningful way.

Figure 1|Structural and mitochondrial changes in MacTel retinal neurons.
The research described in this paper was carried out in the laboratory of Jeffrey Lichtman at Harvard University, and we are grateful for the support and help from Professor Lichtman, Richard Schalek and other lab members.
This work was supported in part by the Lowy Medical Research Institute (LMRI) to JED, a Macular Foundation grant to CLZ, NIH grant EY030255 to JED & CLZ.
Charles L. Zucker*, John E. Dowling*
Department of Molecular and Cellular Biology,Harvard University, Cambridge, MA, USA
*Correspondence to:Charles L. Zucker, PhD,czucker@fas.harvard.edu; John E. Dowling, PhD,dowling@mcb.harvard.edu.
https://orcid.org/0000-0002-2373-7481(Charles L. Zucker)
https://orcid.org/0000-0002-8441-6761(John E. Dowling)
Date of submission:December 18, 2020
Date of decision:February 8, 2021
Date of acceptance:March 18, 2021
Date of web publication:June 7, 2021
https://doi.org/10.4103/1673-5374.314307
How to cite this article:Zucker CL, Dowling JE(2022) Analyzing neural degeneration of the retinawith connectomics. Neural Regen Res 17(1):113-114.
Copyright license agreement:The Copyright License Agreement has been signed by both authors before publication.
Plagiarism check:Checked twice by iThenticate.
Peer review:Externally peer reviewed.
Open access statement:This is an open access journal, and articles are distributed under the terms of the Creative Commons Attribution-NonCommercial-ShareAlike 4.0 License, which allows others to remix, tweak, and build upon the work non-commercially, as long as appropriate credit is given and the new creations are licensed under the identical terms.
- 中国神经再生研究(英文版)的其它文章
- Genes for RNA-binding proteins involved in neuralspecific functions and diseases are downregulated in Rubinstein-Taybi iNeurons
- Research advances on how metformin improves memory impairment in “chemobrain”
- Dendritic spine density changes and homeostatic synaptic scaling: a meta-analysis of animal studies
- Optogenetic activation of intracellular signaling based on light-inducible protein-protein homo-interactions
- Presenilin mutations and their impact on neuronal differentiation in Alzheimer’s disease
- Growth differentiation factor 5: a neurotrophic factor with neuroprotective potential in Parkinson’s disease

