
Erythrocyte sphingolipid species as biomarkers of Alzheimer's disease
2022-04-07 12:46:56JerihMillVihrPtelOziomOkonkwoLingjunLiThomsRife
Jerih Mill,Vihr Ptel,Oziom Okonkwo,Lingjun Li,d,*,Thoms Rife,**
aDepartment of Chemistry,University of Wisconsin-Madison,Madison,WI,53706,USA
bDepartment of Pathology and Laboratory Medicine,University of Wisconsin School of Medicine and Public Health,Madison,WI,53705,USA
cClinical Science Center,Wisconsin Alzheimer's Disease Research Center,University of Wisconsin School of Medicine and Public Health,Madison,WI,53792,USA
dSchool of Pharmacy,University of Wisconsin-Madison,Madison,WI,53705,USA
Keywords:
Alzheimer's disease
Neurodegenerative disease
Mass spectrometry
Erythrocytes
Biomarkers
Metabolomics
A B S T R A C T
Diagnosing Alzheimer's disease(AD)in the early stage is challenging.Informative biomarkers can be of great value for population-based screening.Metabolomics studies have been used to find potential biomarkers,but commonly used tissue sources can be difficult to obtain.The objective of this study was to determine the potential utility of erythrocyte metabolite profiles in screening for AD.Unlike some commonly-used sources such as cerebrospinal fluid and brain tissue,erythrocytes are plentiful and easily accessed.Moreover,erythrocytes are metabolically active,a feature that distinguishes this sample source from other bodily fluids like plasma and urine.In this preliminary pilot study,the erythrocyte metabolomes of 10 histopathologically confirmed AD patients and 10 patients without AD(control(CTRL))were compared.Whole blood was collected post-mortem and erythrocytes were analyzed using ultraperformance liquid chromatography tandem mass spectrometry.Over 750 metabolites were identified in AD and CTRL erythrocytes.Seven were increased in AD while 24 were decreased(P<0.05).The majority of the metabolites increased in AD were associated with amino acid metabolism and all of the decreased metabolites were associated with lipid metabolism.Prominent among the potential biomarkers were 10 sphingolipid or sphingolipid-related species that were consistently decreased in AD patients.Sphingolipids have been previously implicated in AD and other neurological conditions.Furthermore,previous studies have shown that erythrocyte sphingolipid concentrations vary widely in normal,healthy adults.Together,these observations suggest that certain erythrocyte lipid phenotypes could be markers of risk for development of AD.
1.Introduction
Alzheimer's disease(AD)is the sixth leading cause of death in the United States and is the most common cause of dementia in the aging population[1].Over 6 million Americans are living with AD,and that number threatens to more than double by the year 2060.The economic burden of AD is considerable;in 2021,it is estimated that AD will cost the United States$355 billion in long-term health care and hospice expenses.By 2050,this number is expected to have drastically increased to over$1.1 trillion.Despite extensive research,there are currently no pharmacological treatments that slow or stop the development of AD.
As the burden of AD grows larger and new therapeutic approaches emerge,there is an increasing need to diagnose AD early in its evolution.Currently,the diagnosis of AD relies on observations of significant decline in behavioral and cognitive functions.However,when clinical symptoms are apparent,cellular decline may have been present for decades[2].In order to diagnose AD prior to cognitive symptom onset,feasible tests,such as biomarkers,must be developed.
Previous AD metabolomics studies have analyzed brain tissue,cerebrospinal fluid(CSF),plasma,and serum.Although brain tissue is likely to be highly informative for analysis of neurological disease,it is an unlikely source of screening material for widespread use.In comparison,CSF is more accessible,but collecting CSF is an invasive procedure that is not feasible for large-scale screening[3].
Blood is an ideal sample source for screening tests.Blood collection is a simple,quick procedure that can be carried out in any medical facility.Serum and plasma have both been analyzed by metabolomic profiling in AD with moderate success.Studies using plasma and serum have identified several metabolites in AD that are associated with inflammation,oxidative stress,mitochondrial dysfunction,and neuronal injury[4,5].Erythrocytes have been largely overlooked as a biomarker source.Erythrocytes have the distinction of being active metabolic cells with intact biochemical pathways maintained throughout their lifespan.The biochemical composition of erythrocytes therefore represents a cellular phenotype that may be informative about health and disease.
We report the first comprehensive study of the erythrocyte metabolome,comparing post-mortem histologically confirmed AD subjects to non-AD subjects.
2.Experimental
2.1.Demographics
An autopsy specimen database maintained under the auspices of the Wisconsin Alzheimer's Disease Research Center(Madison,WI,USA)was studied for the presence of blood samples associated with histopathologically-documented cases of AD.The diagnosis of AD was made using the National Institute on Aging and Alzheimer's Association(NIA-AA)criteria[6].Patients with an NIA-AA score of A3B3C3(high AD pathologic change)were included in the AD sample group.The database was searched for control(CTRL)cases based on histopathological determination of an absence of AD pathologic changes.Cases with a diagnosis of“low”or “intermediate”AD change by NIA-AA criteria were excluded.Ten CTRL cases were selected with the intent of matching gender distribution,age,and post-mortem interval between the CTRL and AD groups(Table 1).The primary post-mortem histopathologic diagnoses of patients in the two groups are shown in Table 2.

Table 1Demographics data of Alzherimer's disease(AD)(n=10)vs.control(CTRL)(n=10).
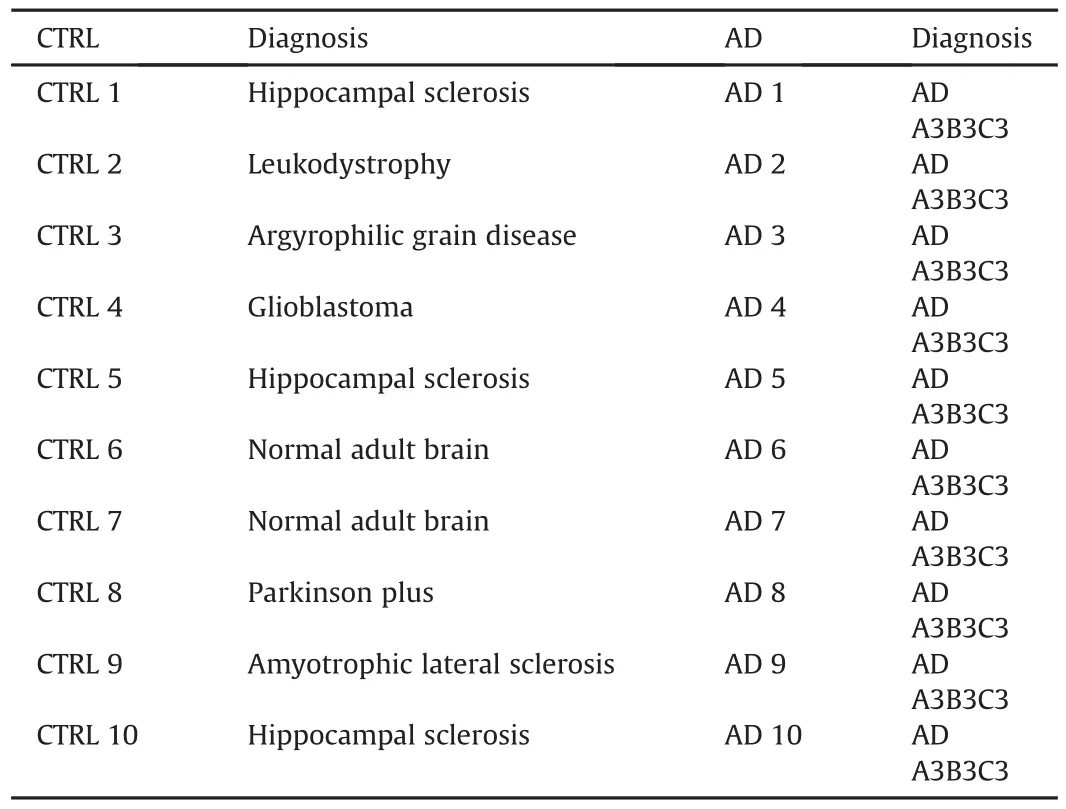
Table 2Primary neuropathologic diagnosis in AD(n=10)vs.CTRL(n=10).
2.2.Blood samples
Whole blood(20 mL)was collected in red-top non-anticoagulated tubes during post-mortem examination by cardiac puncture.Samples were aliquoted and stored at-80℃until shipped on dry ice to Metabolon(Durham,NC,USA)for untargeted metabolomic analysis.
2.3.Materials and reagents
Methanol(MeOH),acetonitrile(ACN),and ammonium bicarbonate were purchased from Fisher Chemical(Hampton,NH,USA).Water(H2O)was sourced from a deionizing reverse osmosis water system from Hydro Inc.(Atlanta,GA,USA).Formic acid(FA)and perfluoropentanoic acid(PFPA)were purchased from Sigma Aldrich(St.Louis,MO,USA),as were all internal standards.Ammonium formate was from Acros Organics(Fair Lawn,NJ,USA).
2.4.Sample preparation
Protocols created by Metabolon were followed for this study.Samples were thawed upon arrival and erythrocytes were aspirated from the red-top tubes by inserting a pipette into the mass of erythrocytes.Samples were then processed using the automated MicroLab®STAR™ system from Hamilton Company(Reno,NV,USA).Several recovery standards were added prior to the first step in the extraction process for quality control(QC)purposes(Table 3).To remove protein and small molecules,and to recover chemically diverse metabolites,proteins were precipitated with methanol under vigorous shaking for 2 min(Glen Mills GenoGrinder 2000,SPEX SamplePrep,Metuchen,NJ,USA)and then were centrifuged.The resulting extract was divided into five fractions.Two fractions were analyzed by two separate reversed phase ultra-performance liquid chromatography tandem mass spectrometry(RP/UPLC-MS/MS)methods with positive ion mode electrospray ionization(ESI),one was analyzed by RP/UPLC-MS/MS with negative ion mode ESI,one was analyzed by hydrophilic interaction chromatography(HILIC)UPLC-MS/MS with negative ion mode ESI,and one was reserved for backup.Organic solvent was removed by briefly placing samples on a TurboVap(Zymark,Biotage,Uppsala,Sweden),and samples were stored under nitrogen overnight prior to analysis.

Table 3Internal standards utilized in LC methods.
2.5.Quality assurance/QC
Multiple types of controls were analyzed in tandem with experimental samples.A pooled matrix sample was generated by taking a small volume of each experimental sample and was used as a technical replicate,and ultra-pure water samples were used as process blanks.Additionally,a cocktail of QC standards chosen to not interfere with measurement of endogenous compounds was spiked into every analyzed sample to monitor instrument performance and aid with chromatographic alignment(Table 3).Instrument variability(3%)was calculated using the median relative standard deviation(RSD)for the QC standards added prior to injection,and overall process variability(9%)was determined by calculating the median RSD for all endogenous metabolites present in 100% of pooled samples.Experimental samples were randomized across the platform run with QC samples spaced evenly among experimental samples;a small aliquot of each sample was pooled to create a technical replicate,which was injected randomly throughout the run.
2.6.LC/MS parameters
All analysis utilized a Waters ACQUITY UPLC(Milford,MA,USA)and a Thermo Scientific Q-Exactive high resolution/accurate mass spectrometer(ThermoFisher Scientific,Waltham,MA,USA),interfaced with a heated electrospray ionization(II)source and Orbitrap mass analyzer at 35,000 mass resolution.Additional MS parameters are outlined in Table 4.Four LC methods were used in order to identify as many metabolites as possible;representative chromatograms are included in Fig.1.
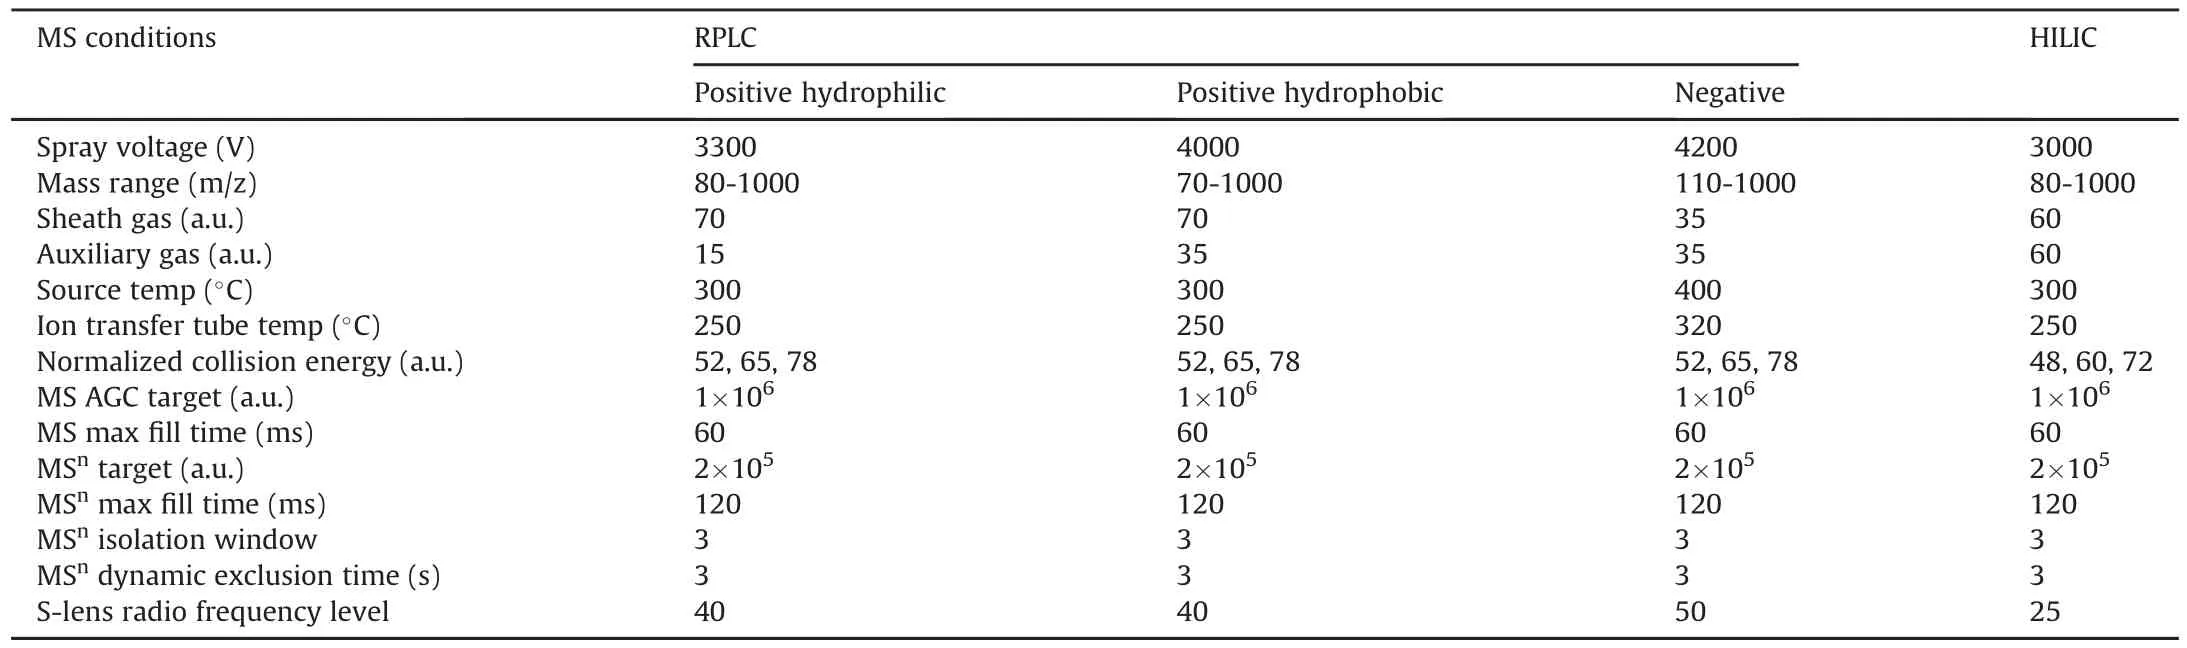
Table 4Mass spectrometry conditions.
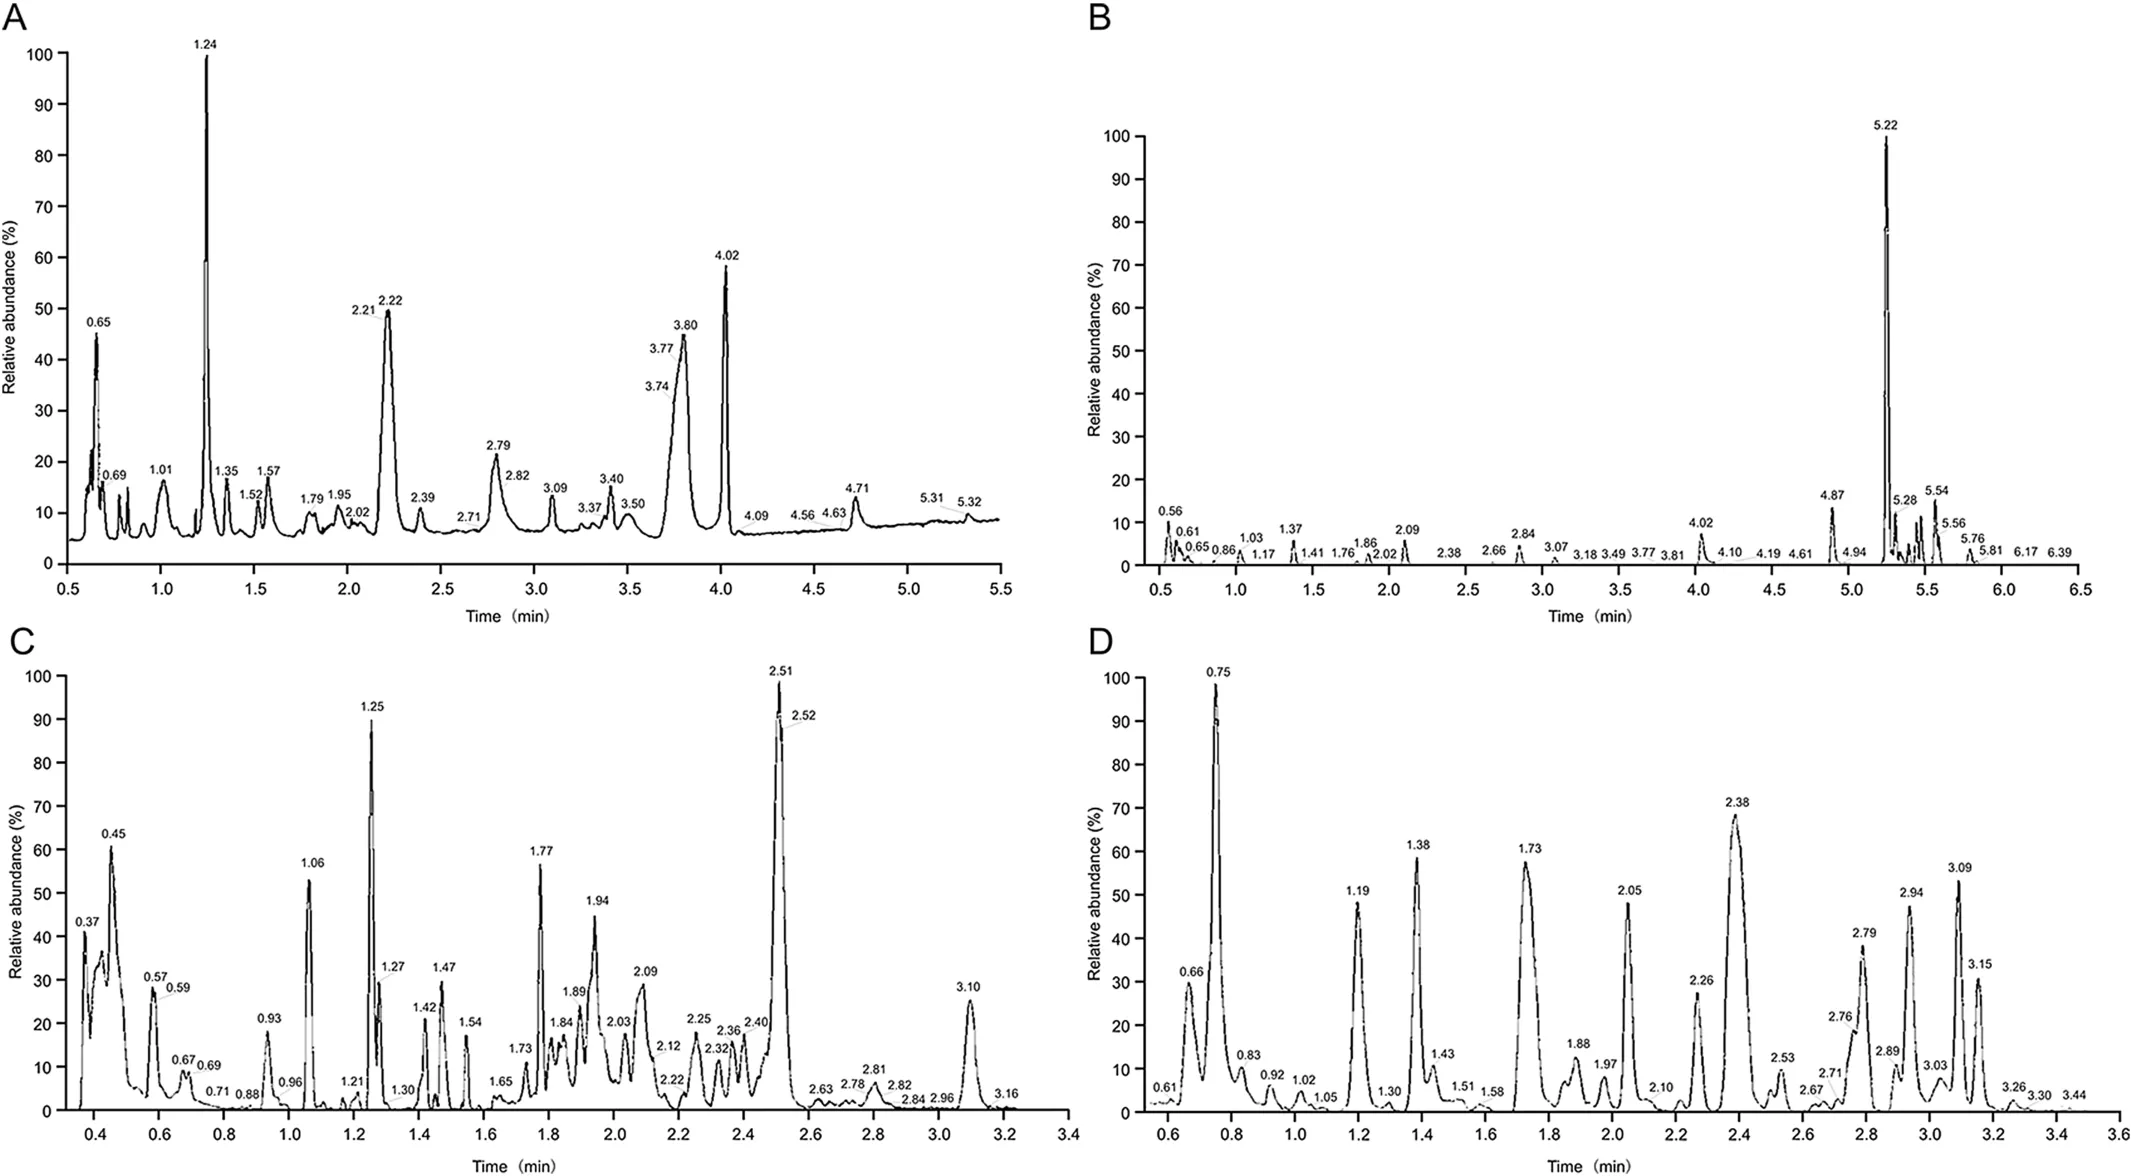
Fig.1.Representative total ion chromatograms(TIC)from each liquid chromatography-mass spectrometry(LC-MS)method,with(A)showing HILIC,(B)showing RPLC ESI-,(C)showing RPLC ESI+optimized for hydrophobic components,and(D)showing RPLC ESI+optimized for hydrophilic components.HILIC:hydrophilic interaction chromatography;RPLC:reversed-phase liquid chromatography;ESI:electrospray ionization.
In the first method,sample aliquots were analyzed using acidic positive ion conditions,and were chromatographically optimized for hydrophilic compounds.The extract was eluted from a Waters UPLC BEH C18column(2.1 mm×100 mm,1.7μm;Waters,Milford,MA,USA)using a linear gradient of water and MeOH,containing 0.05% PFPA and 0.1% FA.The gradient proceeded from 5% MeOH to 80% MeOH over the course of 3.35 min,at a flow rate of 0.35 mL/min.
In the second method,sample aliquots were analyzed with the same MS conditions but were optimized for hydrophobic compounds.The extract was eluted from the same column mentioned previously using H2O and ACN/MeOH(50:50,V/V),with 0.05% PFPA and 0.1% FA.This linear gradient was operated at a flow rate of 0.60 mL/min and an overall higher organic gradient,going from 40% ACN/MeOH to 99.5% ACN/MeOH over the course of 1.0 min and then being held at 99.5% ACN/MeOH for 2.5 min.
A third aliquot was analyzed using basic negative ion mode using a separate C18column.These extracts were eluted at 0.30 mL/min using a gradient of MeOH/H2O(95:5,V/V)and H2O with 6.5 mM ammonium bicarbonate at pH 8.The separation began with a linear gradient from 0.5% H2O to 70% H2O over 4.0 min,then rapidly increased to 99% H2O in 0.5 min.
The fourth aliquot was also analyzed via negative ion mode,following an elution from an HILIC column(2.1 mm×150 mm,1.7μm;Waters UPLC BEH Amide,Milford,MA,USA)using a gradient of H2O/MeOH/ACN(15:5:80,V/V/V)and H2O/ACN(50:50,V/V)with 10 mM ammonium formate at pH 10.8.The gradient proceeded linearly from 5% H2O/ACN to 50% H2O/ACN in 3.5 min,then from 50% H2O/ACN to 95% H2O/ACN over the span of 2 min.The scan range varied between methods but covered a range of m/z 70 to 1000.
2.7.Data analysis
Raw data were extrcted,peak-identified,and QC processed using a LAN backbone and a database server running Oracle 10.2.0.1 Enterprise Edition.These systems are built on a web-service platform utilizing Microsoft's.NET technologies.Compounds were identified by comparison to a library of purified standards or recurring unknown entities;this library is maintained by Metabolon and contains the retention time/index(RI),m/z,and chromatographic data(including MS/MS spectral data).Biochemical identifications are based on three criteria:retention index within a narrow RI window,accurate mass match to the library±10 ppm,and the MS/MS forward and reverse scores between the experimental data and authentic standards.These MS/MS scores are based on a comparison of ions present in the experimental spectrum to ions present in the library spectrum.More than 3300 commercially available purified standard compounds have been acquired and registered into Metabolon's Laboratory Information Management System for analysis on all platforms.Additional mass spectral entries have been made for structurally unnamed biochemicals,identified due to their recurrent nature.
Peaks were quantified using area-under-the-curve,with a data normalization step for runs spanning multiple days.Each compound was corrected in run-day blocks by registering the medians to equal one(1.00)and normalizing each data point proportionately.In some instances,data were normalized to cell counts,osmolality,or other factors in order to account for the differences in metabolite levels due to differences in amount of sample material present.
2.8.MetaboAnalyst parameters
The MetaboAnalyst Statistical Analysis function was used for further analysis of m/z values and peak areas from the results from Metabolon[7,8].Default practice was used for data integrity check,and data were filtered by interquartile range.As normalization occurred prior to MetaboAnalyst analysis,no sample normalization was performed,but data were log2-transformed for comparison.The volcano plot function was used,with a fold change threshold at 1.5 and P value of 0.05.
The Pathway Analysis function was also used for pathway visualization,with the following parameters: “scatter plot”visualization method, “hypergeometric test” enrichment method,“relative-betweeness”centrality topology analysis,and reference metabolome of all compounds in selected pathway library of“Homo sapiens(KEGG).”
3.Results and discussion
Over 750 metabolites were identified from the 20 erythrocyte samples(Fig.2).Within the MetaboAnalyst parameters,31 metabolites were observed to be significantly different,with seven increased(Table 5)and 24 decreased in AD patients(Table 6).
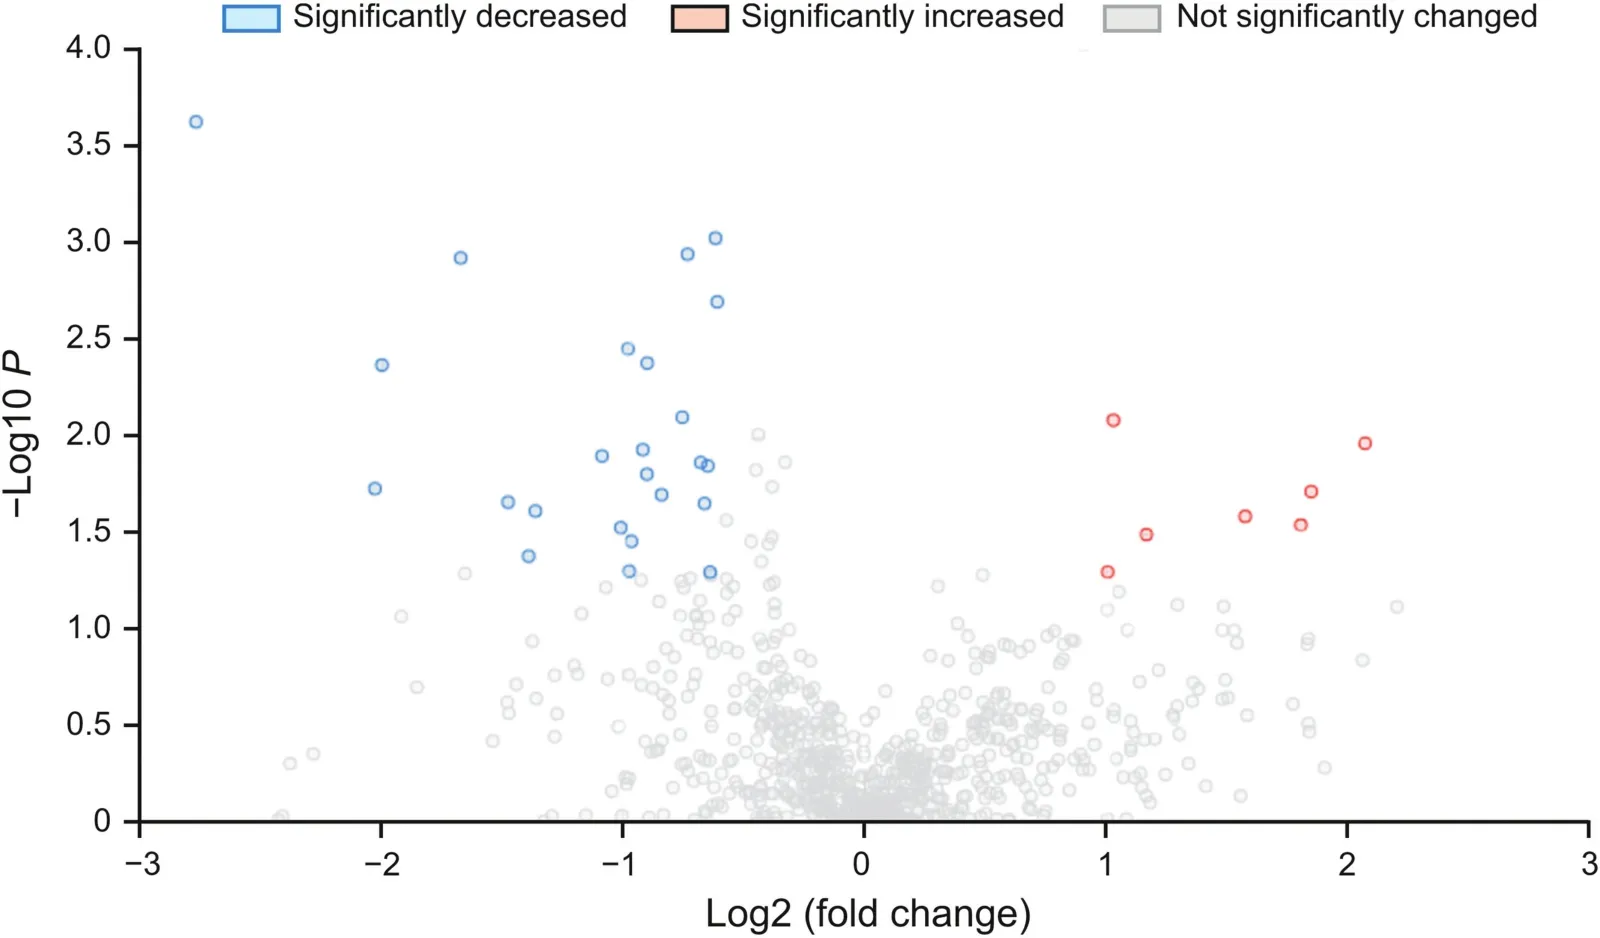
Fig.2.Volcano plot showing all detected metabolites;significantly increased or decreased(P< 0.05,fold change>1.5 or fold change<-1.5)highlighted in red.For plotting purposes,the fold change values are log2-transformed,and the P values are log10-transformed.
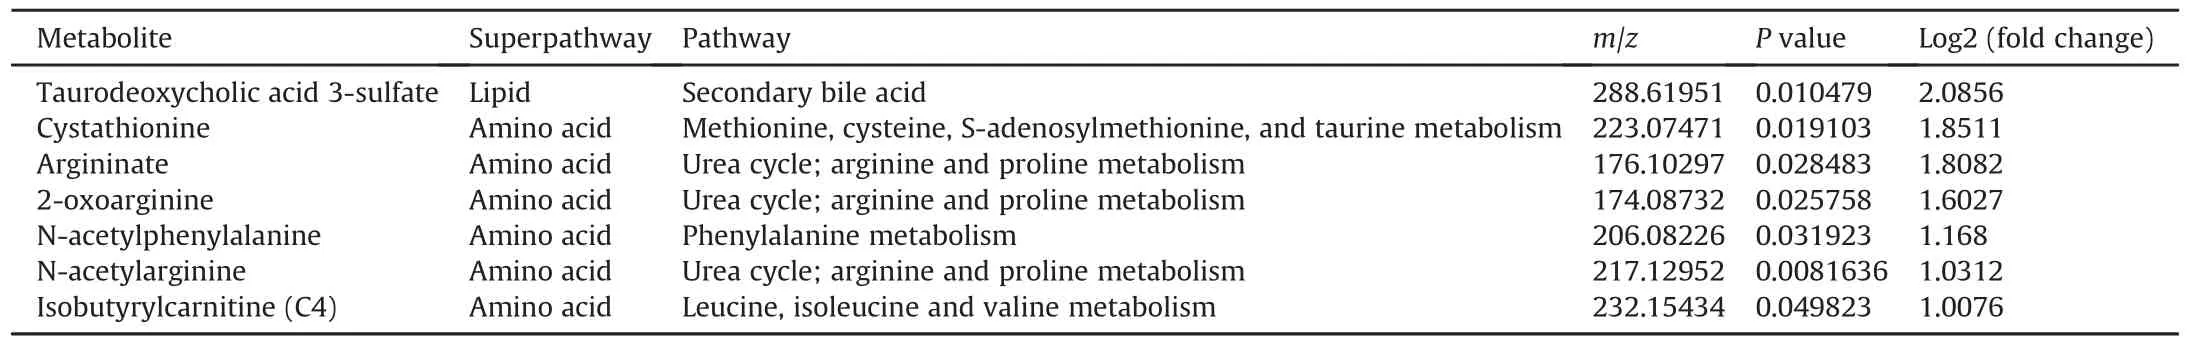
Table 5Metabolites significantly increased in erythrocytes.

Table 6Metabolites significantly decreased in erythrocytes.
3.1.Increased metabolites
Six of the seven metabolites increased in AD are in the amino acid class.Three of these six metabolites(Fig.3)are related to the urea cycle,which has previously been implicated in AD.These 3 metabolites(argininate,2-oxoarginine,and N-acetylarginine)belong specifically to a group of compounds called guanidino compounds.These compounds are increased in cases of hyperargininemia,a condition where arginase I activity is decreased and neurological symptoms,including epilepsy,progressive spastic diplegia,and cognitive deficits,are present[9].The cause of the neurological symptoms is not entirely characterized,but in cases of arginase deficiency,arginine is not efficiently converted to urea.Instead,arginine can be metabolized into neurotoxic guanidino compounds;argininate,2-oxoarginine,and N-acetylarginine are three ones that are particularly abundant[10].These guanidino compounds are known to increase oxidative stress and interrupt enzyme activity,which are the potential mechanisms for their neurotoxic effect[11-13].

Fig.3.Box plots comparing log2-transformed concentration of three guanidino species in both Alzheimer's disease(AD)(n=10)and control(CTRL)(n=10).
Arginase expression has also been implicated in studies of AD.Both arginase isoforms are expressed at low levels in the central nervous system;in the AD brain,arginase II expression is higher than in a CTRL brain[14].There is also evidence that a rare arginase II allele is associated with an increased risk of AD,as well as an earlier age at onset[14].Additionally,AD brains often present with oxidative damage,one of the potential mechanisms of neurotoxic uremic toxins[11,15].It is worth noting that chronic kidney disease,which causes accumulation of uremic toxins,is regarded as a risk factor for development of AD[16].
The presence of these neurotoxic compounds in AD erythrocytes is particularly interesting;arginase I is mainly expressed in the liver,but in humans and some primates,it is also expressed in erythrocytes[17].In individuals with hyperargininemia,there is no erythrocyte arginase I activity[18].The finding of these dysregulated metabolites in this study of AD erythrocytes suggests a generalized deficiency in arginase expression.This hypothesis is also supported by decreased ornithine often seen in AD metabolomic studies of various biofluids,as ornithine is a product of arginase catalysis[19-22].Based on what is known about the distribution and expression of arginase,as well as the neurotoxic effects of the three metabolites detected in this study,it is worth further investigating the arginase activity of AD patients.
3.2.Decreased metabolites
The most dominant feature of this metabolomic study of erythrocytes was a consistent decrease in the relative concentrations of multiple sphingolipid and sphingolipid-related species in AD cases compared to controls.Twenty-four total metabolites significantly decreased in erythrocytes of AD patients all belong to the lipid class,with ten belonging or being related specifically to the sphingolipid class(Figs.4 and 5).The role of lipids in AD pathogenesis has been recognized since 1993,when the apolipoprotein E gene was found to be a strong genetic risk factor for lateonset AD[23,24].Sphingolipids are a bioactive class of lipids that are present in all eukaryotic cells and are involved in cell growth and differentiation,proliferation,and apoptosis[25].
Eight of the decreased metabolites belong to the sphingomyelin or dihydrosphingomyelin class(Fig.4).Sphingomyelin,a complex membrane sphingolipid,modulates the behavior of growth factor receptors and extracellular matrix proteins.It is a component of the plasma membrane of cells and is found in the highest concentration in nerve tissue and red blood cells.Two metabolites that were decreased in AD,glycosyl-N-stearoyl-sphingosine(d18:1/18:0)and glycosyl ceramide(d18:2/24:1,d18:1/24:2),belong to the ceramide class of lipid mediators(Fig.5).Ceramides are a product of sphingomyelin metabolism and have been implicated in previous studies of stroke and Parkinson's disease[26].
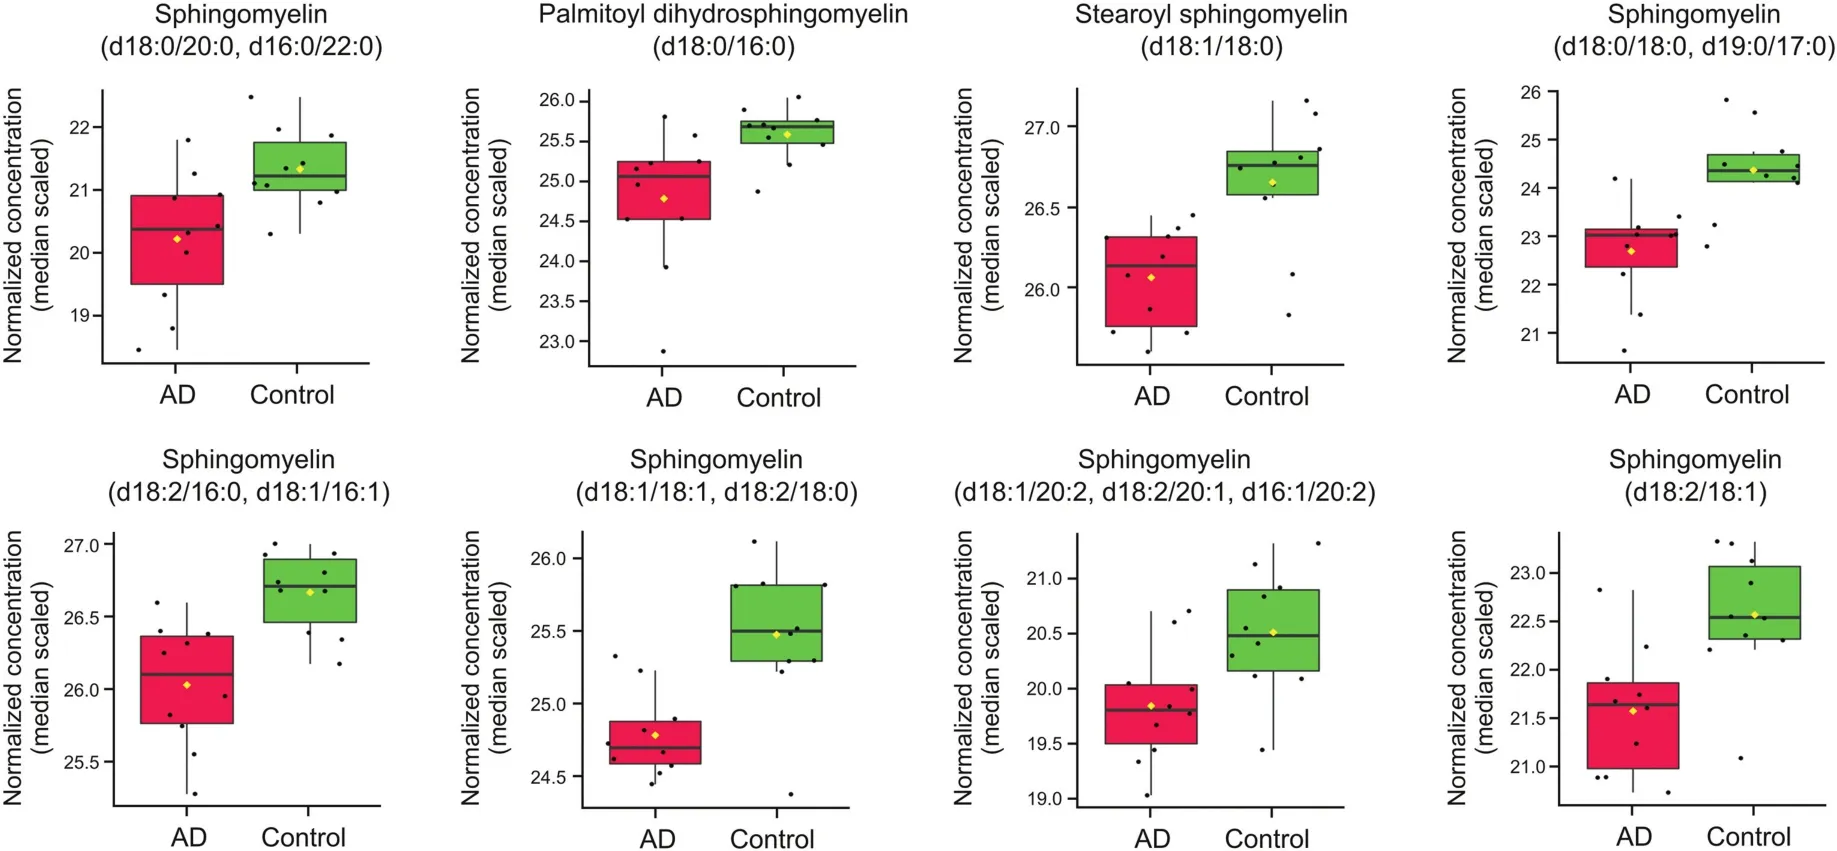
Fig.4.Box plots comparing log2-transformed concentration of eight sphingolipid species in both AD(n=10)and control(CTRL)(n=10).
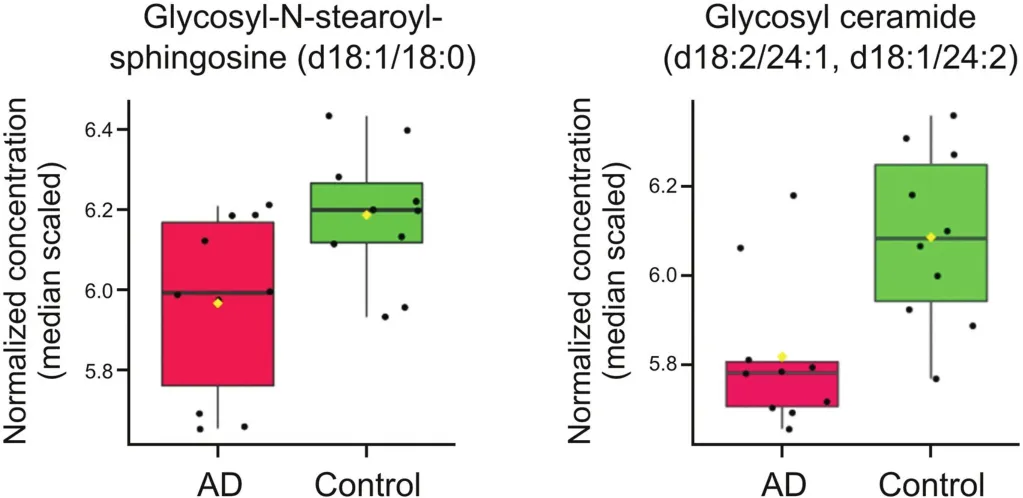
Fig.5.Box plots comparing log2-transformed concentration of two ceramide species in both AD(n=10)and control(CTRL)(n=10).
Severe brain disorders including Niemann Pick disease and Tay-Sachs disease are known to result from dysregulated sphingolipid metabolism[27,28].A number of studies have implicated altered sphingolipid and sphingomyelin metabolism in AD and other neurodegenerative disorders,and most of them have analyzed either brain tissue or CSF[29-31].Studies that analyzed postmortem AD brain tissue have been inconclusive in regard to sphingolipids,with no consensus on whether they were increased or decreased in AD[32].Studies using CSF have also been contradictory,with increased sphingolipid levels observed in prodromal AD but not in later stages[33].
3.3.Advantages and utility of erythrocytes
Erythrocytes are by far the most numerically abundant cells in the human body(84% by recent estimates[34]),and like all other cells,they are metabolically active.In contrast to body fluids such as CSF,plasma,or serum,which are complex admixtures of circulating biochemicals derived from many sources,erythrocytes are intact cells with regulated metabolic pathways.This is readily apparent from the high degree of heritability of critical metabolic pathways such as energy metabolism[35-40].Unlike most cells,erythrocytes are single compartment cells with no organelles.The cell membrane is the only lipid bilayer.The cell membrane of erythrocytes is highly regulated in shape and composition,and the content of sphingolipids is therefore under regulatory control.
Our observation of a characteristic decrease in sphingolipid species in AD erythrocytes suggests that there may be a systemic alteration in sphingolipid metabolism in AD.The observed association between erythrocyte sphingolipids and neurodegenerative disease is not unique.A previous study in children with dementia found that erythrocyte sphingolipids were consistently decreased[41].However,the sphingolipid concentration in the plasma was inconsistent,suggesting that erythrocytes may be a more informative source of metabolic biomarkers than plasma or serum.
Our previous work in erythrocytes demonstrated a high degree of heritability of metabolites in energy metabolism and other pathways,including sphingolipids[40].In our studies of 18 twin pairs,stearoyl sphingomyelin,which was identified in this study,was found to have an approximately 3-fold biological range with a 22% heritability estimate.Although not detected in this study,N-palmitoyl-D-erythro-sphingosine,one of the most abundant ceramides found in human blood[25],has a heritability estimate of 58%.Our twin studies also showed that erythrocyte sphingolipid concentrations vary from 3-to 5-fold in normal,healthy individuals.In the current study,the biological range of erythrocyte sphingolipids in all 20 subjects is intriguingly similar 3-to 5-fold,suggesting that the lower range of concentrations in AD subjects could be a lifelong phenotype as much as a consequence of disease.Inasmuch as erythrocyte sphingolipid composition is heritable,it is possible that lower sphingolipid metabolic phenotypes could predispose individuals to development of neurodegenerative disease.Environmental influences also appear to be important in erythrocyte sphingolipid concentrations.For example,studies have shown that increased aerobic activity increases sphingolipid concentrations in the blood[42].Therefore,the erythrocyte sphingolipid profile could be a life-long marker of AD risk that can be modified by lifestyle or pharmacology.
From the current study it is tempting to speculate that naturally lower concentrations of erythrocyte sphingolipids in young,healthy individuals may foreshadow the development of AD later in life.Future experimentation with therapeutic approaches to alter sphingolipid metabolism to prevent or treat AD could benefit greatly from the use of erythrocytes as a source of sphingolipid biomarkers[43].The data in this study support further investigations into the biology and predictive value of erythrocyte sphingolipids in AD.
4.Conclusions
This study suggests that erythrocytes may be a very useful source of biomarkers,and could reveal details about overall metabolic dysregulation in AD,particularly with respect to sphingolipids.While this is a promising finding,this study is limited in that it is a pilot study and used a small sample size;future studies with a larger sample size are warranted.Another limitation is the use of post-mortem samples,rather than samples from living patients.Post-mortem sample collection can have a substantial impact on metabolomic profiles,as unstable metabolites can decompose and may not necessarily reflect physiological or pathophysiological conditions.While post-mortem intervals were closely matched between the two cohorts,a future study involving sample collection from living individuals with AD and age-matched control subjects could provide more information about metabolic markers that differentiate the two cohorts.
CRediT author statement
Jericha Mill:Formal analysis,Writing-Original draft preparation,Writing-Reviewing and Editing,Visualization;Vihar Patel:Formal analysis,Writing-Reviewing and Editing,Visualization;Ozioma Okonkwo:Resources,Writing-Reviewing and Editing,Supervision,Funding acquisition;Lingjun Li:Writing-Reviewing and Editing,Supervision,Funding acquisition;Thomas Raife:Conceptualization,Writing-Reviewing and Editing,Supervision,Funding acquisition.
Declaration of competing interest
The authors declare that there are no conflicts of interest.
Acknowledgments
This research was supported in part by the National Institutes of Health(NIH)(Grant No.:RF1AG052324).Jericha Mill acknowledges a predoctoral traineeship supported by the NIH T32 training grant on Biology of Aging and Age-related Diseases(Grant No.:T32AG000213).Lingjun Li acknowledges a Vilas Distinguished Achievement Professorship and Charles Melbourne Johnson Distinguished Chair Professorship with funding provided by the Wisconsin Alumni Research Foundation and School of Pharmacy,University of Wisconsin-Madison.
 Journal of Pharmaceutical Analysis2022年1期
- Journal of Pharmaceutical Analysis的其它文章
- Time-course monitoring of in vitro biotransformation reaction via solid-phase microextraction-ambient mass spectrometry approaches
- Biological analysis of an innovative biodegradable antibiotic eluting bioactive glass/gypsum composite bone cement for treating experimental chronic MRSA osteomyelitis
- Global characterization of modifications to the charge isomers of IgG antibody
- Pharmacokinetics,distribution,and excretion of sodium oligomannate,a recently approved anti-Alzheimer's disease drug in China
- An integrated strategy for comprehensive characterization of metabolites and metabolic profiles of bufadienolides from Venenum Bufonis in rats
- Deciphering bioactive compounds of complex natural products by tandem mass spectral molecular networking combined with an aggregation-induced emission based probe