
Pharmacokinetics,distribution,and excretion of sodium oligomannate,a recently approved anti-Alzheimer's disease drug in China
2022-04-07 12:46:50JiaojiaoLuQiongqunPanJieqiangZhouYanWengKailiChenLvShiGuanxiuZhuChunlinChenLiangLiMeiyuGengZhenqingZhang
Jiaojiao Lu,Qiongqun Pan,Jieqiang Zhou,Yan Weng,Kaili Chen,Lv Shi,Guanxiu Zhu,Chunlin Chen,Liang Li,*,Meiyu Geng,Zhenqing Zhang
aJiangsu Key Laboratory of Translational Research and Therapy for Neuro-Psycho-Diseases;College of Pharmaceutical Sciences,Soochow University,Suzhou,Jiangsu,215021,China
bShanghai Green Valley Pharma.Corp.,Shanghai,201203,China
cMedicilon Preclinical Research(Shanghai)LLC,Shanghai,201299,China
dState Key Laboratory of Drug Research,Shanghai Institute of Materia Medica,Chinese Academy of Sciences,Shanghai,201203,China
Keywords:
Sodium oligomannate
Alzheimer's disease
Pharmacokinetics
LC-MS/MS
Oligosaccharide
A B S T R A C T
The National Medical Products Administration has authorized sodium oligomannate for treating mild-tomoderate Alzheimer's disease.In this study,an LC-MS/MS method was developed and validated to quantitate sodium oligomannate in different biomatrices.The plasma pharmacokinetics,tissue distribution,and excretion of sodium oligomannate in Sprague-Dawley rats and beagle dogs were systematically investigated.Despite its complicated structural composition,the absorption,distribution,metabolism,and excretion profiles of the oligosaccharides in sodium oligomannate of different sizes and terminal derivatives were indiscriminate.Sodium oligomannate mainly crossed the gastrointestinal epithelium through paracellular transport following oral administration,with very low oral bioavailability in rats(0.6%-1.6%)and dogs(4.5%-9.3%).Absorbed sodium oligomannate mainly resided in circulating body fluids in free form with minimal distribution into erythrocytes and major tissues.Sodium oligomannate could penetrate the blood-cerebrospinal fluid(CSF)barrier of rats,showing a constant area under the concentration-time curve ratio(CSF/plasma)of approximately 5%.The cumulative urinary excretion of sodium oligomannate was commensurate with its oral bioavailability,supporting that excretion was predominantly renal,whereas no obvious biliary secretion was observed following a single oral dose to bile duct-cannulated rats.Moreover,only 33.7%(male)and 26.3%(female)of the oral dose were recovered in the rat excreta within 96 h following a single oral administration,suggesting that the intestinal flora may have ingested a portion of unabsorbed sodium oligomannate as a nutrient.
1.Introduction
Sodium oligomannate was found to be safe and effective for treating mild-to-moderate Alzheimer's disease(AD)in clinical phase II and phase III studies[1,2].It was authorized by the National Medical Products Administration(NMPA)of China in November 2019 and became available to the Chinese market in December 2019[3,4].It is the only drug approved worldwide in almost 17 years to treat mild-to-moderate AD[5].This approval is great news to patients,family members,and doctors.
Sodium oligomannate is derived from alginate via two chemical modification steps[6].Alginate is a linear polysaccharide extracted from brown seaweeds and is composed of β-D-mannuronic acid(M)and α-L-guluronic acid(G)with an exclusive 1→4 linkage[7,8].Homogenous polymannuronic acid(M block),polyguluronic acid(G block)domains,and heterogeneous polymanuronic/polyguluronic acid domain(M/G block)occur in alginate[9,10].Partial hydrolysis breaks the M/G block and releases M and G blocks.Subsequently,sodium oligomannate was produced from the purified M block with oxidative degradation.Sodium oligomannate is characterized as β-1-4-linked oligomannuronic acid with certain molecular weight distribution(degree of polymerization from 2 to 10)and a series of mannuronic acid-derived polyhydroxy dicarboxylic acid residues at the reducing terminal of each sugar chain(Fig.1).
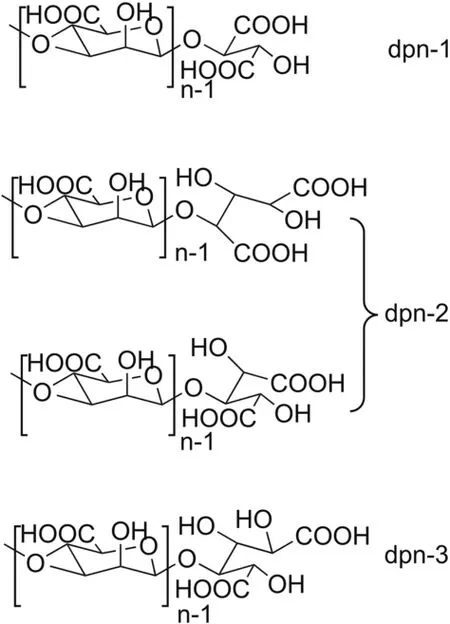
Fig.1.Representative chemical structure of sodium oligomannate(dp:degree of polymerization;n=2 to 10).
Recently,sodium oligomannate was reported to treat mild-tomoderate AD by indirectly regulating gut microbiota,that is,the gut-brain axis mechanism[11].Sodium oligomannate can directly inhibit amyloid-β fibril formation[12,13].As a drug with a novel mechanism for treating neurodegenerative diseases,with potentially new neuro-clinical indications[11]but a complicated structural composition,it is important to verify whether sodium oligomannate enters the systemic circulation and then the brain after oral administration.However,it is crucial to clarify the mechanism of sodium oligomannate.Few methods have been developed and validated for analyzing sodium oligomannate directly in a biological matrix with high accuracy,sensitivity,specificity,and efficiency,as it has an intrinsically complex structure,such as a relatively high molecular weight(670-880 Da),high polarity(carbohydrate-based structure),and complicated composition(size normally distributed and sugar chain terminal derivatives randomly distributed).Thus,the absorption,distribution,metabolism,and excretion(ADME)study of sodium oligomannate lags behind other pharmaceutical studies and clinical studies.
Several methods have been considered to determine sodium oligomannate concentrations in biometrics.However,most of these methods have proven inadequate.The specificity of antibody assays is affected by endogenous glycans,such as heparin,hyaluronic acid,heparan sulfate,dermatan sulfate,and N/O-glycans[14-16].Biofunctional assays are limited by the problems of amyloid-β-related stability and operability[17,18].Moreover,none of the bioassays can effectively discriminate sugar chains of different sizes in biological samples[19-21].Due to its low sample volume requirements,high selectivity,and high sensitivity,LC-MS/MS has become the preferred method for ADME studies[22-24].A few LCMS/MS methods have been reported for the quantitation of oligosaccharides in biological samples,but chemical or enzymatic degradation and post-degradation derivatization before analysis are generally required[25,26].
Here,we developed an LC-MS/MS method to quantify sodium oligomannate directly in different animal biomatrices,including rat plasma,urine,cerebrospinal fluid(CSF),feces,bile,tissues,and dog plasma.Based on this method,we are trying to answer several important questions:1)whether,how,and how much sodium oligomannate enters the systemic circulation and CSF following oral administration;2)whether the ADME behaviors of oligosaccharides with different sizes of sodium oligomannate are the same;and 3)whether sodium oligomannate is metabolized in vivo?The results will help us understand the anti-Alzheimer mechanism of sodium oligomannate and deepen our understanding of its efficacy and safety in clinical use.
2.Materials and methods
2.1.Chemicals and reagents
Sodium oligomannate was provided by Shanghai Green Valley Pharmaceutical Co.,Ltd.(Shanghai,China).The internal standard(IS)d8-valine was purchased from Sigma-Aldrich(St.Louis,MO,USA).All reagents and solvents were of HPLC or analytical grade and were obtained from reliable commercial sources.
2.2.Animals
Sprague-Dawley(SD)rats(SPF grade,180-240 g,6-8 weeks)were purchased from Sino-British SIPPR/BK Lab Animal Ltd.(Shanghai,China)and kept under a 12 h light/dark cycle in a temperature-controlled(25°C)room.SPF rodent growth and reproduction feed and reverse osmosis(RO)purified water were provided ad libitum.All beagle dogs(5.7-10.6 kg)were purchased from Beijing Marshall Biotechnology Co.,Ltd.(Beijing,China).The dog maintenance feed and RO purified water were provided ad libitum.
2.3.Oligosaccharide profile of sodium oligomannate
2.3.1.Preparation of standard samples using blank matrices for oligosaccharide profiling
Stock solutions of sodium oligomannate were prepared in ultrapure water.A series of standard working solutions were prepared by diluting the stock solution with water.The standard working solution(2 μL)was added to 38 μL of the blank matrix(plasma,urine,CSF,or fecal homogenate),and the mixture was vortexed for 1 min to generate the standard samples.It is well known that the concentration of an analyte affects greatly the accuracy of mass spectral detection,and a wide range of sodium oligomannate concentrations in biological matrices after oral or intravenous administration can also be expected.Under these circumstances,the concentration range of the prepared standard samples was roughly equivalent to the expected actual concentration range of sodium oligomannate in the corresponding biological matrices.
2.3.2.Drug administration for oligosaccharide profiling
An appropriate amount of sodium oligomannurate was weighed,added to the required amount of sterile water for injection,vortexed,and sonicated to obtain a colorless or light-yellow transparent solution.Following a single oral administration of sodium oligomannate at different dosages to SD rats or beagle dogs,blood,urine,and feces samples were collected individually predose and at given time points.Immediately after the collection of blood samples into EDTA-K2tubes,plasma was collected by centrifugation.All samples were stored at-70°C prior to the analysis.Details of the drug dosage,collected substrates,and sampling time points are presented in Table 1.

Table 1Animals,dosage,matrix,and sampling time points after oral administration.
2.3.3.Sample preparation
Protein precipitation methods were used to extract sodium oligomannates from biological samples.For each plasma or CSF sample(50 μL),250 μL of extraction solvent(ethanol:acetonitrile:water=34:51:15,containing 50μg/mL d8-valine as an IS)was added.The mixture was vortexed for 2 min and then centrifuged at 18,000 r/min for 7 min.The supernatant was then ready for LC-MS/MS analysis.For rat urine and bile samples,equal volumes of rat plasma were added,and the mixed samples were processed using the same procedure as that used for the plasma sample.Feces and tissue samples were homogenized with ultrapure water at a volume:weight ratio of 10 mL/g.A total of 100μL blank plasma(500 μL)and extraction solvent were added to 100 μL of homogenate,vortexed for 2 min,and then centrifuged at 18,000 r/min for 7 min.The supernatant was analyzed using LC-MS/MS.
2.3.4.LC-MS/MS conditions
The accurate mass and characteristic fragment ions of each component in sodium oligomannate were confirmed using an HILIC-UPLC-Orbitrap MS/MS system(data not shown).Based on these results,the characteristic ion pairs(precursor ion→product ion)of each sodium oligomannate component were selected to construct the multiple reaction monitoring(MRM)ion reaction in LC-MS/MS analysis,and the MS conditions of each ion reaction were optimized to improve the detection sensitivity.
The analyte and IS were separated using a Waters Atlantis®T3(150 mm ×2.1 mm I.D.,3μm)column on a Waters Acquity UPLC system(Milford,MA,USA).The mobile phase was 10 mM ammonium formate in water(mobile phase A)and acetonitrile(mobile phase B),with gradients programmed as follows:initial 5%B maintained for 1.4 min,which was increased to 95%B after 0.4 min,maintained for 1.2 min,then decreased to 5%B in 0.1 min,and maintained for 1.4 min.The flow rate was 0.25 mL/min.An SCIEX Triple Quad™6500 tandem mass spectrometer(Concord,Canada)with an electrospray ionization source was used in the negative mode for mass detection.The MS parameters were as follows:ion spray voltage,-4,500 V;ion source temperature,500°C;curtain gas,35 a.u.;nebulizing gas(GS1),50 a.u.;auxiliary gas(GS2),50 a.u.;and declustering potential,80 V.The collision energy was optimized for each tested sugar chain.
2.3.5.Sodium oligomannate oligosaccharide profiling in biosamples
Because of the interference of endogenous substances in biological matrices,particularly due to their low content and poor ionization efficiency,components with a large degree of polymerization(dp;6 to 10)cannot be accurately determined using the above-mentioned LC-MS/MS method.However,the oligosaccharides of dp2-dp5 are major components of the drug according to their specifications(approximately 85%)based on refractive index detection.Thus,in this study,the smaller-sized components(dp2 to dp5)of sodium oligomannate were used to construct the oligosaccharide profile to understand whether oligosaccharides with different sizes behave indiscriminately.The MRM transitions of these components are listed in Table 2.
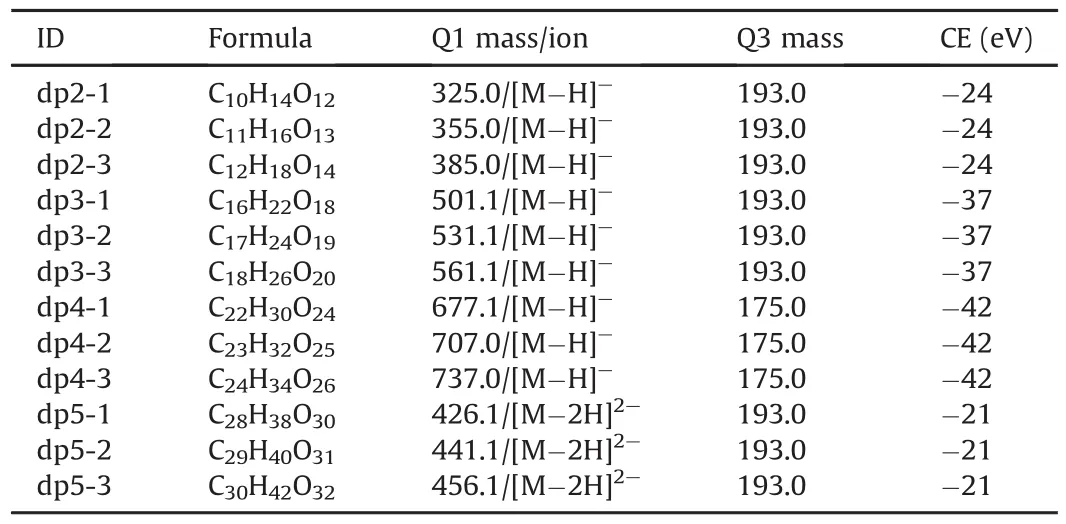
Table 2The formula,characteristic ions,and collision energy(CE)of each oligosaccharide in sodium oligomannate.
The peak area of each oligosaccharide detected in the MRM mode in LC-MS/MS was integrated.The relative percentage based on the peak area of each oligosaccharide component in a sample was calculated by dividing the peak area by the sum of the peak areas of all components.Consequently,an oligosaccharide profile of sodium oligomannate was constructed.
2.4.Method validation
Based on the results obtained from the oligosaccharide profiling studies,a representative component,dp2-2(m/z 355.0→193.0),was selected as the MS detection indicator of sodium oligomannate to develop a bioanalytical method with d8-valine as the IS(m/z 124.0→45.0).Subsequently,the established LC-MS/MS method for absolute quantification of sodium oligomannate concentrations in biological samples was fully validated in accordance with the United States Food and Drug Administration(FDA)Guidance for Industry for Bioanalytical Method Validation,which included system suitability,selectivity,linearity,carryover,accuracy and precision,dilution,recovery,matrix effect,and stability.
2.5.Pharmacokinetic studies in rats
Fifty SD rats were randomly assigned to five groups consisting of equal numbers of male and female rats(n=10 in each group).The animals were fasted overnight prior to drug administration and until 4 h after administration.Rats from group 1 received an intravenous bolus injection of sodium oligomannate at a 2 mg/kg dosage.Serial blood samples(pre-dose,0.083,0.25,0.5,0.75,1,1.5,2,4,8,and 24 h)were collected from the jugular vein into EDTA-K2tubes.Rats from groups 2-4 received gavage doses of 100,200,and 400 mg/kg.Serial blood samples(pre-dose,0.167,0.33,0.5,1,2,4,6,8,10,and 24 h)were collected.For rats from group 5,multiple gavage doses of sodium oligomannate at 200 mg/kg/day were administered for 8 days before serial blood samplings(pre-dose on days 4,5,6,7,and 8,and 0.167,0.33,0.5,1,2,4,6,8,10,and 24 h post-dose on day 8)were collected.Plasma was collected by centrifuging the blood at 3,000 g for 5 min and stored at-70°C until analysis.
Pharmacokinetic parameters,including area under the plasma concentration versus time curve(AUC),plasma clearance(CLP),elimination half-life(t1/2),mean residence time(MRT),and volume of distribution(Vz),were calculated via a non-compartmental method using the Phoenix WinNonlin 7.0 software(Certara,Princeton,NJ,USA).
2.6.Tissue distribution studies in rats
Twenty-four SD rats were randomly assigned to three groups(n=8 per group)with equal numbers of male and female rats.The animals were fasted overnight prior to drug administration 4 h later.Following oral administration of 400 mg/kg of sodium oligomannate,blood samples were collected from the cardiac punctures at 0.25(group 1),1(group 2),and 6 h(group 3),and plasma was collected by centrifuging the blood at 3,000 g for 5 min.After blood sample collection,representative tissues or organs,including the brain,heart,lung,liver,stomach,spleen,kidney,skeletal muscle,abdominal fat,testis(ovary),uterus,bladder,small intestine,and large intestine,were dissected,washed with saline solution,weighed,dried,and stored at-70°C until analysis.
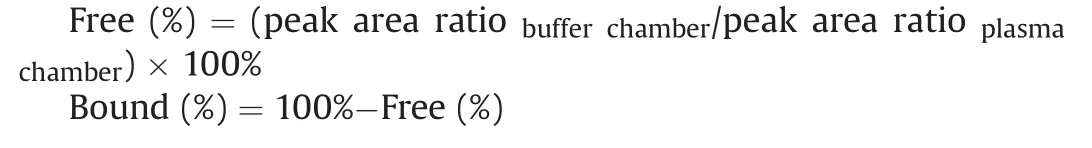
2.7.Plasma protein binding
The in vitro binding of sodium oligomannate to rat and beagle dog plasma proteins was determined at concentrations of 1,10,and 100 μM.Plasma samples containing sodium oligomannate(100μL)were subjected to equilibrium dialysis(n=3)against an equal volume of phosphate-buffered saline(PBS,pH 7.4)at 37°C with gentle shaking at 60 r/min.After 5 h of equilibration,samples were drawn from the buffer chambers,and the plasma chambers were added with the same volume of plasma or PBS to achieve the same conditions.The mixtures were then diluted with 85% aqueous ethanol containing 10μg/mL IS,and the supernatant was analyzed by LCMS/MS.
The concentration of the compound was expressed as the peak area ratio(peak area sodium oligomannate/peak area internal standard),and the protein binding rate was calculated according to the following formula:
2.8.Blood-brain barrier permeability in rats
A total of 150 male SD rats were randomly assigned to three groups(n=50 in each group).Animals from each group were then divided into ten subgroups according to time points(n=5 for each time group).Animals were fasted overnight prior to drug administration and received an intravenous bolus injection of sodium oligomannate at doses of 20,40,and 60 mg/kg.Blood samples were collected from the jugular vein into EDTA-K2tubes at predetermined time points(pre-dose,0.083,0.25,0.5,1,2,4,8,10,and 24 h).Plasma was collected by centrifuging the blood at 3,000 g for 5 min.CSF was collected by direct needle puncture in rats while they were anesthetized.All samples were stored at-70°C until further analysis.
2.9.Excretion studies in rats
Sixteen SD rats were randomly assigned to two groups(n=8 in each group)with equal numbers of male and female rats.The animals were fasted overnight prior to drug administration 4 h later.Rats from group 1 were placed separately in metabolism cages and orally administered 400 mg/kg of sodium oligomannate after an overnight fast.Urine and feces were collected during periods of 0-4,4-8,8-24,24-48,48-72,and 72-96 h after administration.Rats from group 2 were anesthetized,and bile ducts were inserted before oral administration of sodium oligomannate(400 mg/kg).Bile was collected during periods of 0-4,4-8,8-24,and 24-48 h post-dose.All samples were stored at-70°C until further analysis.
2.10.Pharmacokinetic experiments in beagle dogs
Twenty-four beagle dogs were randomly assigned to four groups(n=6 in each group)with equal numbers of males and females and housed individually in stainless steel mobile cages.The animals were fasted overnight prior to drug administration and until 4 h later.Dogs from group 1 received an intravenous bolus injection of sodium oligomannate at a dose of 1 mg/kg.Serial blood samples(pre-dose,0.083,0.25,0.5,1,2,3,4,6,8,and 24 h)were collected from the jugular vein into EDTA-K2--containing tubes.Dogs from groups 2 and 4 received gavage doses of 50 and 200 mg/kg,respectively.Serial blood samples(pre-dose,0.25,0.5,1,2,4,6,8,10,and 24 h)were collected.For dogs in group 3,multiple gavage doses of sodium oligomannate at 100 mg/kg/day were administered for 7 days,followed by the collection of serial blood samples(pre-dose,0.25,0.5,1,2,4,6,8,10,and 24 h at both day 1 and day 7,and pre-dose at days 4,5,and 6)were collected.Plasma was collected by centrifuging the blood at 2,200 g for 10 min and stored at-70°C until analysis.
3.Results
3.1.The oligosaccharide profile of sodium oligomannate
3.1.1.The rat plasma oligosaccharide profile
The mass spectral peak area of each of the 12 sodium oligomannate components was proportional to the concentration of sodium oligomannate in standard samples prepared with blank rat plasma at concentrations ranging from 200 to 30,000 ng/mL.The linear calibration curves are shown in Fig.2A,and regression equations and correlation coefficients(r2)are listed in Table S1.The disaccharide component dp2-2 showed the highest response,followed by dp2-1 and two trisaccharide components,dp3-1 and dp3-2.
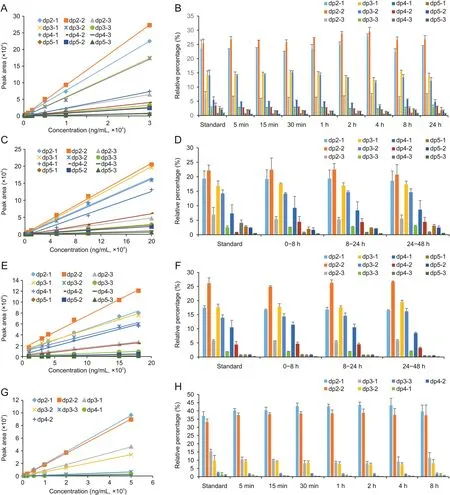
Fig.2.Linear calibration curves for each sodium oligomannate component in(A)rat plasma,(C)urine,(E)feces,and(G)cerebrospinal fluid(CSF)and the oligosaccharide profiles of sodium oligomannate in(B)rat plasma,(D)urine,(F)feces,and(H)CSF.
The oligosaccharide profiles of sodium oligomannate in standard rat plasma samples and rat plasma collected at different time points following oral gavage of 3,000 mg/kg sodium oligomannate were obtained,as shown in Fig.2B.Similar oligosaccharide profiles observed in both the real plasma samples and the standard sample(spike-in)demonstrated the indiscriminate absorption of sodium oligomannate components to systematic circulation in rats following oral gavage.In addition,oligosaccharide profiles of sodium oligomannate did not change significantly with pharmacokinetic sampling time,indicating that the clearance of sodium oligomannate from the systemic circulation was also indiscriminate.
3.1.2.The rat urine oligosaccharide profile
The mass spectral peak area of each of the 12 sodium oligomannate components was proportional to the concentration of sodium oligomannate in standard samples prepared with blank rat urine at concentrations ranging from 1,000 to 200,000 ng/mL.The linear calibration curves are shown in Fig.2C,and the regression equations and correlation coefficients(r2)are listed in Table S1.The disaccharide component dp2-2 showed the highest response,followed by dp3-1,dp2-1,and dp3-2.The oligosaccharide profiles of sodium oligomannate in standard rat urine samples and in rat urine collected at different time points following oral gavage of 1,000 mg/kg sodium oligomannate are shown in Fig.2D.Similar oligosaccharide profiles were observed in both the real urine samples and the spiked urine sample.The fact that oligosaccharide profiles did not change significantly with the sampling periods strongly suggests the indiscriminate elimination of sodium oligomannate components from rat kidneys.
3.1.3.The rat feces oligosaccharide profile
The mass spectral peak areas of each of the twelve sodium oligomannate components were proportional to the concentration of sodium oligomannate in the standard samples prepared with blank rat fecal homogenate at concentrations ranging from 100 to 1,800μg/mL.The linear calibration curves are shown in Fig.2E,and regression equations and correlation coefficients(r2)are listed in Table S1.The disaccharide component dp2-2 showed the highest response,followed by dp2-1,dp3-1,and dp3-2.The oligosaccharide profiles of sodium oligomannate in standard rat feces samples and rat feces collected at different periods following oral gavage of 1,000 mg/kg sodium oligomannate are shown in Fig.2F.Similar oligosaccharide profiles were observed in both real fecal samples and the spike-in feces sample.The fact that oligosaccharide profiles did not change significantly with the sampling periods strongly suggests indiscriminate elimination of sodium oligomannate components from the rat intestine.
3.1.4.The rat CSF oligosaccharide profile
The mass spectral peak areas of each of the seven sodium oligomannate components were proportional to the concentration of sodium oligomannate in the standard samples prepared with blank rat CSF at concentrations ranging from 50 to 5,000 ng/mL.The linear calibration curves are shown in Fig.2G,and regression equations and correlation coefficients(r2)are listed in Table S1.The disaccharide components dp2-2 and dp2-1 showed relatively high responses.The oligosaccharide profiles of sodium oligomannate in the standard rat CSF sample and rat CSF collected at different periods following intravenous injection of 40 mg/kg sodium oligomannate are shown in Fig.2H.Similar oligosaccharide profiles were observed in both the real CSF samples and the spiked CSF sample.The fact that oligosaccharide profiles did not change significantly with the sampling time strongly suggests the indiscriminate distribution of sodium oligomannate components in rat CSF.
3.1.5.The dog plasma oligosaccharide profile
To verify whether there was any difference between species,the oligosaccharide profile in dog plasma was also investigated.Similar to the observations in rats,similar oligosaccharide profiles observed in both the real plasma samples and the spike-in plasma sample demonstrated the indiscriminate absorption and clearance of sodium oligomannate components in dogs following oral gavage 300 mg/kg sodium oligomannate.Detailed data are shown in the supplementary data(Fig.S1).
3.2.LC-MS/MS method validation
The highly similar oligosaccharide profiles observed in the prepared samples and the actual biological samples after drug administration suggest that each of these components can be used as an indicator of sodium oligomannate in mass spectral detection.To obtain a higher detection sensitivity,a representative disaccharide component of sodium oligomannate,dp2-2 (m/z 355.0→193.0),was used to develop a bioanalytical method with d8-valine as the IS(m/z 124.0→45.0).Calibration curves for sodium oligomannate were fitted via linear weighted(1/x2)leastsquares regression.
The established LC-MS/MS method for absolute quantification of sodium oligomannate concentration was fully validated in rat plasma,urine,liver homogenate,and dog plasma,and partially validated in rat blood,fecal homogenate,bile,and tissue homogenate(other than liver),according to the Guidance for Industry for Bioanalytical Method Validation issued by both the United States FDA and the NMPA of China.The results of full validation in rat plasma,urine,liver homogenate,and dog plasma,including system suitability,selectivity,linearity,carryover,accuracy and precision,dilution, recovery, matrix effect, stability and typical chromatograms,are shown in Supplementary data,Tables S2-S5,and Figs.S2-S5.The validated linear ranges of sodium oligomannate concentrations in the biological matrices are shown in Table 3.
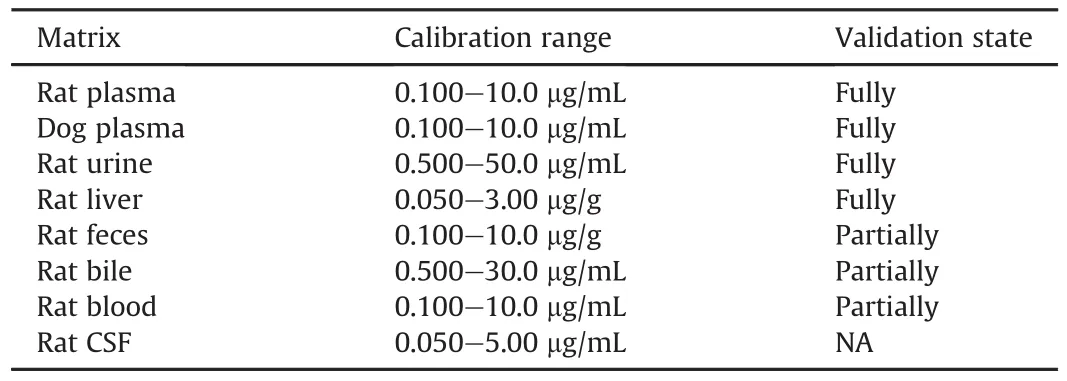
Table 3The calibration ranges of sodium oligomannate concentrations in biological matrices.
3.3.Pharmacokinetic of sodium oligomannate in SD rats
Concentrations of sodium oligomannate in rat plasma were quantified using a fully validated LC-MS/MS method.The mean plasma concentration versus time profiles for sodium oligomannate in male and female rats are shown in Figs.3A-C,and the main pharmacokinetic parameters are presented in Table 4.
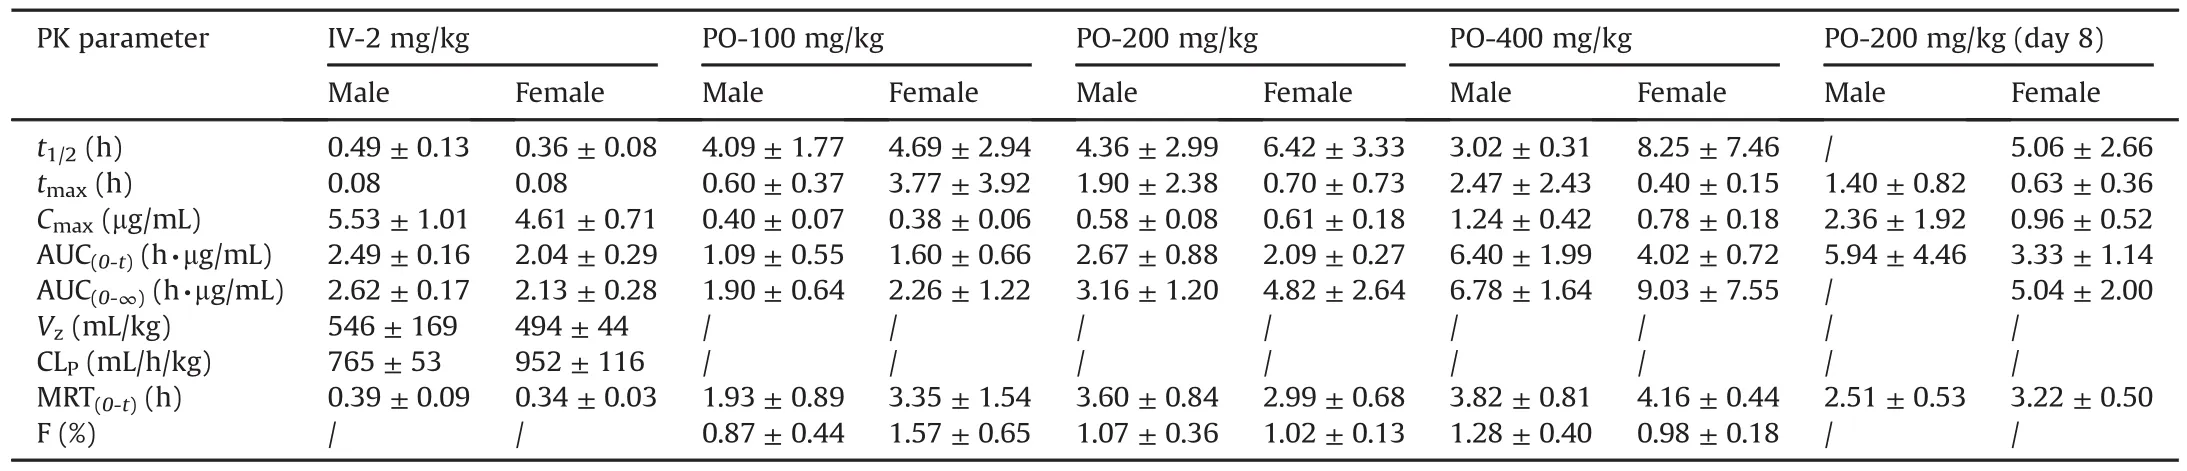
Table 4Pharmacokinetic parameters of sodium oligomannate in Sprague-Dawley rats.
Following single intravenous administration of 2 mg/kg sodium oligomannate,AUC(0-t)for male and female rats were 2.49 and 2.04h·μg/mL,respectively.Vzvalues were relatively small(546mL/kg for males and494mL/kg for females)compared with 670mL/kg of the total body water in rats,indicating minimal extravascular distribution.Circulating sodium oligomannate underwent rapid clearance as indicated by the short terminal t1/2values(0.49h in males and 0.36h in females).In accordance,the drug exhibited high blood clearance of 2319 and 2885 mL/h/kg(obtained by dividing CLPby the blood/plasma ratio of 0.33)inmale and female rats,which are comparable to the rat renal blood flow(2200 mL/h/kg).
Following a single oral administration of 100,200,or 400 mg/kg sodium oligomannate,the increase in mean maximum plasma concentrations(Cmax)for male(1:1.5:3.1)and female(1:1.6:2.1)rats,as well as for plasma exposure(AUC(0-t))in female rats(1:1.3:2.5)were less than dose-proportional,whereas the increase in AUC(0-t)in male rats(1:2.5:5.9)was slightly higher than doseproportional(Fig.3D).The time to maximum concentration(tmax)in male and female rats was 0.6-2.47 h and 0.4-3.77 h,respectively.MRT was 1.93-3.82 h and 2.99-4.16 h,respectively,in males and females.The oral bioavailability of sodium oligomannate in rats was determined to be 0.1%-1.6%.
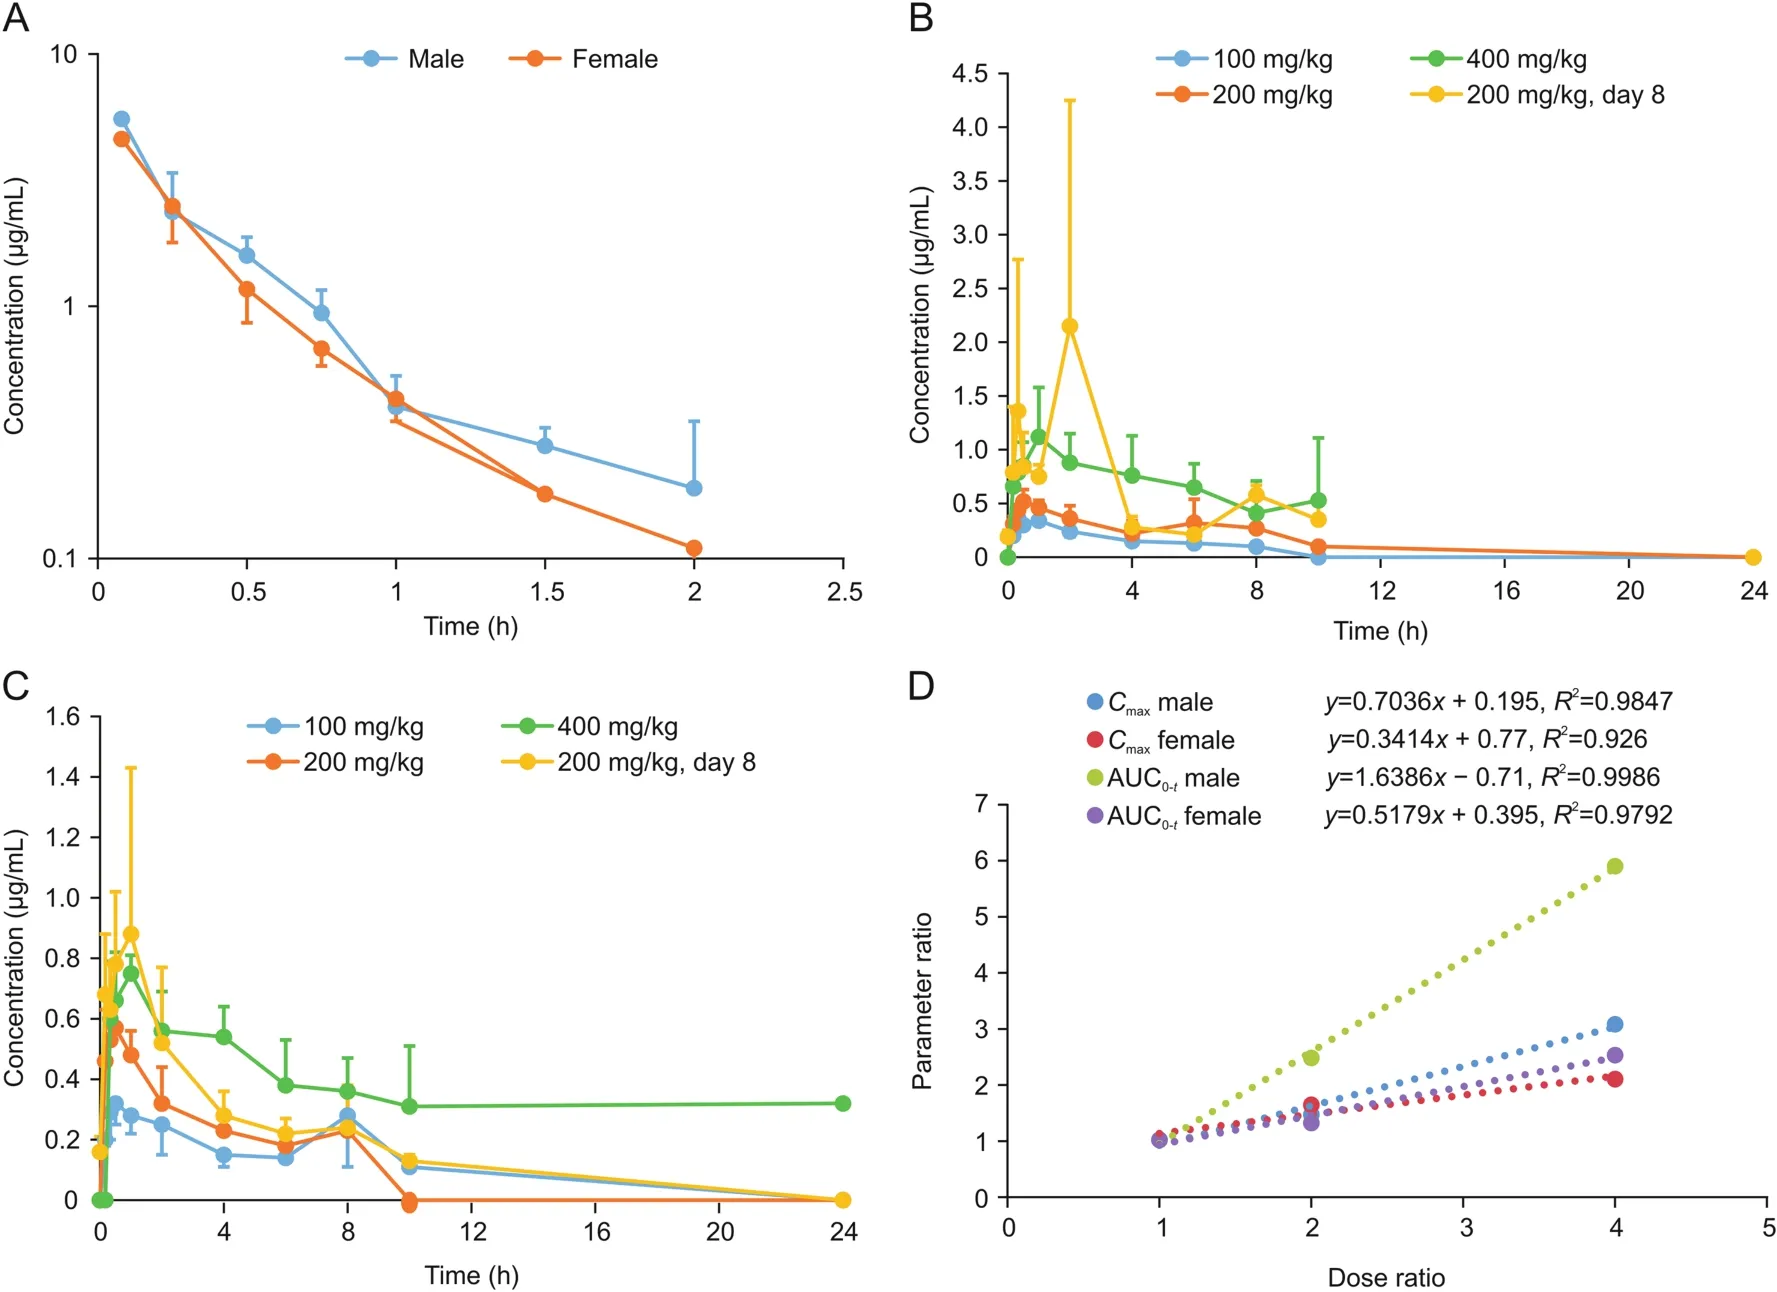
Fig.3.The mean plasma concentration-time profiles of sodium oligomannate in rats(A)after a single 2.0 mg/kg intravenous administration;(B)after single or multiple oral doses in males;(C)after single or multiple oral doses in females;(D)exposure-dose relationship after single oral doses of 100,200,and 400 mg/kg.
After repeated oral doses of sodium oligomannate(200 mg/kg)to SD rats for 8 days,there was no significant difference in the plasma concentration values before the fourth,fifth,sixth,seventh,and eighth dosing(roughly around the LLOQ,0.100μg/mL),indicating that the plasma exposure to sodium oligomannate reached a steady state.After multiple doses,the tmaxand MRT values did not change significantly compared with those from a single dose.The Cmaxratios(RCmax)of the last dose to the first dose for male and female rats were 4.1 and 1.6,and the AUC0-tratios(RAUC)were 2.2(males)and 1.6(females),respectively,indicating that there was a certain accumulation in SD rats following a repeated oral dose.
3.4.Tissue distribution of sodium oligomannate in SD rats
Sodium oligomannate concentrations in male and female rat tissue samples collected at 0.25,1,and 6 h after oral administration of 400 mg/kg are presented in Fig.4.It was mainly distributed in the gastrointestinal tract,while the concentrations in other organs and tissues were low.At 0.25 h after administration,higher drug concentrations were observed in the small intestine and stomach,whereas the small intestine and large intestine were the principal organs of sodium oligomannate distribution at 1 h and 6 h postdose,respectively.
Fig.4.The concentration of sodium oligomannate in(A)male and(B)female rat tissues at 0.25,1,and 6 h after a single 400 mg/kg oral dose.
3.5.Plasma protein binding of sodium oligomannate
The in vitro binding of sodium oligomannate to rat and beagle dog plasma proteins was determined by equilibrium dialysis.The results showed that the binding rate of the drug to rat and dog plasma proteins was less than 7.4% and virtually 0,respectively,in the concentration range of 1-100μM.
3.6.Blood-brain barrier permeability of sodium oligomannate in SD rats
To investigate whether sodium oligomannate could penetrate the blood-brain barrier to reach the brain,male SD rats were administered three doses by intravenous injection.Serial blood and CSF samples were collected,and LC-MS/MS quantified the concentrations of sodium oligomannate.The mean plasma and CSF concentration versus time profiles for sodium oligomannate are shown in Figs.5A and B,respectively.Exposure of rat plasma and CSF to sodium oligomannate was dose-proportional(Fig.5C).
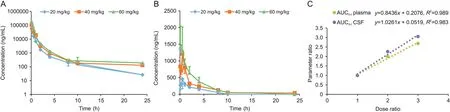
Fig.5.Mean plasma concentration-time profiles of sodium oligomannate in(A)rat plasma and(B)CSF after single intravenous administration.(C)The exposure-dose relationship after single intravenous doses of 20,40,and 60 mg/kg.
Following a single intravenous injection of 20 and 40 mg/kg to SD rats,sodium oligomannate was detected in the CSF as early as 5 min after the dose.The mean peak CSF concentrations were 454.4 and 1215.4 ng/mL,with a tmaxof 0.5 h.Following a single 60 mg/kg intravenous injection of sodium oligomannate,peak CSF concentration(1406.4 ng/mL)was observed at the first sampling time point(5 min).Plasma/CSF exposure(AUCPlasma/AUCCSF)of sodium oligomannate at 20,40,and 60 mg doses were 31,912/1420,63,744/3209,85,757/4334 h·ng/mL,respectively.The mean bioavailability(obtained by dividing AUCCSFby AUCPlasma)of sodium oligomannate to rat CSF was 4.45%,5.03%,and 5.05%,respectively.
3.7.Excretion of sodium oligomannate in SD rats
Both intact and bile duct-cannulated(BDC)rats were used to determine the excretion routes of sodium oligomannate following an oral dose of 400 mg/kg.Concentrations of sodium oligomannate in rat urine,feces,and bile were measured by LC-MS/MS analysis.The cumulative excretion amounts in rat urine,feces,and bile were calculated,and the cumulative excretion percentage curves are shown in Fig.6.At 96 h post-dosing,35.2%(1.2% in urine,0.3% in wash solution,and 33.7% in feces)and 27.1%(0.8% in urine,0.1% in wash solution,and 26.3% in feces)of sodium oligomannate were excreted into male and female rat urine and feces,respectively.Bile excretion in male and female bile duct-cannulated rats accounted for less than 0.004% of the dose within 48 h after administration.
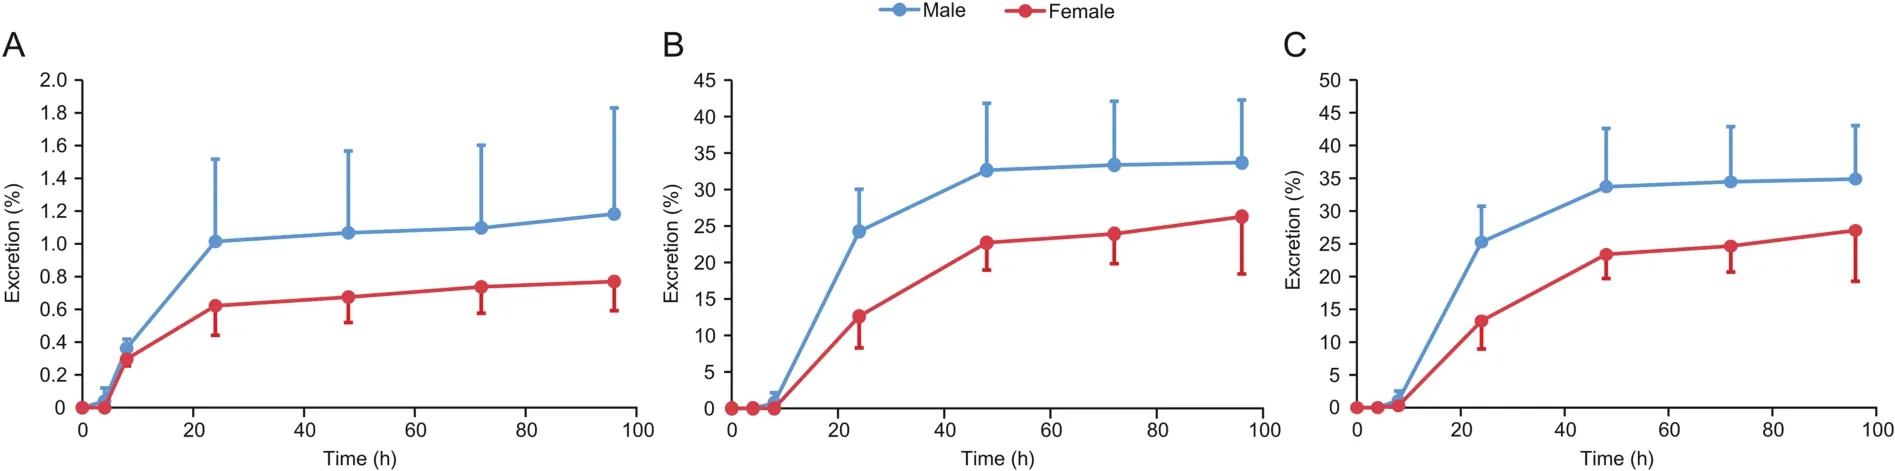
Fig.6.Cumulative excretion curves of sodium oligomannate after a single 400 mg/kg oral dose to SD rats,(A)in 0-96 h urine;(B)in 0-96 h feces;(C)total recovery in urine and feces after 0-96 h.
3.8.Pharmacokinetics of sodium oligomannate in beagle dogs
Concentrations of sodium oligomannate in dog plasma were quantified using a fully validated LC-MS/MS method.The mean plasma concentration versus time profiles for sodium oligomannate in male and female dogs are shown in Figs.7A-C,and the main pharmacokinetic parameters are presented in Table S6.Following single intravenous administration of 1 mg/kg sodium oligomannate,the AUC(0-t)for male and female dogs was 2.95 and 3.31 h·μg/mL,respectively.The Vzvalues(380 mL/kg for males and 360 mL/kg for females)were roughly comparable to the extracellular fluid in dogs(280 mL/kg)and much less than the total body water in dogs(600 mL/kg),indicating minimal extravascular distribution in dogs.Rapid clearance of sodium oligomannate from circulation was revealed by the short terminal t1/2in male(0.81 h)and female dogs(0.86 h).The CLp of sodium oligomannate in male and female dogs were determined to be 321 and 290 mL/h/kg,respectively,and due to the lack of the blood/plasma ratio,its blood clearance in dogs was not determined.
After a single oral administration of 50,100,and 200 mg/kg sodium oligomannate,the increases in Cmaxand AUC(0-t)for male(1:1.1:1.8 for Cmaxand 1:1.1:1.9 for AUC)and female(1:1.2:1.7 for Cmaxand 1:1.3:2.4 for AUC)dogs were less than dose-proportional(Fig.7D).The tmaxand MRT values in male and female dogs were 0.7-1.7 h and 3.4-6.2 h,respectively.The oral bioavailability of sodium oligomannate in dogs was determined to be 4.2%-9.3%.

Fig.7.Mean plasma concentration-time profiles of sodium oligomannate in dogs(A)after a single 1.0 mg/kg intravenous administration;(B)after single or multiple oral doses in males;(C)after single or multiple oral doses in females;(D)exposure-dose relationship after single oral doses of 50,100 and 200 mg/kg.
Following repeated oral doses of sodium oligomannate(100 mg/kg)for 7 days,there was no significant difference in the plasma concentration values before the fourth,fifth,sixth,and seventh dosing in male dogs(roughly around the LLOQ,0.100μg/mL),whereas the trough concentration increased slightly in female dogs over time(0.15,0.25,0.23,and 0.31μg/mL before the fourth,fifth,sixth,and seventh dosing).Compared to the first dose,tmaxand MRT after multiple doses did not change significantly.RCmaxof the last dose to the first dose for male and female dogs was 0.8 and 1.2,and the RAUCvalues for male and female dogs were 1.0 and 1.2,respectively,indicating no accumulation in dogs following a repeated oral sodium oligomannate dose.
4.Discussion
Sodium oligomannate,a newly authorized drug for the improvement of cognitive function in patients with mild-to-moderate AD,was found to reduce gut microbiota dysbiosis-promoted neuroinflammation and amyloid β plaque deposition in AD progression[11-13].Due to the oligosaccharide nature of sodium oligomannate,it has long been debated whether this substance can be absorbed effectively and cross the blood-brain barrier into the central nervous system(CNS)after oral administration.It seems that it is not an ideal lead compound for CNS drugs from the perspective of traditional pharmaceutical chemists[27],such as complicated composition,relatively large molecular weight,high polarity,too many hydrogen bond donors and receptors,and strong dissociation tendency under physiological conditions(acidic pKa 3.59).
Elucidating the ADME properties of a drug in the body is an important prerequisite for understanding drug efficacy and safety[28].However,the lack of a reliable biological method impeded the ADME evaluation of sodium oligomannate due to its complicated composition and disadvantageous physicochemical properties in view of instrument detection.
As sodium oligomannate comprises a series of oligosaccharides with different sizes and terminal derivatives,they were profiled in various biosamples to verify if they behave differently in ADME.The comprehensive results showed no significant difference in the oligosaccharide profiles between the spiked samples and corresponding real rat plasma,urine,feces,CSF,and dog plasma samples collected over the pharmacokinetic sampling time post-dose.This finding suggests the indiscriminate absorption,distribution,and excretion of the oligosaccharides from sodium oligomannates with different sizes and terminal derivatives and no apparent intertransformation between these components.
An LC-MS/MS method to quantify sodium oligomannate in various bio-matrixes was developed,validated,and applied based on oligosaccharide profiling.The ADME properties of sodium oligomannate in animals were investigated.
The oral bioavailability of sodium oligomannate in rats(0.1%-1.6%)and dogs(4.2%-9.3%)was very low.In addition,sodium oligomannate showed extremely low membrane permeability(Papp<1×10⁻⁷cm/s in the concentration range of 75-300μM)in the Caco-2 cell monolayer model(data not shown).It did not act as a substrate for uptake transporters,including the organic anion transporting polypeptide 1B1(OATP1B1),OATP1B3,organic anion transporter 1(OAT1),OAT3,and organic cation transporter 2,and efflux transporters,including P-glycoprotein and breast cancer resistant protein(data not shown).Since sodium oligomannate is primarily ionized at physiological pH(7.4)due to its low acidic pKa value,it may cross the epithelium through paracellular transport[29,30].It is further postulated that rats are a better model than dogs(which tend to produce overestimations)for predicting human oral bioavailability of paracellularly absorbed compounds due to species-dependent physiological differences[31,32].Thus,the oral bioavailability of sodium oligomannate in humans is expected to be low.
After absorption into the systemic circulation,sodium oligomannate is likely to remain in circulating body fluids with minimal extravascular distribution to most organs and tissues regardless of blood flow or blood volume,as indicated by its small Vzvalues in both rats and dogs.Circulating sodium oligomannate does not bind to albumin and mainly exists in the free form.Its distribution into erythrocytes was minimal,as indicated by its low blood/plasma ratio(0.33)in SD rats.High concentrations of sodium oligomannate were only found in the digestive tract-related organs in a timedependent gastrointestinal transport manner after a single oral dose of 400 mg in SD rats.Sodium oligomannate can quickly penetrate the blood-CSF barrier following intravenous injection,as indicated by the short tmaxvalues observed in the CSF sample(less than 0.5 h).In addition,the dose-dependent increase in sodium oligomannate exposure in both CSF(AUCCSF)and plasma(AUCPlasma)resulted in a constant AUC ratio of approximately 5%,indicating that the distribution of sodium oligomannate from the circulation to the CSF solely depends on the concentration gradient between them.In contrast,the Cmaxvalue in rat CSF increased slightly higher than the dose increases between the dose range of 20 mg/kg and 40 mg/kg,while there was no significant change at a higher dose,such as 60 mg/kg.Collectively,these data suggest a paracellular transport mechanism of sodium oligomannate that penetrates the blood-CSF barrier in SD rats[33,34].
After a single oral administration to BDC rats,virtually no detectable sodium oligomannate was observed in the bile samples up to 48 h post-dose,indicating a minor role of biliary excretion during elimination.The cumulative urinary excretion(1.5% for males and 0.9% for females)of sodium oligomannate is equivalent to its oral bioavailability(1.3% for men and 1.0% for women),supporting a predominantly renal sodium oligomannate excretion.Considering that the oligosaccharide profiles remained the same and no significant difference was observed between bioavailability and urine excretion ratio,no metabolism was suggested.Moreover,the rapid clearance of sodium oligomannate by the rat(blood clearance comparable to the renal blood flow)and dog(CLPequal to 22%-25% of the renal blood flow)kidney resulted in a short terminal t1/2in rats(less than 0.5 h)and dogs(0.8 h)following intravenous administration.
Interestingly,only 33.7% and 26.3% of the oral dose was recovered in male and female rats within 96 h following a single oral dose,respectively.Two factors may have contributed to this phenomenon.First,the unabsorbed sodium oligomannate in the feces sample was not fully extracted by our procedure,and second,a portion of unabsorbed sodium oligomannate was ingested by the intestinal flora as a nutrient,or both.
In conclusion,the ADME profiles of a newly approved innovative anti-AD drug,sodium oligomannate,were investigated.The results showed that it could be absorbed into the systemic circulation after oral administration with low bioavailability.Sodium oligomannate was also detected in the CSF of rats but at a very low level.The absorbed portion was neither metabolized by the body nor distributed extensively to the tissues but was quickly excreted into the urine.The intestinal flora may ingest part of the unabsorbed drug as a nutrient,and the remaining portion is excreted with feces.
CRediT author statement
Jiaojiao Lu:Methodology,Investigation,Writing-Original draft preparation;Qiongqun Pan:Methodology,Investigation,Writing-Original draft preparation;Jieqiang Zhou:Methodology;Yan Weng:Data curation,Validation;Kaili Chen:Data curation,Validation;Lv Shi:Methodology;Guanxiu Zhu:Project administration, Data curation, Validation; Chunlin Chen: Project administration;Liang Li:Methodology,Investigation,Writing-Original draft preparation;Meiyu Geng:Conceptualization,Supervision,Writing-Reviewing and Editing;Zhenqing Zhang:Conceptualization,Supervision,Writing-Reviewing and Editing,Funding acquisition.
Declaration of competing interest
The authors declare that there are no conflicts of interest.
Acknowledgments
This work was supported by the National Natural Science Foundation of China(Grant No.:81673388),the Jiangsu Key Laboratory of Translational Research and Therapy for Neuro-Psycho-Diseases(Grant No.:BM2013003),and the Priority Academic Program Development of Jiangsu Higher Education Institutes(PAPD).
Appendix A.Supplementary data
Supplementary data to this article can be found online at https://doi.org/10.1016/j.jpha.2021.06.001.
 Journal of Pharmaceutical Analysis2022年1期
- Journal of Pharmaceutical Analysis的其它文章
- Time-course monitoring of in vitro biotransformation reaction via solid-phase microextraction-ambient mass spectrometry approaches
- Erythrocyte sphingolipid species as biomarkers of Alzheimer's disease
- Biological analysis of an innovative biodegradable antibiotic eluting bioactive glass/gypsum composite bone cement for treating experimental chronic MRSA osteomyelitis
- Global characterization of modifications to the charge isomers of IgG antibody
- An integrated strategy for comprehensive characterization of metabolites and metabolic profiles of bufadienolides from Venenum Bufonis in rats
- Deciphering bioactive compounds of complex natural products by tandem mass spectral molecular networking combined with an aggregation-induced emission based probe