
An integrated strategy for comprehensive characterization of metabolites and metabolic profiles of bufadienolides from Venenum Bufonis in rats
2022-04-07 12:46:50WenLongWeiHoJvLiWenZhiYngHuQuZhenWeiLiChngLingYoJinJunHouWnYingWuDeAnGuo
Wen-Long Wei,Ho-Jv Li,Wen-Zhi Yng,Hu Qu,Zhen-Wei Li,b,Chng-Ling Yo,Jin-Jun Hou,Wn-Ying Wu,*,De-An Guo,b,**
aShanghai Research Center for Modernization of Traditional Chinese Medicine,National Engineering Laboratory for TCM Standardization Technology,Shanghai Institute of Materia Medica,Chinese Academy of Sciences,Shanghai,201203,China
bUniversity of Chinese Academy of Sciences,Beijing,100049,China
Keywords:
Metabolic profiles
Extension-mass defect filter
Multidimensional data acquiring
Metabolic network prediction
Bufadienolides of Venenum Bufonis
A BS T R A C T
Comprehensive characterization of metabolites and metabolic profiles in plasma has considerable significance in determining the efficacy and safety of traditional Chinese medicine(TCM)in vivo.However,this process is usually hindered by the insufficient characteristic fragments of metabolites,ubiquitous matrix interference,and complicated screening and identification procedures for metabolites.In this study,an effective strategy was established to systematically characterize the metabolites,deduce the metabolic pathways,and describe the metabolic profiles of bufadienolides isolated from Venenum Bufonis in vivo.The strategy was divided into five steps.First,the blank and test plasma samples were injected into an ultra-high performance liquid chromatography/linear trap quadrupole-orbitrap-mass spectrometry(MS)system in the full scan mode continuously five times to screen for valid matrix compounds and metabolites.Second,an extension-mass defect filter model was established to obtain the targeted precursor ions of the list of bufadienolide metabolites,which reduced approximately 39% of the interfering ions.Third,an acquisition model was developed and used to trigger more tandem MS(MS/MS)fragments of precursor ions based on the targeted ion list.The acquisition mode enhanced the acquisition capability by approximately four times than that of the regular data-dependent acquisition mode.Fourth,the acquired data were imported into Compound Discoverer software for identification of metabolites with metabolic network prediction.The main in vivo metabolic pathways of bufadienolides were elucidated.A total of 147 metabolites were characterized,and the main biotransformation reactions of bufadienolides were hydroxylation,dihydroxylation,and isomerization.Finally,the main prototype bufadienolides in plasma at different time points were determined using LC-MS/MS,and the metabolic profiles were clearly identified.This strategy could be widely used to elucidate the metabolic profiles of TCM preparations or Chinese patent medicines in vivo and provide critical data for rational drug use.
1.Introduction
Metabolism is undoubtedly significantly correlated with the efficacy and safety of drugs,especially those used in traditional Chinese medicine(TCM)[1-3].However,the diversity,complexity,and low content of active agents make global characterization of metabolites and elucidation of their metabolic profiles in vivo very challenging[4,5].The challenge of elucidating these substances is usually associated with the following disadvantages:1)the low content of prototype compounds in plasma,2)the trace amount of metabolites in vivo[6,7],3)the diversity of metabolic pathways[8],and 4)the restricted generation characteristic fragments with coelution of diverse metabolites and matrix interference.
Recently,hyphenated techniques such as liquid chromatography/mass spectrometry(LC-MS)have become an effective platform for the rapid characterization of metabolites and elucidation of metabolic profiles in vivo owing to their powerful separation capacity,remarkable sensitivity,and high throughput[9].In particular,ultra-high performance LC(UHPLC)coupled with highresolution MS(HR-MS)has often been used to characterize the metabolites in biological samples based on accurate mass and MS/MS information[10-12].UHPLC coupled with triple quadrupoletandem MS has been used to quantitate the concentration of analytes in plasma for metabolic profile elucidation based on the multiple reaction monitoring(MRM)mode[13-15].
For chemical characterization based on HR-MS,two models were used to acquire MS data and characteristic fragments.The first was data-independent acquisition(DIA),which provided highthroughput fragmentation information for the structural elucidation of chemical components[16-18].However,the deconvolution and attribution of diagnostic fragments were laborious and tedious[16,17].Compared with DIA,the second mode,data-dependent acquisition(DDA)combined with diverse selection criteria such as the precursor ion list(PIL)[19],exclusion list[20],neutral loss[21],product ion[22],and mass defect filter(MDF)[23],may be a superior option to improve sensitivity and selectivity in obtaining MS/MS or MSndata[24-26].
However,DDA scans usually inevitably miss fractional PIL information,which does not trigger MS/MS fragmentation.Recently,gas-phase fractionation with staggered mass range and timestaggered PIL models have been developed to notably enhance MS/MS coverage to improve the identification of chemical components compared to that achieved with the conventional DDA mode[27].Furthermore,a sequentially step-wise targeted MS/MS method was used to acquire the MS/MS spectra of all the plasma metabolites for targeted metabolomics studies[28].
The time-staggered PIL was also developed to improve the performance of MS/MS acquisition in untargeted metabolomics[29].Regarding the post-processing of MS data,a number of remarkable process models,such as the diagnostic product ion network[30],mass defect filtering[31],mass spectral tree substructure recognition and statistical analysis[32],mass spectral tree similarity filtering[33],and diagnostic ion-guided network bridging[34],could dramatically simplify the MS spectral elucidation and make the characterization convenient.In addition,sectional commercial software such as UNIFI[35,36],Mass Frontier[37],and Compound Discoverer[38]could be used to match the measured MS and MS/MS information with theoretical data obtained from the prediction and in-house libraries.This is achieved using the scoring algorithms and structure matching to obtain the metabolic pathway prediction in an automatic mode for the identification of metabolites.For the elucidation of metabolic profiles,MRM with QqQ-MS enabled the detection of multiple analytes simultaneously covering an extensive concentration range in biological samples[39,40].Furthermore,the MRM model exhibited high sensitivity and specificity,and has been widely used for pharmacokinetic and metabolic profile studies[41,42].
Venenum Bufonis(VB),the dry secretions of Bufo gargarizans Cantor or Bufo melanostictus Schneider as stipulated in the Chinese Pharmacopoeia(2015 edition),has been used to treat sunstroke,fainting,and acute filthy disease such as abdominal pain or vomiting and diarrhea.Bufadienolides are the main active constituents that exhibit diverse antitumor activities against numerous cancer cells[43-45],but their strong cardiotoxicity and neurotoxicity limit their clinical applications[46,47].The efficacy and toxicity of these compounds are closely related to their metabolism,so the comprehensive characterization of their metabolites and metabolic profiles is important for drug evaluation in vivo.However,no effective strategy has been developed to systematically characterize the metabolites of bufadienolides,and few studies have integrally evaluated the metabolic profiles of VB.
In this study,an integral and convenient five-step strategy was established to study the metabolic profile of VB.First,test and blank plasma samples were detected using UHPLC/linear ion trap(LTQ)-Orbitrap MS in the full scan mode,and the data were used to screen the valid metabolites whereas the blank was deducted using MZmine2.Second,an extension-MDF(E-MDF)model was established to screen the targeted PIL.Third,the multidimensional data acquisition model was optimized and applied to trigger more MS/MS fragmentation of metabolites.Fourth,the obtained data were imported into Compound Discoverer software to identify metabolites.Finally,the main prototypes were simultaneously quantitated for the entire metabolic profile study of the VB sample.
2.Experimental
2.1.Chemicals and materials
HPLC-grade acetonitrile and methanol were purchased from Merck KGaA(Merck,Darmstadt,Germany).Formic acid(FA)was purchased from Sigma-Aldrich(St.Louis,MO,USA),and deionized water was prepared using a Millipore Alpha-Q water purification system(18.2 MΩ‧cm at 25°C;Millipore,Bedford,MA,USA).VB was purchased from Sanyitang Chinese Medicine Decoction Slice Co.,Ltd.(Bozhou,China).Authentication of the drug materials was confirmed using thin layer chromatography and HPLC assays according to the Chinese Pharmacopoeia(2015edition).A voucher specimen(CS20161101)of the plant was deposited at the Shanghai Institute of Materia Medica,Chinese Academy of Sciences(Shanghai,China).The following 14 bufadienolides reference standards were isolated from the VB sample:pseudobufarenogin(CS01),arenobufagin(CS03),hellebrigenin(CS04),19-oxocinobufotalin(CS11),telocinobufagin(CS14),bufotalin (CS15),resibufagin(CS16),19-oxocinobufagin(CS17),cinobufotalin(CS19),bufalin(CS21),resibufogenin(CS22),cinobufagin(CS23),desacetylcinobufagin(CS30),and gamabufotalin(CS36)with purity>98% as determined using HPLC-ultraviolet(UV)spectroscopy.Seven bufadienolides reference standards,namely,desacetylbufotalin,cinobufaginol,19-oxobufalin,1beta-hydroxybufalin,bufarenogin,marinobufagenin,and bufotalinin,were isolated from the VB sample with purities>90%,as determined using HPLC-UV spectroscopy.BF211 was synthesized in our laboratory for use as the internal standard(IS)and the purity was>98%,as determined using HPLC-UV spectroscopy.The structures of the various compounds are shown in Table S1.
2.2.Blood collection and sample preparation
Male Wistar rats(200±20 g)purchased from SLAC Lab Animal Center(Shanghai,China)were used in the various experiments according to the protocol approved by the Review Committee of Animal Care and Use at Shanghai Institute of Materia Medica(Shanghai,China).Wistar rats were housed in a room with controlled temperature(20-24°C),relative humidity(40%-70%),and unidirectional airflow,under a 12 h light/dark cycle.The rats were fed food and water ad libitum for 7 days before the experiments and allowed to acclimate to the environment.The 0.5% dimethyl sulfoxide was used to dissolve bufadienolides preliminarily,and 5 mg/mL sodium carboxymethylcellulose was used for dispersion of bufadienolides.The rats were intragastrically administered the crude extract at a dose of 200 mg/kg.Blood samples were collected in heparinized tubes on ice at 0,0.083,0.25,0.5,0.75,1,2,4,6,8,10,and 24 h after intragastric administration and then immediately centrifuged at 3,500 r/min for 10 min.The supernatants were transferred into new tubes and stored at-20°C until analysis.
Sample preparation for qualitative analysis:1 mL of ethyl acetate and 100μL of plasma sample were added to a centrifuge tube.The mixture was vortexed for 3 min,centrifuged for 10 min at 3,500 r/min,and then 900μL of the supernatant was transferred into a new tube and evaporated to dryness under a nitrogen gas(N2)stream.Subsequently,100μL of a 20% acetonitrile-water(V/V)solution was used to redissolve the residue.Finally,the solution was centrifuged at 14,000 r/min for 10 min after vortexing for 3 min,and 10μL of supernatant was injected into the UHPLC for analysis.
Sample preparation for quantitative analysis:the 14 bufadienolides reference standards were dissolved in methanol to a concentration of 1 mg/mL as stock solutions,which were each further diluted with 50% methanol-water(1:1,V/V)to obtain seven standard working solutions of varying concentrations and low,medium,and high quality control(QC)samples.For the standard curve,each standard solution(5 μL),blank plasma(95 μL),and IS working solution(10μL)were added to a 1.5 mL centrifuge tube,vortexed,and then 1 mL of ethyl acetate was added for extraction.The mixture was vortexed and centrifuged at 3,500 r/min for 10 min,and then the supernatant(900μL)was transferred into a 1.5 mL tube and evaporated to dryness at 40°C.The residue was redissolved in 100μL of 20% acetonitrile,and the supernatant was transferred to a sample vial for analysis after centrifugation.For the experimental samples,100 μL of plasma samples,10 μL of IS working solution,and 1 mL of ethyl acetate were added to a 1.5 mL centrifuge tube,followed by the same steps described above.
2.3.UHPLC/LTQ-Orbitrap MS
An Ultimate®3000 UHPLC system(Thermo Fisher Scientific,San Jose,CA,USA)equipped with an ACQUITY UPLC®HSS T3 column(2.1 mm×100 mm,1.8μm)was used for the separation.The column temperature was 30°C and the flow rate was 0.5 mL/min.The elution was performed using a binary mobile phase consisting of 0.1% FA-water(A)and acetonitrile(B)with the following gradient program:0-2 min,0-5%B;2-4 min,5%-17%B;4-6 min,17%-28%B;6-9 min,28%B;9-14 min,28%-35%B;14-20 min,35%-39%B;20-30 min,39%-95%B;and 30-35 min,95%B.
An LTQ-Orbitrap Velos Pro hybrid mass spectrometer(Thermo Fisher Scientific,San Jose,CA,USA)connected to the UHPLC system via an electrospray ionization source was used to obtain HR-MS data in the positive mode.The parameters used were as follows:spray voltage,3 kV(Fig.S1);capillary temperature,320°C;source heater temperature,300°C;sheath gas(N2),40 a.u.;and auxiliary gas(N2),10 a.u..In scan event 1,the conditions were as follows:analyzer,Fourier transform MS;mass range,m/z 100-1500;scan type,full;and resolution,30,000.In event 2,the conditions were as follows:activation type,collision-induced dissociation;default charge state,1;isolation width,m/z 2;normalized collision energy,30 V(Fig.S2);activation,0.25;and activation time,10 ms.
2.4.Generation of target PIL and data acquisition
The plasma samples were injected into the UHPLC/LTQ-Orbitrap mass spectrometer in the full-scan mode with five replicate injections.The raw data format was transferred to mzXML using MSconvert and imported into MZmine2 for the chromatographic peak extraction,alignment,and data analysis using default settings.The chromatographic peak that appeared three times and the relative standard deviation(RSD)of the peak area that was not>30% were considered the stable precursor ion.The PIL of the blank plasma samples was obtained using the same process.
To acquire the targeted PIL,the PIL obtained after deducting the blank was further screened using an E-MDF.Then,the plasma samples were injected into the UHPLC/LTQ-Orbitrap mass spectrometer to trigger the MS/MS fragments with the targeted PIL.The data acquisition method of the MS/MS process and the multidimensional data acquisition method were selected.
2.5.Elucidation of bufadienolide metabolic pathways
The Compound Discoverer software is an efficient tool for the identification of metabolites.A five-step metabolic network prediction method was used to elucidate the metabolic pathways and the workflow is shown in Fig.1.First,the structure files of bufadienolides(in-house library)were imported into the software to generate the theoretical metabolite library.The theoretical pathways of the bufadienolides were dehydration,desaturation,hydration,oxidation,oxidative deamination to alcohol,oxidative deamination to ketone,reduction,conversion of thiourea to urea in a phase I metabolic reaction,acetylation,arginine conjugation,cysteine conjugation 1 (C3H5NO2S),cysteine conjugation 2(C3H7NO2S),glucoside conjugation,glucuronide conjugation,glutamine conjugation,glycine conjugation,GSH conjugation 1(C10H15N3O6S),GSH conjugation 2 (C10H17N3O6S),ornithine conjugation,palmitoyl conjugation,stearyl conjugation,sulfation,and taurine conjugation in phase II metabolic reactions.Then,the peak alignment and peak extraction were implemented after importing the MS/MS data into the Compound Discoverer.Third,a theoretical metabolite library and database supplied by Thermo with a mass tolerance of 5 ppm and a threshold of S/N≥3 was screened for possible metabolites.Finally,the match degree between the predicted and theoretical metabolites was evaluated by comparing the acquired MS/MS fragments and predicted characteristic fragments,and the metabolite list was ranked according to Fragment Ion Search(FISh)scores.
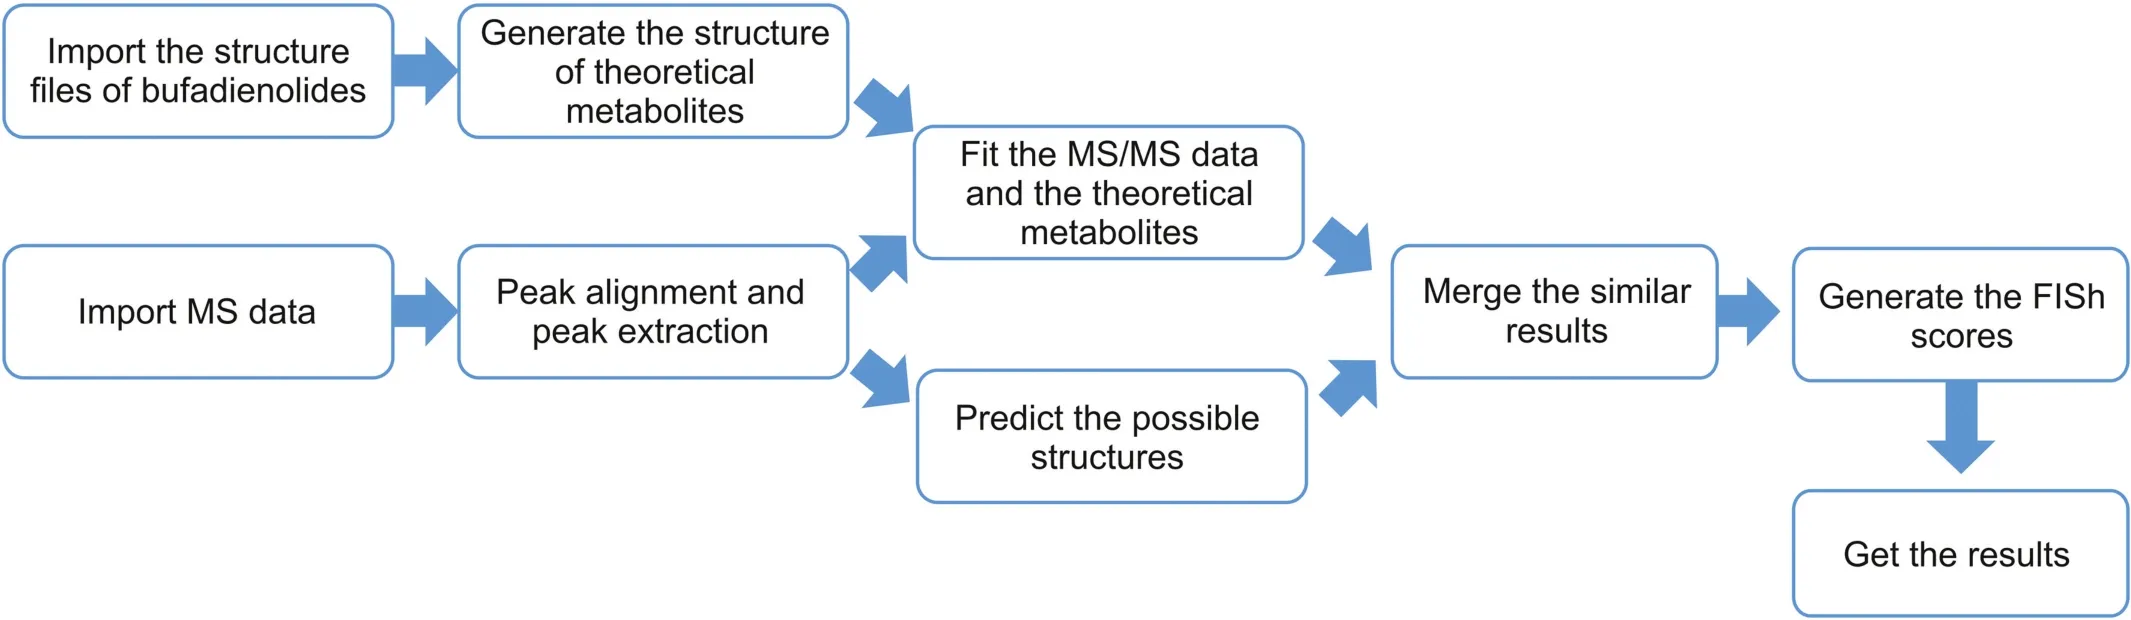
Fig.1.Workflow of Compound Discoverer software.MS:mass spectrometry;FISh:Fragment Ion Search.
Metabolic network prediction was useful for identifying the metabolites.The MS/MS spectra of bufalin and its hydroxylated metabolite(compound B)are presented as an example(Fig.2).Fig.2 shows that the characteristic peaks were obviously different between bufalin and compound B,with a difference of 16 Da.Thus,compound B was likely the hydroxylated metabolite of bufalin.
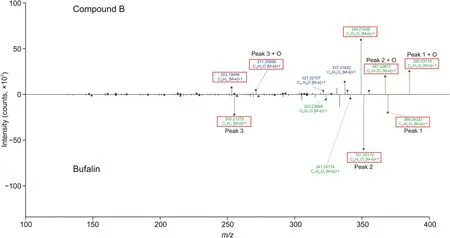
Fig.2.Tandem mass spectrometry(MS/MS)spectra of bufalin and compound B.
2.6.Metabolic profile study using UHPLC-MS/MS
A UHPLC-MS/MS system consisting of an Agilent UHPLC system(Agilent Technologies,Palo Alto,CA,USA)equipped with a column manager,sample manager,binary pump,and Applied Biosystems 4000 QTRAP®LC-MS/MS system(Toronto,Canada)was used in the metabolic profile study of bufadienolides.The ACQUITY UPLC®HSS T3 column(2.1 mm×100 mm,1.8μm)was used for the separation,and the eluent was composed of 0.1% FA-water(V/V,A)and acetonitrile(B).The gradient elution program was as follows:0-2 min,5%B;2-4 min,5%-17%B;4-6 min,17%-28%B;6-9 min,28%B;9-14 min,28%-35%B;14-20 min,35%-39%B;20-21 min,39%-95%B;and 21-25 min 95%B.The flow rate was 0.4 mL/min.Other parameters were as follows:column temperature,40°C;injection volume,10μL;curtain gas,35 psi;ion spray voltage,5500 V;ion spray temperature,500°C;heater gas,50 psi;nebulizer gas,50 psi;and collision gas,medium.The AB Sciex Analyst 1.6.3 software was used for instrument control,data acquisition,and raw data processing.The pharmacokinetic parameters were analyzed using the Drug and Statistics(DAS,version 2.0,Anhui,China)software and the concentration-time curve of the bufadienolides was constructed using GraphPad Prism 5.01.
2.7.UHPLC-MS/MS method validation
The method was developed in accordance with the US Food and Drug Administration guidelines.The specificity,accuracy,precision,recovery,matrix effect,dilution effect,and stability were evaluated as described in the following sections.
2.7.1.Specificity
The specificity of the following bufadienolides was evaluated at the lower limit of quantitation(LLOQ):pseudobufarenogin(CS01),arenobufagin(CS03),hellebrigenin(CS04),19-oxocinobufotalin(CS11),telocinobufagin (CS14),bufotalin (CS15),resibufagin(CS16),19-oxocinobufagin(CS17),cinobufotalin(CS19),bufalin(CS21), resibufogenin (CS22), cinobufagin (CS23),desacetylcinobufagin(CS30),and gamabufotalin(CS36).For the LLOQ,the peak area of the blank was expected to be<20% of that of the LLOQ at the retention time of the analytes,and the peak area of the IS was expected to be<5%.
2.7.2.Accuracy and precision
The QCs including the LLOQ and low-,medium-,and highconcentration(3,25,and 160 ng/mL)QC samples were analyzed over 3 consecutive days(n=6)to determine the intra-and inter-day precisions.The accuracy was calculated as the relative error(RE;RE=absolute error/true value),which was expected to be within±15%.The precision was calculated as the RSD,which was expected to be within±20% for the LLOQ and within±15% for other QCs.
2.7.3.Recovery,matrix effect,and dilution effect
The recovery was investigated by calculating the ratio of the mean peak areas of the extracted QC samples to that of the unextracted sample,and the RSD was expected to be within±15%.The matrix effect was evaluated by comparing the peak areas of analytes resolved in extracted blank plasma with those in which blank plasma was substituted with water at three concentration levels.The matrix effect was considered acceptable if the RSD was not more than 15%.The concentration of CS03 was above the linear range in plasma so the dilution effect was evaluated.
2.7.4.Stability
The stability of 14 bufadienolides was evaluated by evaluating the QC samples following storage under different conditions at low(3 ng/mL)and high(160 ng/mL)concentration levels(n=6).The autosampler and freeze-thaw stability(short-term and long-term freeze-thaw stability)were evaluated by analyzing the samples following storage at an ambient temperature for 4 h,4°C for 24 h in an autosampler,freeze-thaw three times with every freeze-thaw cycle not less than 12 h.The analytes were considered stable when the bias(%)between the measured and theoretical QC values was not more than±15%.
3.Results and discussion
3.1.Construction of E-MDF for screening target PIL
MDF is a powerful data processing method for removing a mass of interfering ions.To eliminate interfering ions in the PIL,an EMDF was developed using the expanded metabolite library(Fig.3,Table 1)for screening the targeted PIL.The E-MDF was established in four steps.First,140 bufadienolides(bufogenin without the side chain),which are the primary bioactive constituents of VB,were screened as prototype compounds.The mass(m/z)of these bufadienolides was previously characterized(Table S2)[48].Second,the 140 prototype bufadienolides were extended with 44 regularmetabolic pathways(Table S3),and an in-house library containing 6160 metabolites was obtained.Then,the E-MDF was established with a mass(m/z)of 6160 metabolites.Finally,the 4954 precursor ions acquired from plasma samples after deducting the blank using the full scan mode were further screened using E-MDF.A total of 3040 precursor ions were selected as the targeted precursor ions(Table S4).This model obviously reduced approximately 39% of the interfering ions.
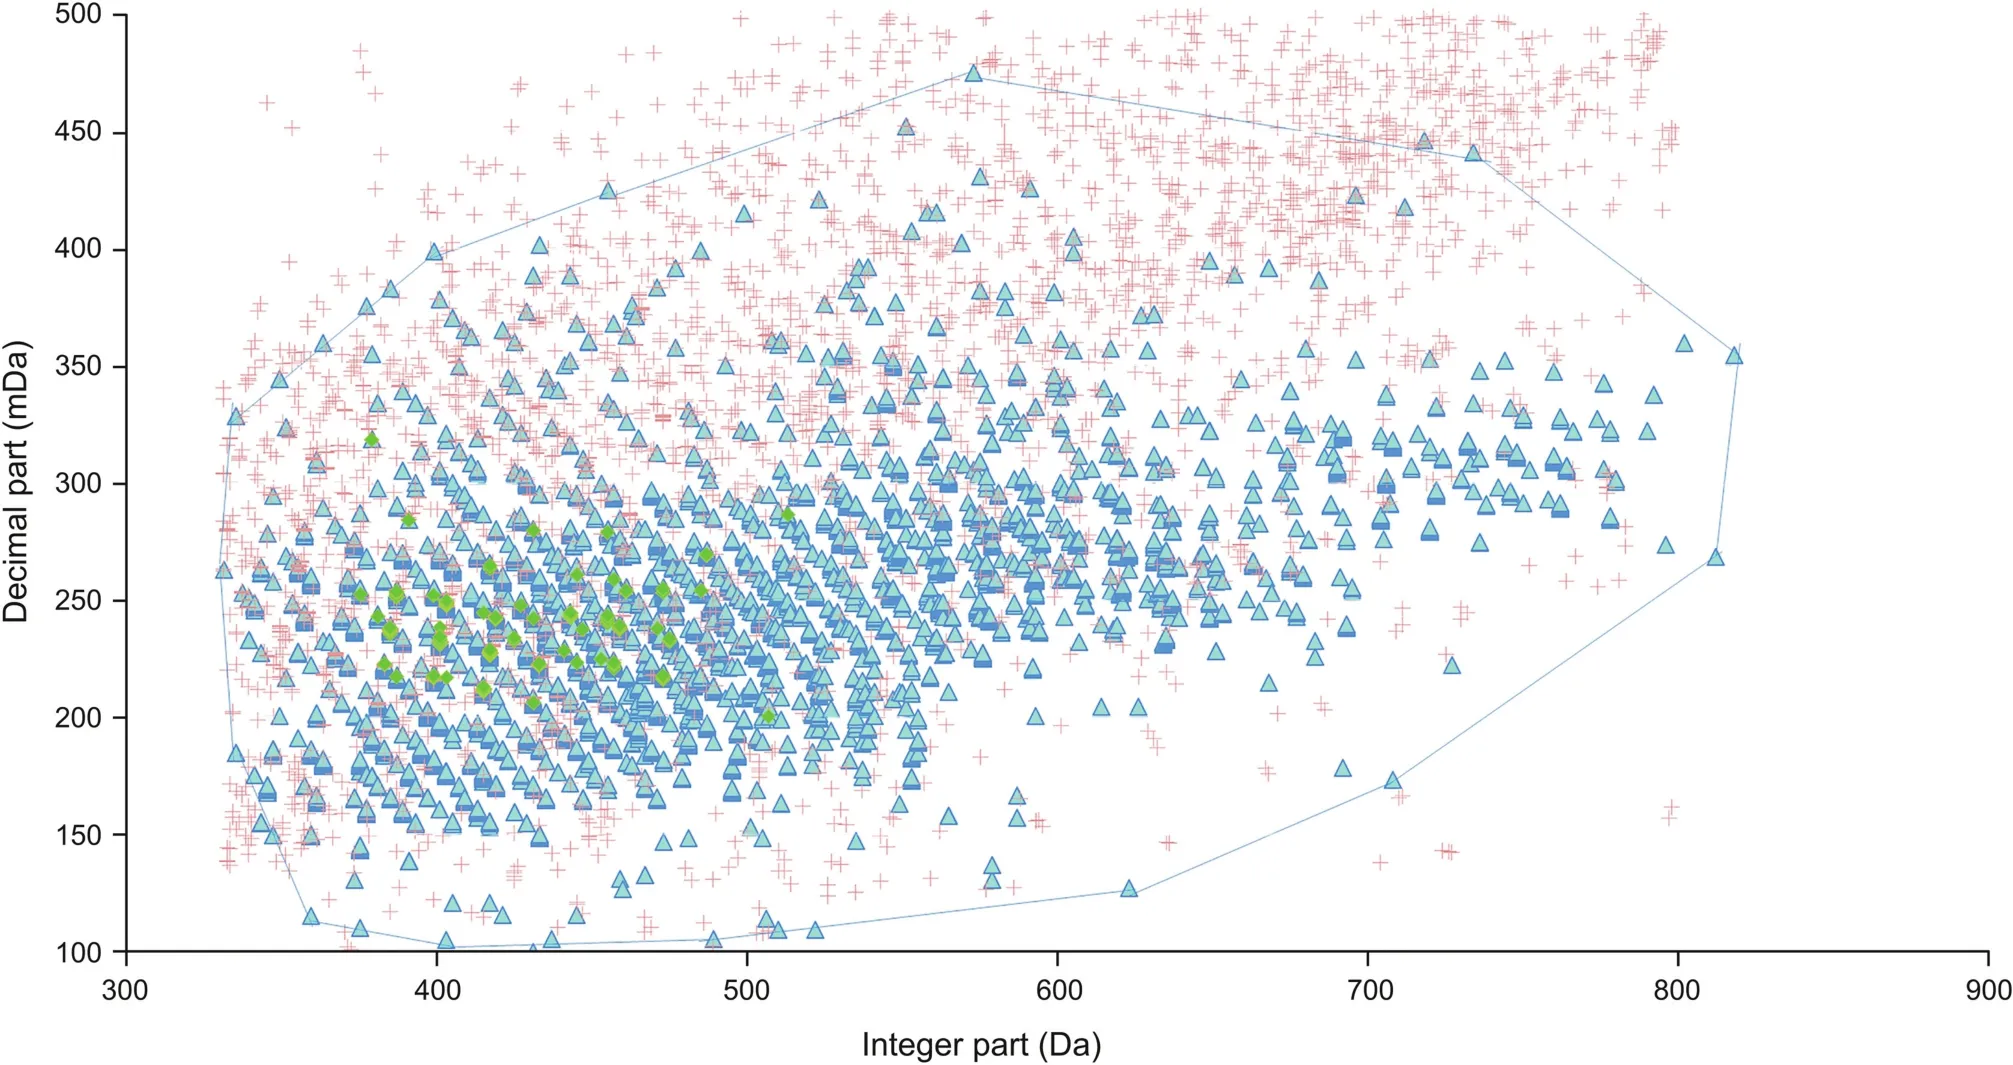
Fig.3.Extension-mass defect filter.Green,blue,and orange represent 140 prototype bufadienolides,6160 predicted metabolites,and mass-to-charge ratio(m/z)acquired in full scan model after blank deduction,respectively.
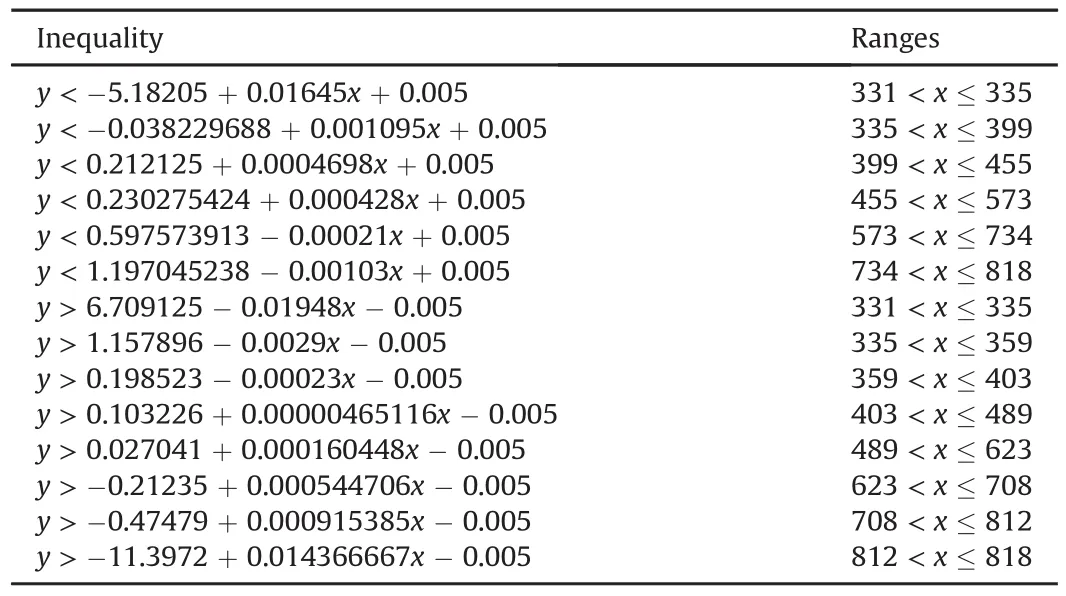
Table 1Inequality of extension-mass defect filter.
3.2.Optimization of multidimensional data acquisition
To trigger more MS/MS fragmentation of precursor ions,the different data acquisition modes were compared and evaluated,and the results are presented in Fig.4.As shown in Fig.4A,the mass segmentation acquisition mode indicated that the target precursor ion list was divided into 3-6 mass sections in the range of m/z 331-784,and the amount of precursor ions that triggered MS/MS fragmentation increased slightly.In Fig.4B,the target PIL was divided into three individual ion lists based on the staggered time points,which obviously improved the acquisition ability of MS/MS fragments.There were 671 precursor ions that triggered MS/MS fragmentation.To obtain additional MS/MS information,the mass segmentation acquisition mode and the time segmentation acquisition mode were combined,and as many as 1000 precursor ions were triggered MS/MS fragmentation.Considering the efficiency and capability,the mass range,which was divided into four sections,was selected as mass segmentation to combine with time segmentation.The results showed that the multidimensional data acquisition enhanced the acquisition capability by approximately four times than that of the regular DDA mode,and increased the single segmentation pattern by approximately1.5-3 times(Fig.4C).
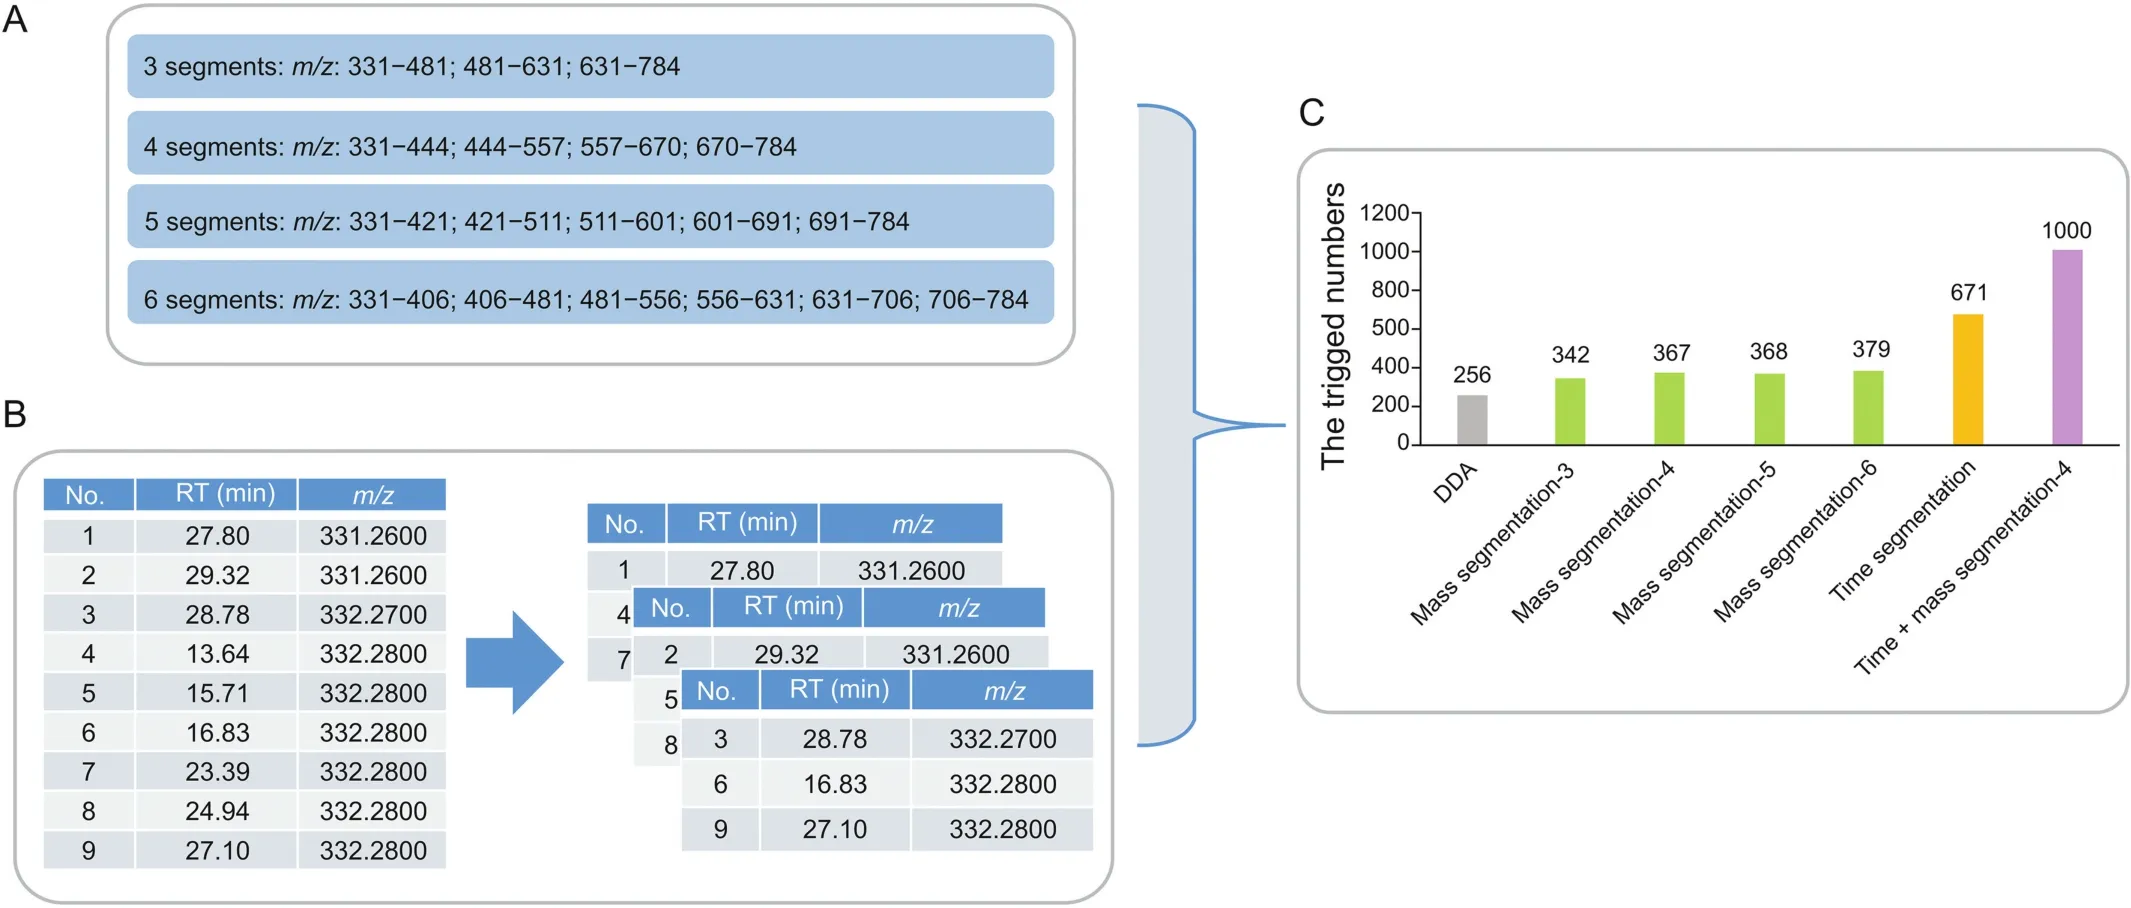
Fig.4.(A)Mass segmentation mode,(B)time segmentation mode,and(C)amount of triggered MS/MS fragmentation in different data acquisition modes.
3.3.Characterization of metabolites and metabolic pathways
All raw data were imported into the Compound Discoverer for characterization of the metabolites with metabolic network prediction.After merging the identified metabolites with the same retention time and deleting those with low FISh scores,147 components were identified,and the following 15 prototype bufadienolides:arenobufagin,bufalin,bufarenogin,cinobufagin,bufotalin,cinobufotalin,telocinobufagin,resibufogenin,cinobufaginol,desacetylbufotalin, desacetylcinobufagin, hellebrigenin, marinobufagin,resibufagin,and pseudobufarenogin were detected in the rat plasma(Table S5).Then,the metabolic pathways of the seven main bufadienolides were elucidated(Figs.S3-S9).Taking cinobufotalin as an example,deacetylation,isomerization,acetylation,and oxidation reactions occurred in the first step.The deacetylated cinobufotalin metabolite was further metabolized through isomerization,oxidation,hydrolysis,and reoxidation(Fig.S6).In summary,the main identified metabolic pathways of the bufadienolides were hydroxylation,dihydroxylation,and isomerization.
3.4.UHPLC-MS/MS method validation
Fig.S10 shows the specificity of the 14 bufadienolides and number(1-3)shows the 14 reference standards in the blank plasma samples with and without the standards at LLOQ concentration and plasma samples from rats intragastrically administered the crude VB extract.The results indicated that bufadienolides exhibited satisfactory specificity and no obvious endogenous interference or carryover effect at the retention time.The linear ranges of CS01,CS03,CS04,CS17,CS30,and CS36 were from 2.0 to 200 ng/mL and those of CS11,CS14,CS15,CS16,CS19,CS21,CS22,and CS23 were 1.0-200 ng/mL,indicating that they possessed good linearity(correlation coefficient,r>0.995,Table 2).The results of the stability,precision,accuracy,recovery,and matrix effect analyses of the bufadienolides,which are shown in Tables S6-S8,respectively,were acceptable.The dilution effect of CS03 was evaluated because its concentration in the plasma was over the linearity range,and no obvious dilution effect was observed(the value of dilution effect was 101.9%).
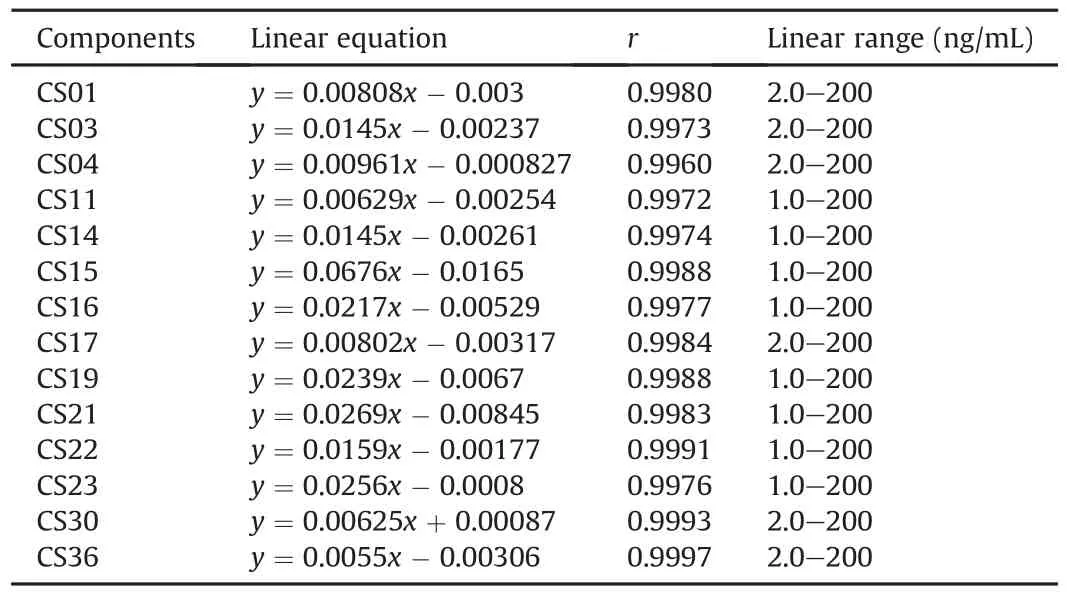
Table 2Linear equation and correlation coefficient(r)values of bufadienolides.
3.5.Metabolic profiles of VB
The MRM mode was used for the quantitative analysis,and the ion pairs of the 14 bufadienolides are listed in Table 3.Fig.5 shows the concentration-time curves of 10 bufadienolides and the pharmacokinetic parameters of the main bufadienolides,except for CS15,CS16,CS17,and CS19,are listed in Table 4.The results showed that the absorption and the elimination of CS21 and CS22 were rapid(time to reach the maximum concentration(tmax)was(0.396±0.292)h and(0.333±0.204)h;half-life(t1/2)values were(1.775±0.821)h and(1.195±0.477)h,respectively),and the result was consistent with that of previous studies[49].CS15,CS16,CS17,and CS19 were not detected in rat plasma samples over the sampling period(their concentrations were lower than that of the LLOQ).CS03 displayed the highest maximum concentration(Cmax;(466.5±116.920)ng/mL)and the highest area under curve from time 0 to t(AUC(0-t);(1487.316 ± 407.361)ng/mL·h)in rat plasma,probably because it was one of the main components of the bufadienolides and had the highest concentration in the crude extract.Moreover,CS30 showed the longest,t1/2of CS30 was(10.849±5.235)h,which might have a close relationship with the metabolism of CS30,which was one of the metabolites of CS23.In addition,almost all the main components of the bufadienolides reached their maximum concentrations in 1 h except for CS04,which had a tmaxof(1.438±0.657)h.
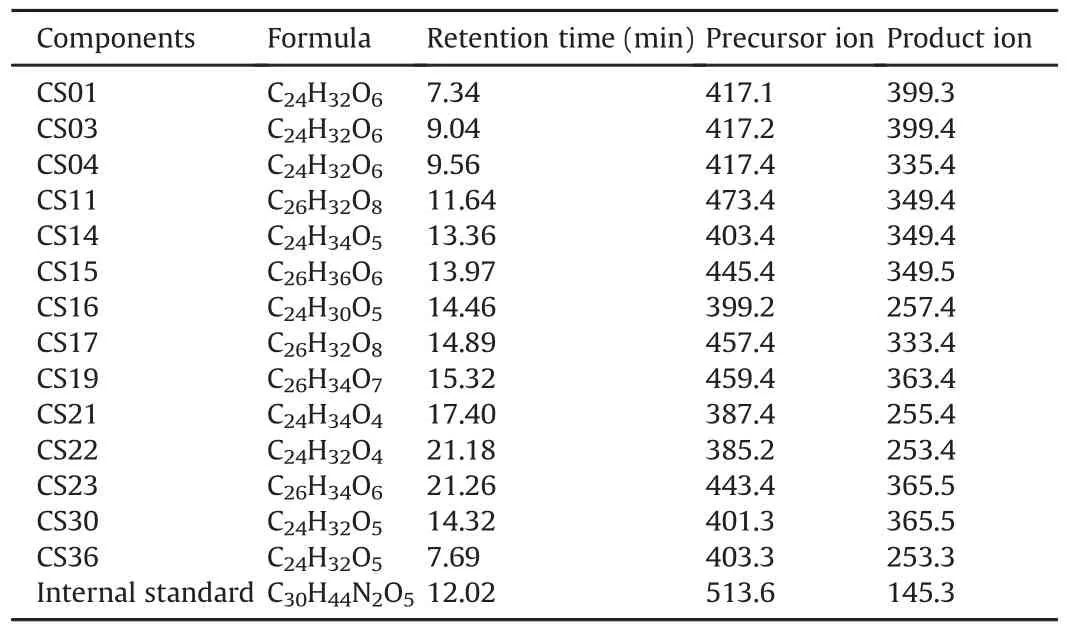
Table 3Ion pairs of main bufadienolides in multiple reaction monitoring modea.
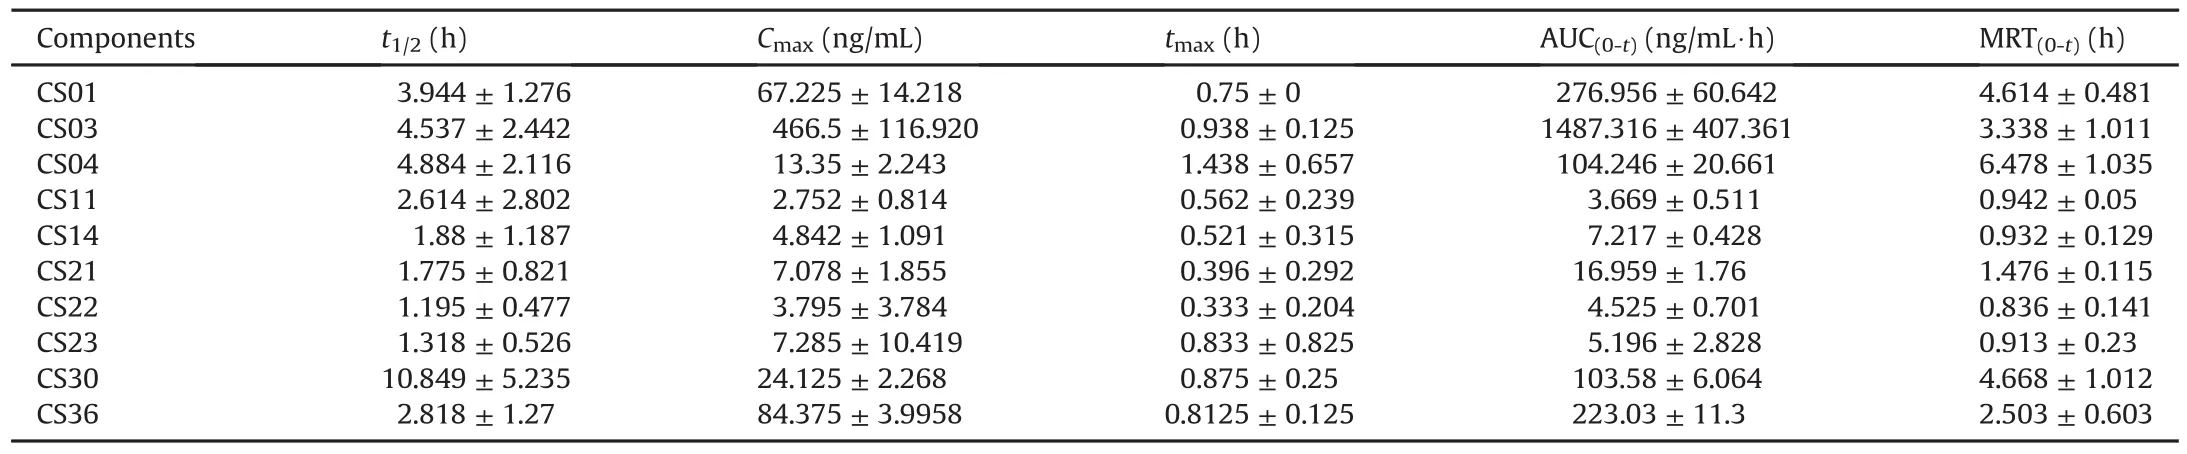
Table 4Pharmacokinetic parameters of 10 bufadienolides(n=4).
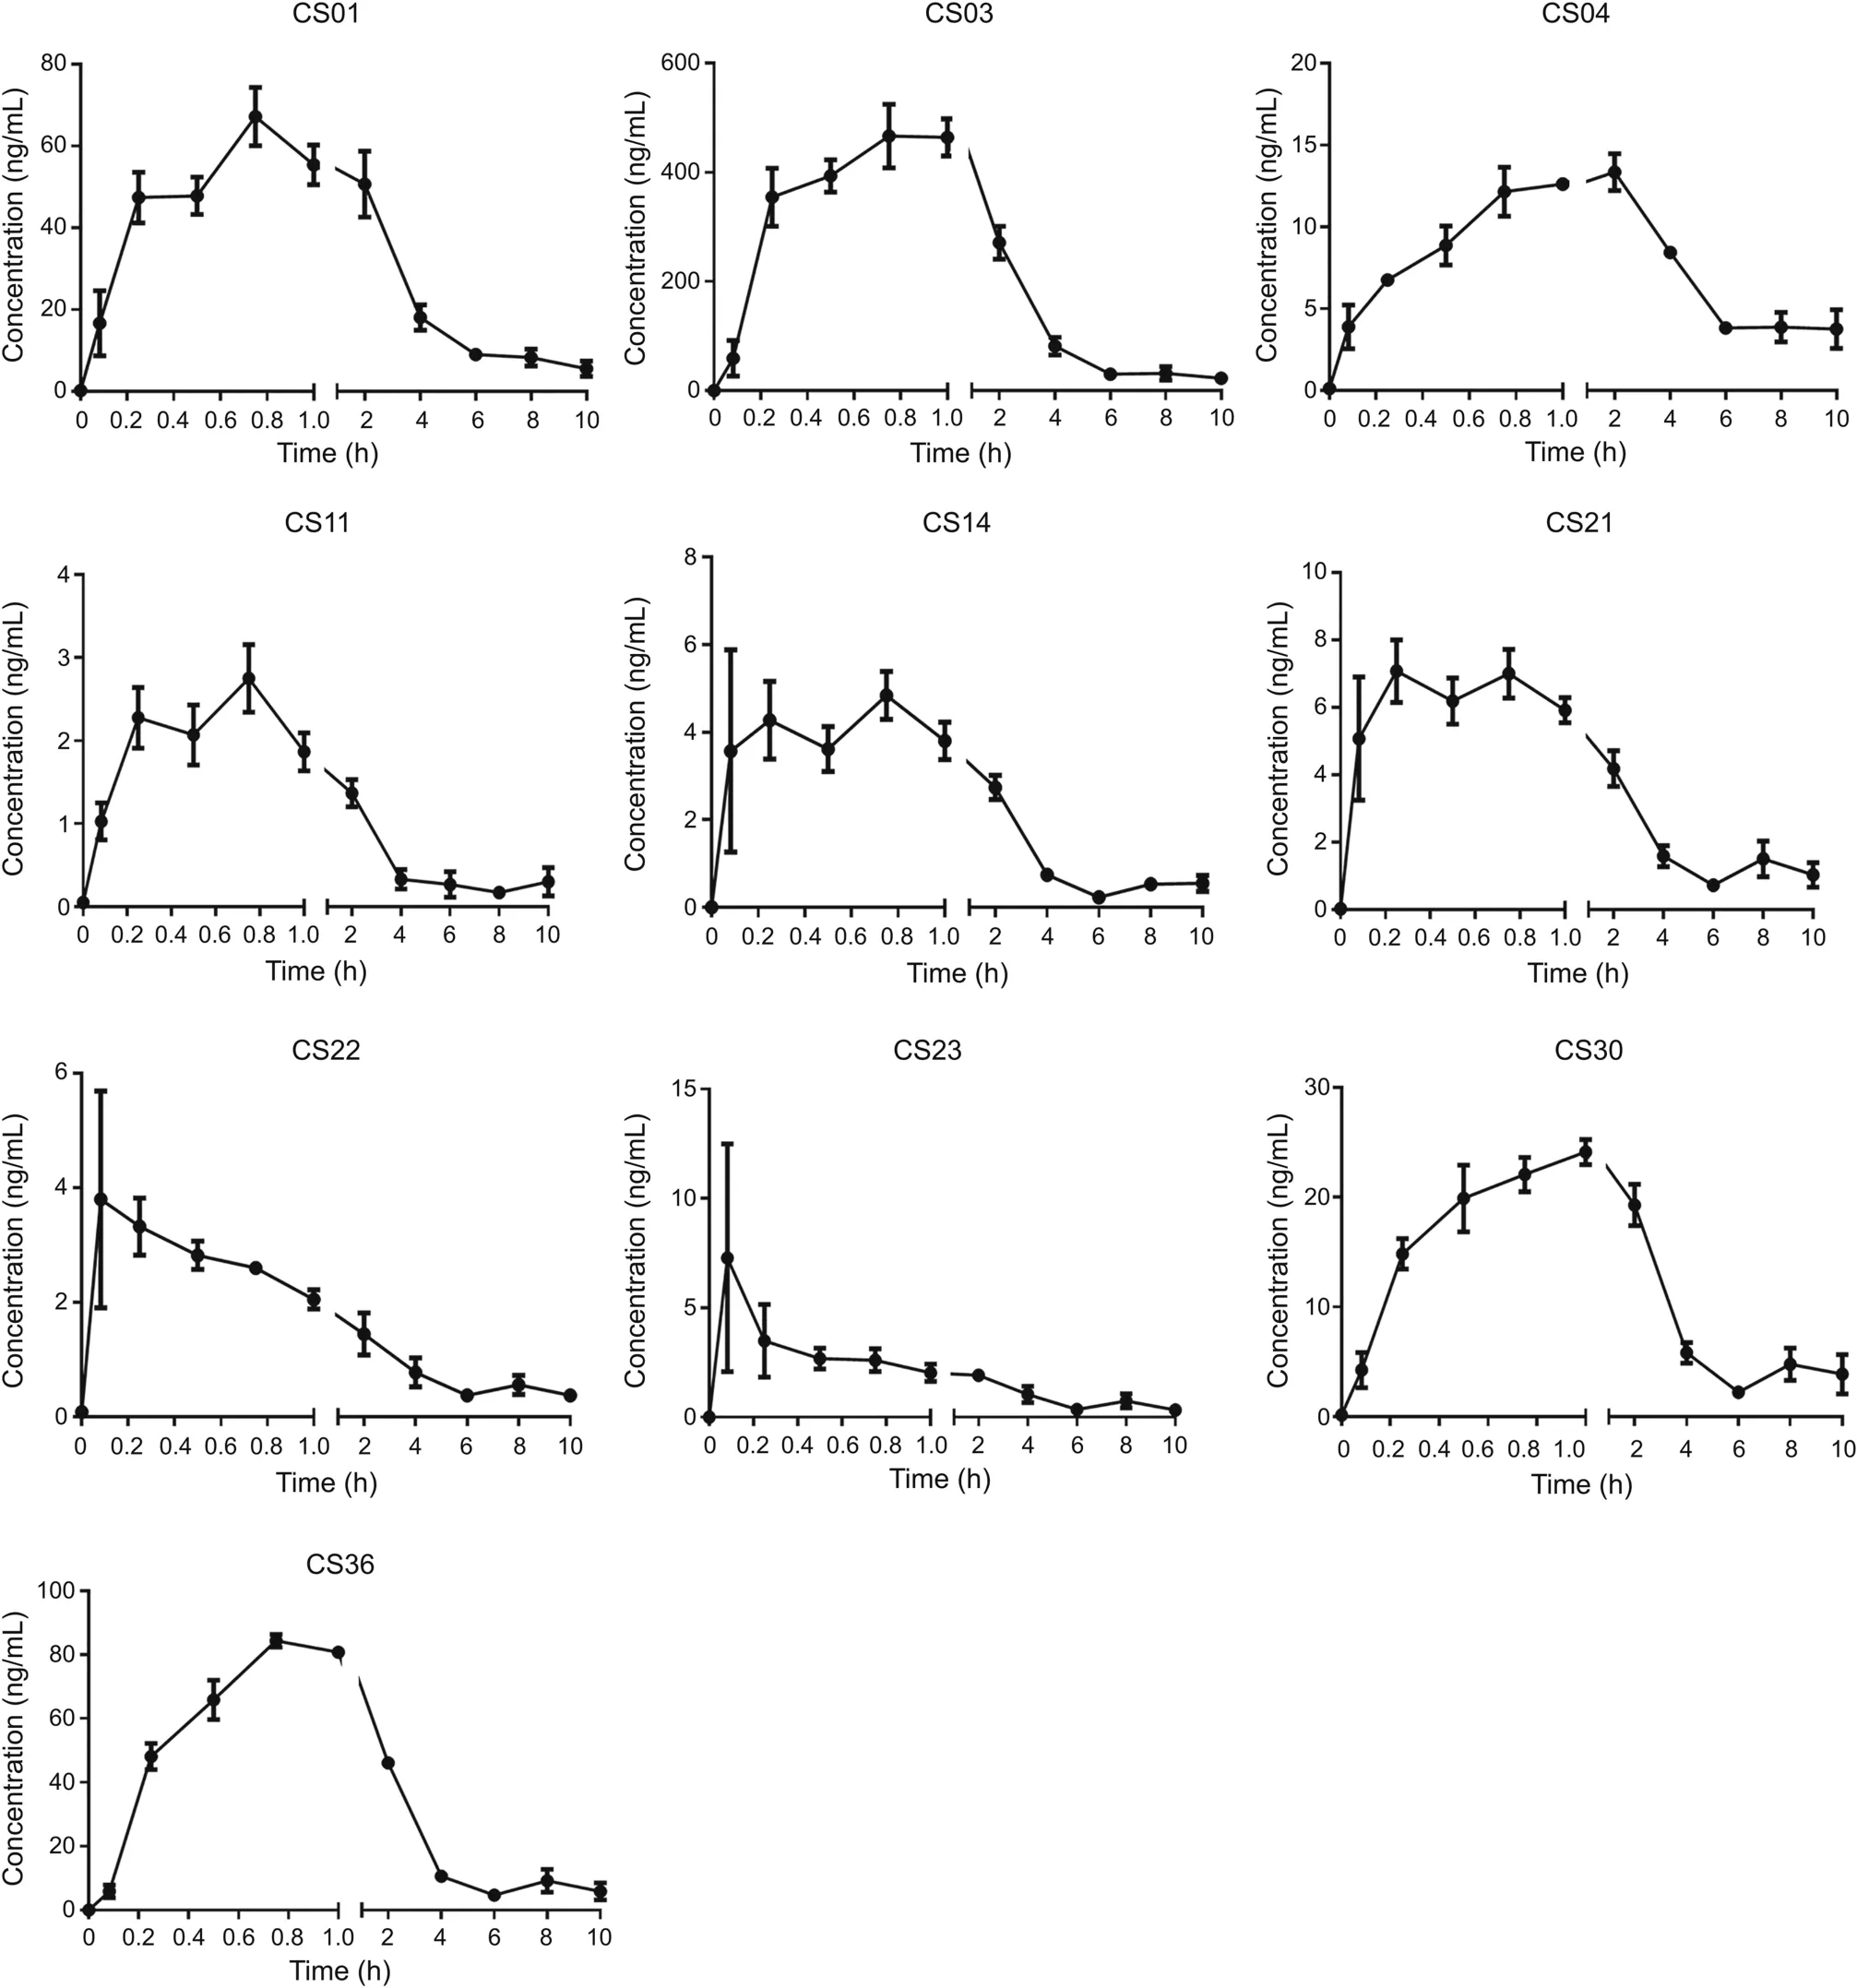
Fig.5.Concentration-time curves of 10 bufadienolides.
4.Conclusion
Elucidation of the metabolic profiles of TCM preparations could clarify the in vivo metabolism and provide significant data for their clinical application.To this end,an efficient strategy was developed to characterize the metabolites of VB and describe their metabolic profiles in vivo.The strategy is summarized into three primary points:1)E-MDF screening,multidimensional data acquisition,and metabolic network prediction were used to identify the metabolites in rat plasma.In total,147 metabolites were tentatively characterized,and the main metabolic pathways were hydroxylation,dihydroxylation,and isomerization.2)A method for the simultaneous quantitation of 14 prototype bufadienolides in vivo was established and validated.3)Concentration-time curves of 10 bufadienolides were constructed after intragastric administration of 200 mg/kg crude VB extract to rats.The results showed that CS03 exhibited the highest concentration in rat plasma and the elimination of bufadienolides was rapid.This strategy could be used to elucidate the dynamic change of VB in vivo and provide critical data for drug development and application.
CRediT author statement
Wen-Long Wei:Conceptualization,Methodology,Writing-Reviewing and Editing;Hao-Jv Li:Data curation,Visualization,Formal analysis,Writing-Original draft preparation;Wen-Zhi Yang:Conceptualization;Hua Qu:Supervision;Zhen-Wei Li:Validation,Formal analysis;Chang-Liang Yao:Resources,Writing-Reviewing and Editing;Jin-Jun Hou:Software,Data curation;Wan-Ying Wu:Project administration;De-An Guo:Funding acquisition.
Declaration of competing interest
The authors declare that there are no conflicts of interest.
Acknowledgments
This work was supported by the National Natural Science Foundation of China(Grant Nos.:81530095 and 81673591),Strategic Priority Research Program of the Chinese Academy of Sciences(Grant No.:XDA12020348),National Standardization of Traditional Chinese Medicine Project(Grant No.:ZYBZH-K-LN-01),and Science and Technology Commission Foundation of Shanghai(Grant No.:15DZ0502800).
Appendix A.Supplementary data
Supplementary data to this article can be found online at https://doi.org/10.1016/j.jpha.2021.02.003.
 Journal of Pharmaceutical Analysis2022年1期
- Journal of Pharmaceutical Analysis的其它文章
- Time-course monitoring of in vitro biotransformation reaction via solid-phase microextraction-ambient mass spectrometry approaches
- Erythrocyte sphingolipid species as biomarkers of Alzheimer's disease
- Biological analysis of an innovative biodegradable antibiotic eluting bioactive glass/gypsum composite bone cement for treating experimental chronic MRSA osteomyelitis
- Global characterization of modifications to the charge isomers of IgG antibody
- Pharmacokinetics,distribution,and excretion of sodium oligomannate,a recently approved anti-Alzheimer's disease drug in China
- Deciphering bioactive compounds of complex natural products by tandem mass spectral molecular networking combined with an aggregation-induced emission based probe