
A comparative analysis of differentially expressed genes in rostral and caudal regions after spinal cord injury in rats
2022-03-09 07:33:38XueMinCaoShengLongLiYuQiCaoYeHuaLvYaXianWangBinYuChunYao
中国神经再生研究(英文版) 2022年10期
Xue-Min Cao, Sheng-Long Li, Yu-Qi Cao, Ye-Hua Lv, Ya-Xian Wang, Bin Yu,Chun Yao
Abstract The initial mechanical damage of a spinal cord injury (SCI) triggers a progressive secondary injury cascade, which is a complicated process integrating multiple systems and cells. It is crucial to explore the molecular and biological process alterations that occur after SCI for therapy development. The differences between the rostral and caudal regions around an SCI lesion have received little attention. Here, we analyzed the differentially expressed genes between rostral and caudal sites after injury to determine the biological processes in these two segments after SCI. We identified a set of differentially expressed genes, including Col3a1, Col1a1, Dcn, Fn1, Kcnk3, and Nrg1, between rostral and caudal regions at different time points following SCI. Functional enrichment analysis indicated that these genes were involved in response to mechanical stimulus, blood vessel development, and brain development. We then chose Col3a1, Col1a1, Dcn,Fn1, Kcnk3, and Nrg1 for quantitative real-time PCR and Fn1 for immunostaining validation. Our results indicate alterations in different biological events enriched in the rostral and caudal lesion areas, providing new insights into the pathology of SCI.
Key Words: biological process; caudal; differentially expressed genes; Gene Ontology; hemisection; immunostaining; Rattus norvegicus; RNA-sequencing;rostral; spinal cord injury
Introduction
Traumatic spinal cord injury (SCI) affects million people worldwide each year, and it can lead to severe nerve dysfunction (Assinck et al., 2017). In the first 2 days (acute phase) after SCI, cell death, inflammatory cell infiltration and hemorrhaging occur. Astrogliosis, fibroblast infiltration, and axon degeneration happen later in the subacute phase (2-14 days). Finally, glial and fibrous scarring restricts axon regeneration and leads to neurological impairments (Ahuja and Fehlings, 2016). Traditional treatments, such as hemodynamic management and surgical decompression, affect neurological outcomes only when administered immediately after acute SCI and provide minor improvements (Squair et al., 2018). The complexity of the pathological mechanisms triggered by SCI contributes to the lack of effective SCI therapies(Telemacque et al., 2020; Zhang et al., 2021). Thus, it is pivotal to better understand the biochemical and cellular events that occur after SCI, which might facilitate the exploration of promising SCI therapies.
The development of transcriptome analysis using microarrays and highthroughput sequencing has provided tremendous information regarding the pathology of SCI from minutes after an injury to the late chronic stage. Using multiple bioinformatic methods, such as time-series expression analysis,differentially expressed gene clustering, or weighted gene coexpression network analysis, researchers have established gene modules corresponding to various pathological events and have identified a set of genes following SCI in mammals (Duan et al., 2015; Jeong et al., 2016; Fink et al., 2017; Squair et al., 2018; Yu et al., 2019).
In a previous study, spinal cord was completely transected at the T9 level with microscissors. Atrophic changes were observed in both the rostral and caudal spinal cord lesion area after SCI. However, the majority of the decreased area in the rostral spinal cord was observed in the white matter, whereas both white and gray matter were decreased in the caudal region, indicating a different injury impact between the rostral and caudal spinal cord (Yokota et al., 2019). However, the pathological and molecular differences between rostral and caudal regions relative to the lesion after SCI have received little attention. Previous studies reported that some proteins, such as glial cell line-derived neurotrophic factor (Zhou et al., 2008; Hara et al., 2012) and phosphorylated calcium/calmodulin-dependent protein kinase II alpha (Song et al., 2009), were expressed in the rostral and caudal regions at different time points and intensity after SCI. Additionally, a proteomic analysis showed that an inflammatory and neurotrophic response occurred regionally between the rostral and caudal segments after acute SCI (Cizkova et al., 2014). However,some studies suggested that the differences between the injury in the rostral and caudal regions were negligible (Duan et al., 2015).
In this study, a rat hemisection SCI model was used for its repeatability and because less loss of innervation can be compensated by sprouting of fibers from the intact side in this model than other models (Kjell and Olson, 2016).Our previous study suggested that the main pathological trends in the rostral and caudal regions were similar to a certain degree (Yu et al., 2019). Previously,we found differentially expressed genes (DEGs) in the rostral and caudal regions compared with a sham group at each time point. In this paper, we compared gene expression in the rostral and caudal regions, and identified DEGs between the rostral and caudal lesion regions up to 28 days after SCI. Using bioinformatic analysis and molecular validation, we sought to clarify the biological processes and critical genes affected in the rostral and caudal regions.
Materials and Methods
Animal surgery and tissue collection
Twenty-four 6-week-old female Sprague-Dawley rats weighing 200-250 g were anesthetized with an intraperitoneal injection of mixed narcotics (85 mg/kg chloral hydrate, 42 mg/kg magnesium sulfate, and 17 mg/kg sodium pentobarbital; Shanghai Lingfeng Chemical Reagent Co., Ltd, Shanghai, China)and underwent spinal cord T9 hemisection injury with a 15° ophthalmic iris knife on the right side of the spinal cord (Wu et al., 2019; Yu et al., 2019). The animals were kept in a heating blanket to maintain body temperature at 37°C during the surgery. After the surgery, animals were housed in cages at 37°C with five rats per cage on a 12-hour light-dark cycle with free access to food and water. The rats were euthanized and 5-mm-long segments rostral and caudal to the T9 injury site were collected at time points: 0 hours, 3 days, 7 days and 14 days after injury. The animal procedures were approved by the Administration Committee of Experimental Animals of Nantong University,Jiangsu Province, China, and were conducted in accordance with international laws and National Institutes of Health (NIH) policies, including the Care and Use of Laboratory Animals (NIH publication No. 85-23, 1985, revised 1996).This study is reported in accordance with the Animal Research: Reporting ofIn VivoExperiments 2.0 guidelines (Percie du Sert et al., 2020).
Differentially expressed gene identification
The RNA sequencing (RNA-Seq) data in the rostral and caudal groups at different time points after SCI (0 hours, 0.5 hours, 3 hours, 6 hours, 12 hours, 1 day, 3 days, 7 days, 14 days, 21 days, and 28 days after the injury)were collected in our previous study (Yu et al., 2019) and can be viewed and obtained in NODE (http://www.biosino.org/node; accession: OEP000369).Genes differentially expressed in the caudal group compared with rostral group at different time points were screened and identified with a DESeq package (Shanghai OE Biotech Co., Ltd, Shanghai, China). A negative binomial distribution test was used to test the significance of differences in gene reads number. Genes withP< 0.05 and fold change > 2 or fold change < 0.5 were considered differentially expressed.
Bioinformatic analysis
The enriched biological processes associated with downregulated or upregulated DEGs between the rostral and caudal groups at different time points after SCI were identified by gene ontology analysis (Azuaje et al., 2006)using DAVID bioinformatic resources (https://david.ncifcrf.gov/).
RNA isolation and quantitative reverse transcription-PCR
Total RNA was isolated from 5-mm-long segments of the rostral and caudal
regions at the indicated time points after SCI using Trizol Reagent (Thermo
Fisher Scientific, Waltham, MA, USA). Each time point had three rats in each
group. Reverse-transcribed cDNA was synthesized with the Prime-Script RT
reagent kit (TaKaRa, Dalian, China). Quantitative real-time PCR (qRT-PCR)
was performed with SYBR Premix Ex Taq (TaKaRa) on an ABI StepOne system
(Applied Biosystems, Foster City, CA, USA) in triplicate for each sample. The
relative expression level was normalized to GAPDH expression and calculated using the 2-ΔΔCtmethod (Livak and Schmittgen, 2001). The primers used were listed in Additional Table 1.
Immunohistochemistry
At 0 days, 3 days, and 7 days after spinal cord hemisection, rats were euthanized by an intraperitoneal injection of mixed narcotics and transcardially perfused with 4% paraformaldehyde. The spinal cord tissue around the lesion (10 mm long) was collected (n= 3 for each group). All tissues were transversely sectioned at 20 μm thickness. Sections were immunostained with anti-glial fibrillary acidic protein (GFAP), an astrocyte marker (1:40, chicken, Cat# ab4674, Abcam, Cambridge, USA) and antifibronectin (FN1) (1:400, rabbit, Cat# ab2413, Abcam) antibodies overnight at 4°C and incubated with the secondary antibodies: goat anti-chicken Alexa Fluor 488 (1:500, Cat# ab150173, Abcam) and donkey anti-rabbit Alexa Fluor 594 (1:500, Cat# ab150076, Abcam) at room temperature for 2 hours. Finally,the sections were observed under a fluorescence microscope (AxioImager M2, Zeiss, Oberkochen, Germany). Quantification of Fn1 immunostaining(mean integrated optical density, IOD) was performed using Image-Pro Plus 6.0 software (Media Cybernetics, Rockville, MD, USA).
Statistical analysis
All data were presented as the mean ± standard deviation. Statistical comparison was performed with one-way analysis of variance with Dunnett’s multiple comparisons test using GraphPad Prism 8 (GraphPad Software, San Diego, CA, USA).Pvalue < 0.05 was considered statistically significant. The correlation coefficients between qRT-PCR and RNA-Seq results were presented asR2(coefficient of determination), which were calculated using the Pearson correlation coefficient by Microsoft Excel (2019, Microsoft, Redmond, WA,USA). Biochemical and histological analyses were conducted by researchers blinded to treatment.
Results
Differentially expressed genes between rostral and caudal regions after SCI
In total, 5-mm-long segments in the regions rostral and caudal to the T9 injury site were collected at different time points for RNA-Seq (Figure 1A).We compared gene expression between the rostral and caudal groups.Genes with fold change (FC) < 1/2 (caudalversusrostral) were considered as downregulated in the caudal group whereas genes with an FC > 2 were considered as upregulated in the caudal group. There was a large number of DEGs (55 genes at 0 hours, 42 genes at 0.5 hours, 45 genes at 3 hours,34 genes at 6 hours, 26 genes at 12 hours, 50 genes at 1 day, 125 genes at 3 days, 176 genes at 7 days, 230 genes at 14 days, 99 genes at 21 days and 41 genes at 28 days) between the rostral and caudal groups at different time points after SCI, especially after 3 days (Figure 1B and Additional Table 2).
Biological processes enriched in the rostral and caudal regions
Gene ontology enrichment analysis was performed to identify key biological processes of the DEGs. Immediately after injury at 0.5 hours, downregulated DEGs (FC [caudalversusrostral] < 1/2, genes with high expression in the rostral region and low expression in the caudal region) were mainly enriched in immune response. At 1 day after SCI, DEGs were enriched in positive regulation of cell proliferation, which peaked at 3 days. This biological process continued until 14 days. After 3 days, response to mechanical stimulus, blood vessel development, and wound healing were enriched in the rostral region.During the later period (7-28 days) after SCI, biological processes were mainly enriched in cellular response to transforming growth factor-β (TGFβ) stimulus(Figure 2A and Additional Table 3). In the caudal region, immune response occurred at the early phase at 1 day after SCI. During the period from 3 days to 14 days, upregulated DEGs (FC [caudalversusrostral] > 2, genes with high expression in the caudal region and low expression in the rostral region) were enriched in potassium ion transmembrane transport and brain development.After 7 days, DEGs were enriched in biological processes including neuron fate commitment and spinal cord motor neuron cell fate specification in the caudal region compared with the rostral region (Figure 2B and Additional Table 4).
qRT-PCR validation of key DEGs between the rostral and caudal regions
We then tried to find key DEGs between the rostral and caudal lesion areas after SCI. Genes participating in multiple biological processes are listed in Table 1. Among them,Col3a1,Col1a1,Dcn,Fn1,Lox,Postn,Tnc,Isl2,Isl1,Kcnk3, andNrg1had significantly different FPKM expression between the rostral and caudal regions at certain time points according to the RNA-Seq data (Figure 3).Col3a1,Col1a1,Dcn,Fn1,Lox,Postn, andTncwere more highly expressed in the rostral group, whereasIsl2,Isl1,Kcnk3, andNrg1were highly expressed in the caudal group. We then performed qRT-PCR to validate the mRNA expression changes of these key DEGs with high FPKM expression (Figure 4).Col1a1,Col3a1,Dcn, andFn1indeed had an increased expression from 3 days to 14 days after SCI in the rostral region compared with that in the caudal region. And their expression increased with time after SCI. In contrast, expression ofKcnk3andNrg1were both decreased in the rostral region and caudal region after SCI. The results of qRT-PCR were mostly consistent with RNA-Seq data.
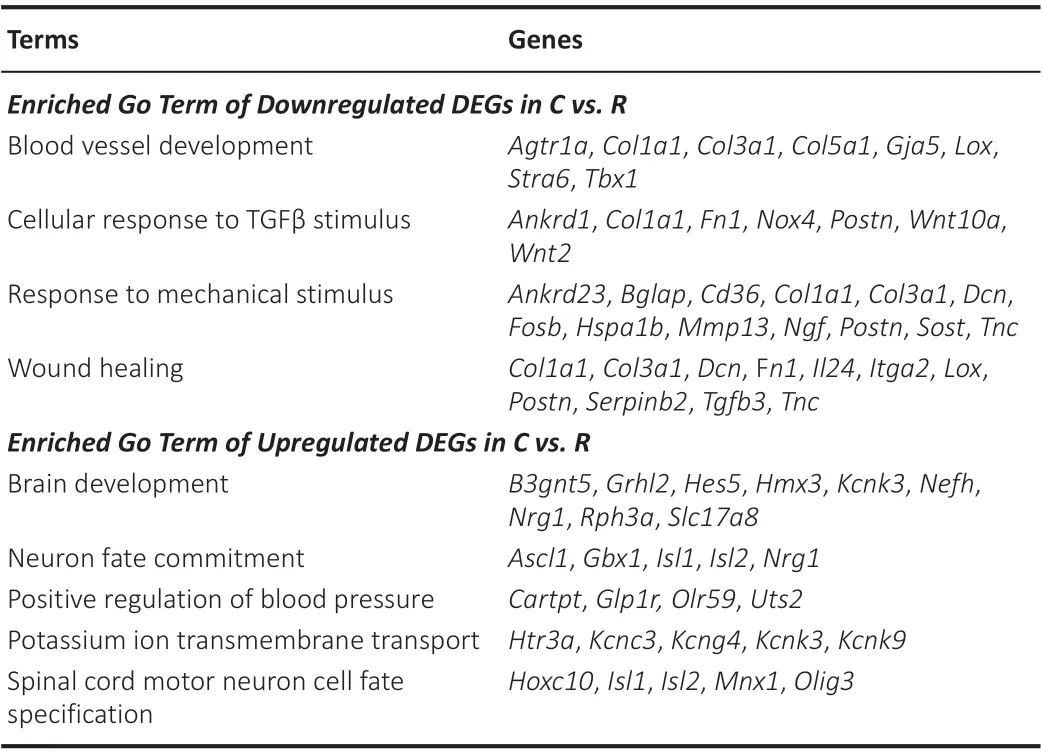
Table 1 |Enriched Go terms and genes
Fibronectin immunostaining
Using qRT-PCR we confirmed the upregulation ofCol1a1,Col3a1,DcnandFn1in the rostral region compared with the caudal region after SCI. Of those, the expression of Fn1 was increased from 3 days after SCI. Considering the pivotal role of fibronectin (FN1) in treatments for SCI (King et al., 2010; Haggerty et al., 2017), we then chose FN1 for immunostaining validation. Immunostaining assay was performed to detect FN1 expression at 0 days (uninjured), 3 days and 7 days after SCI. As shown in Figure 5, FN1 was rarely expressed in the uninjured sham group. However, elevated FN1 expression was induced around the lesion area at 3 days and 7 days after SCI. The immunostaining data were consistent with the RNA-Seq and qRT-PCR results that the Fn1 gene was highly expressed in the rostral region. In addition, we coimmunostained FN1 with GFAP, as it has been reported that FN1 enhances spinal cord astrocyte proliferation (Xia and Zhu, 2014). However, FN1 was mainly expressed in the lesion region and co-expressed slightly with GFAP staining after SCI (Figure 5).
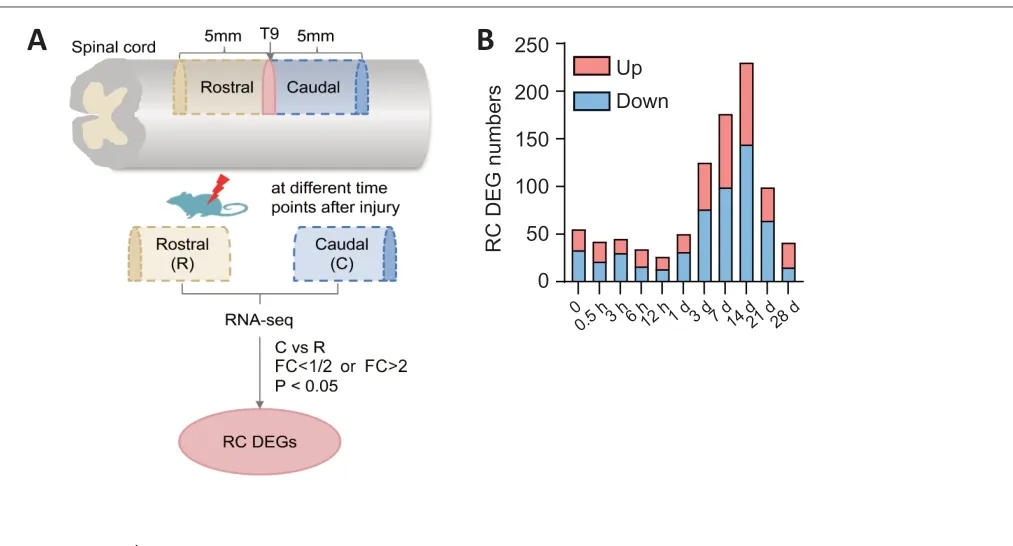
Figure 1 |Identification of differentially expressed genes (DEGs) between the rostral(R) and caudal (C) regions after SCI.(A) Schematic diagram of spinal cord hemisection, sample groups, RNA-Seq, and DEG identification. As shown in the graph, genes with fold change (FC) (C vs. R) < 1/2(downregulated DEGs) or > 2 (upregulated DEGs), and P < 0.05 were considered as DEGs between R and C. (B) The numbers of upregulated and downregulated DEGs between R and C sites at different time points after SCI. SCI: Spinal cord injury.
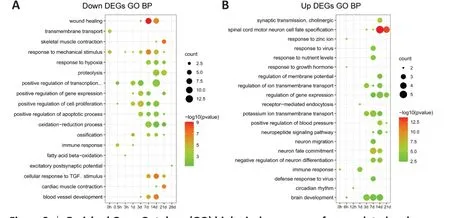
Figure 2 |Enriched Gene Ontology (GO) biological processes of upregulated and downregulated DEGs between the rostral (R) and caudal (C) regions at different time points following SCI.(A) Enriched GO biological processes (BP) terms of downregulated DEGs, which were upregulated in R relative to C with fold change (FC) (C vs. R) < 1/2. (B) Enriched GO BP terms of upregulated DEGs, which were upregulated in C relative to R with FC (C vs R) >2. The color represents -log10 (P-value) of each GO term. The circle size indicates gene numbers involved in each GO BP term.
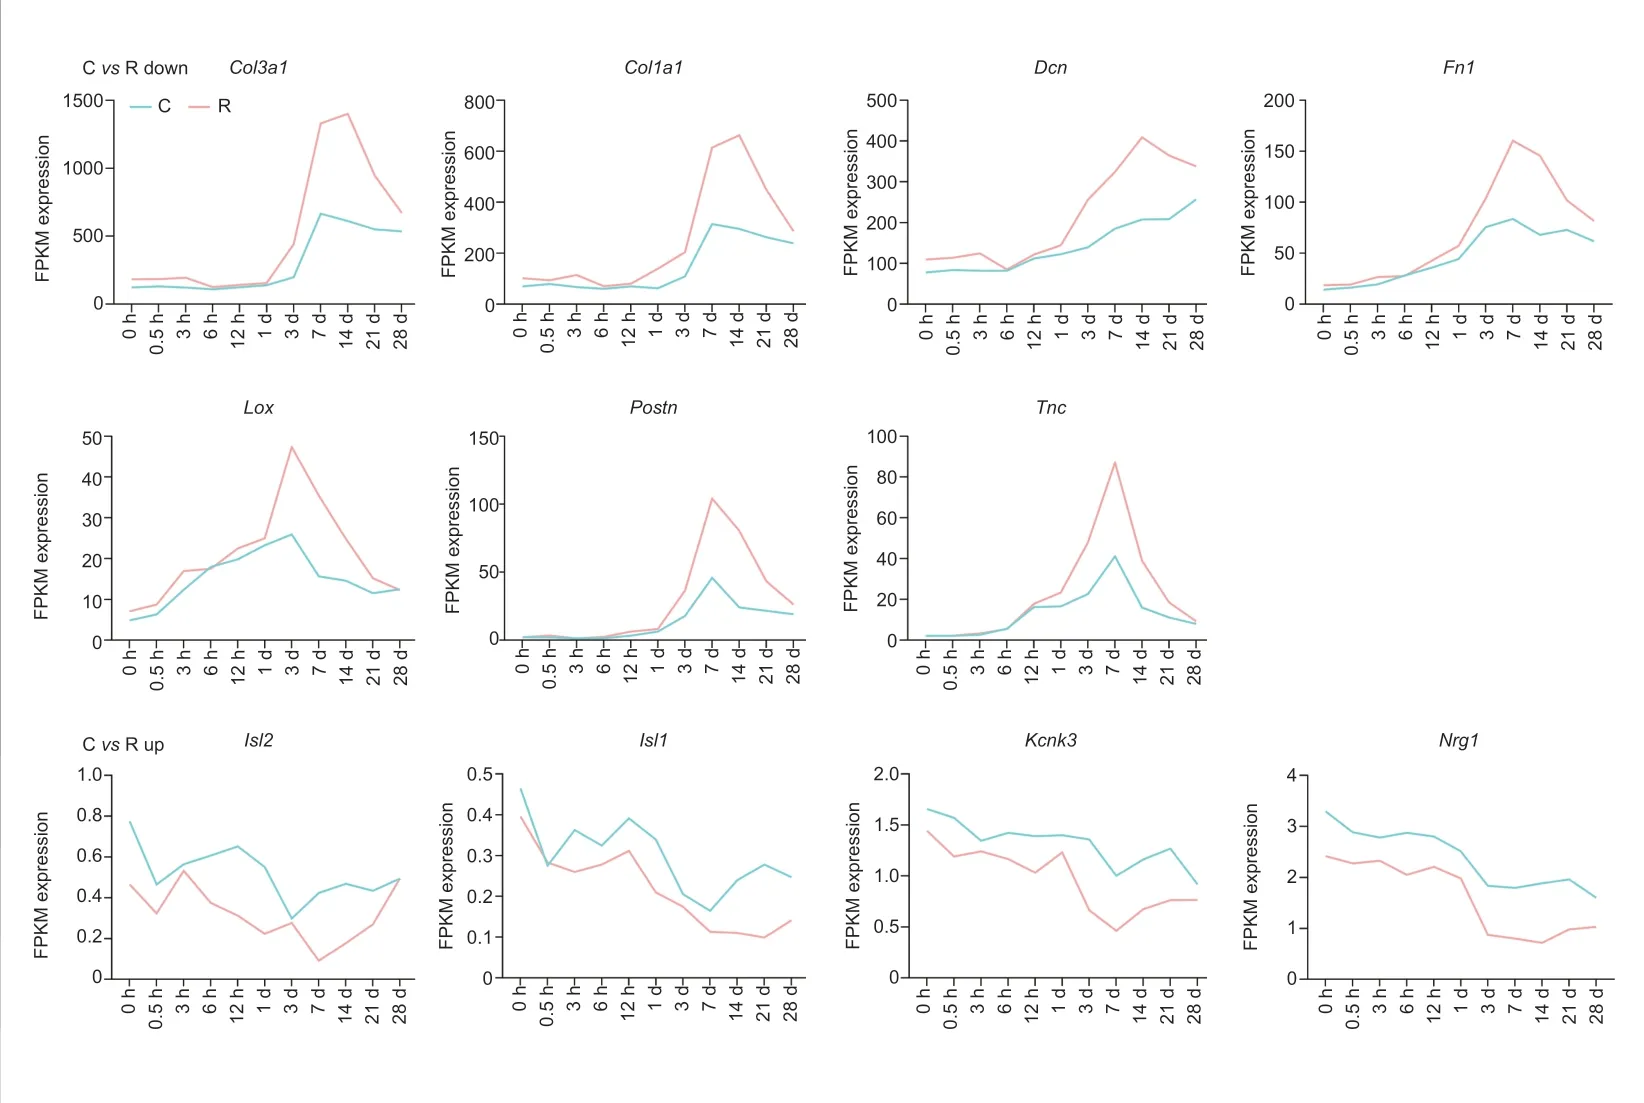
Figure 3 |FPKM expression of key genes in the rostral (R) and caudal (C)regions after SCI according to RNASeq data.The expressions of Col3a1, Col1a1,DCN, Fn1, Lox, Postn, and Tnc were upregulated after SCI and were lowlt expressed in the C group compared with the R group. Isl2, Isl1, Kcnk3, and Nrg1 were downregulated after SCI and were highly expressed in the C group compared with the R group. SCI: Spinal cord injury.
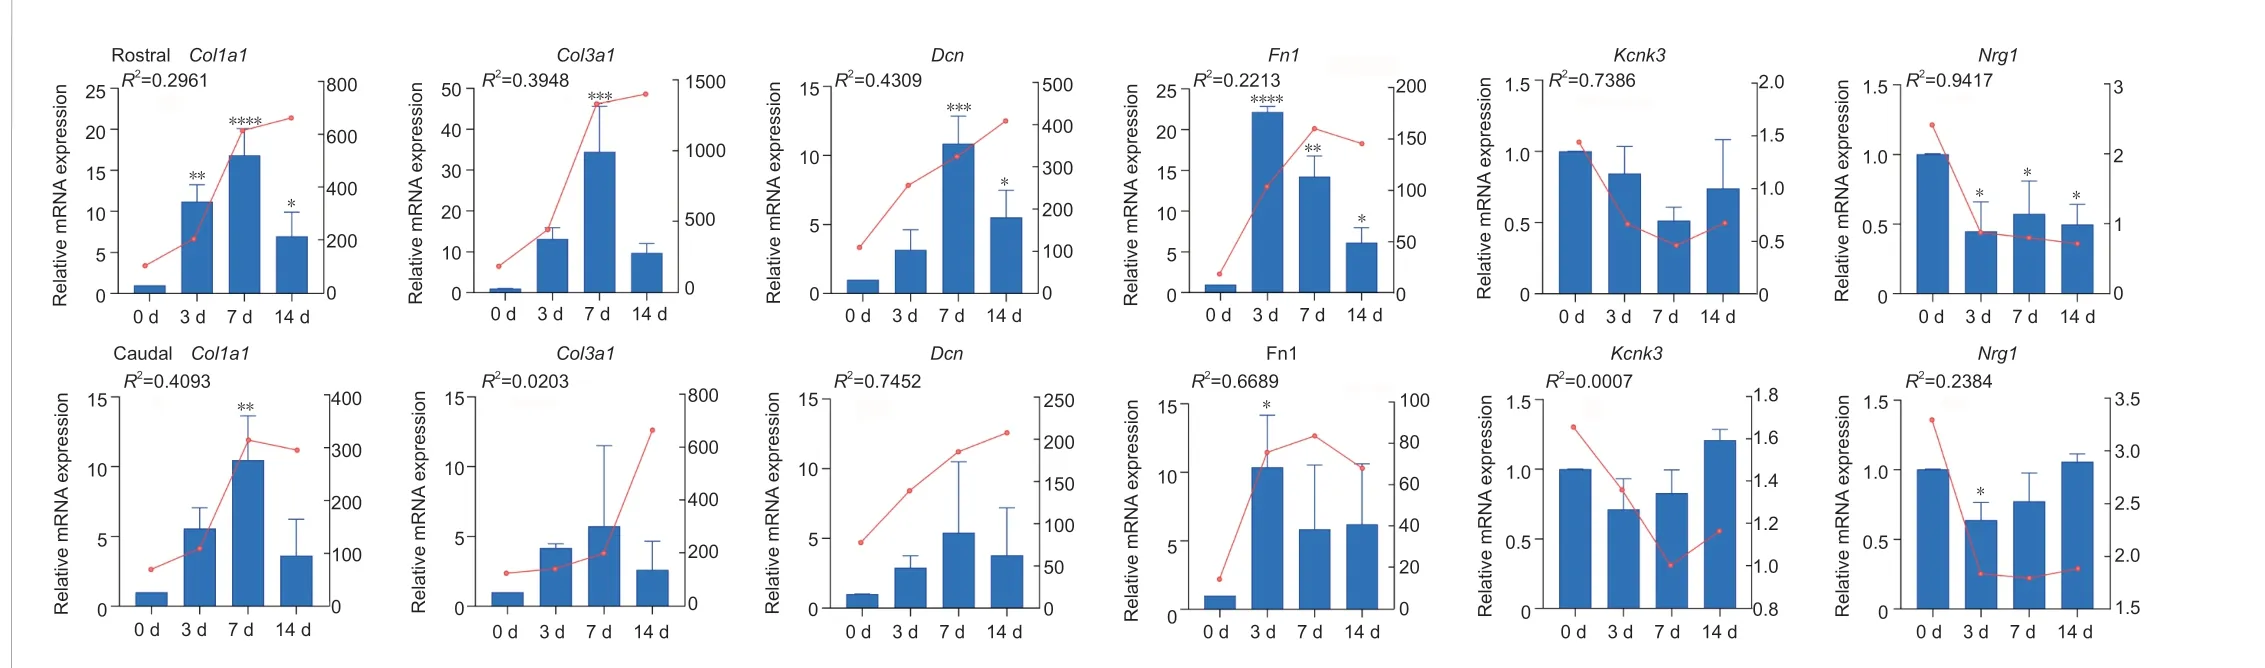
Figure 4 |qRT-PCR validation of selected genes in rostral (R) and caudal (C) regions after SCI.The blue bar shows the relative mRNA expression of genes at 0 days, 3 days, 7 days, and 14 days after SCI detected by qRT-PCR. The red line above the bar shows the FPKM expression trend of genes by RNA-Seq. n = 3 for each group. R2 represents the correlation coefficient between qRT-PCR validation and RNA-Seq data. *P < 0.05, **P < 0.01, ***P < 0.001, ****P <0.0001. qRT-PCR: Quantitative reverse transcription-PCR; SCI: spinal cord injury.
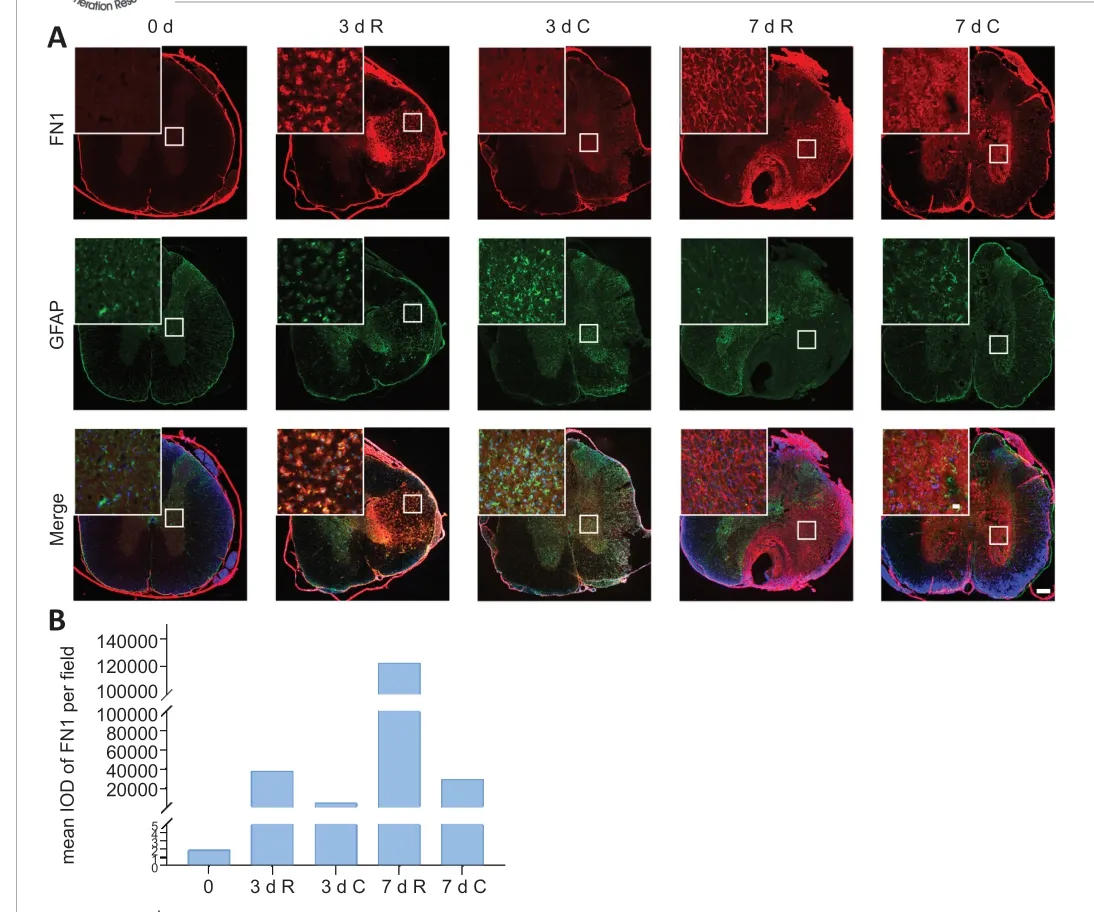
Figure 5 |Immunostaining of FN1 in the rostral (R) and caudal (C) regions around the SCI lesion.(A) Representative images of FN1 (red) and GFAP (green) immunostaining in the spinal cord cross-section at 0 days (uninjured), 3 days and 7 days after SCI. The fluorescence intensity showed the expression level of protein FN1 and GFAP. Spinal cords of uninjured,and R and C regions of 3 days and 7 days were displayed as 0 d, 3 d R, 3 d C, 7 d R and 7 d C,respectively. The nucleus was stained with DAPI (blue). Scale bar: 200 μm. Magnifications of the images in the white squares of the lesion area are shown in the upper left corner.Scale bars: 20 μm. (B) Quantitative result of FN1 (mean IOD). DAPI: 4′,6-Diamidino-2-phenylindole; FN1: fibronectin; GFAP: glial fibrillary acidic protein; IOD: integrated optical density; SCI: spinal cord injury.
Discussion
The differences in the biological processes enriched in the rostral and caudal lesion regions after SCI have not been well studied. In the present study, we identified key biological processes and genes in the rostral and caudal lesion areas (Figure 6). At 0.5 hours after SCI, events such as immune response predominated in the rostral region. Response to mechanical stimulus, blood vessel development, and wound healing then followed in the rostral region.Upregulated DEGs in the caudal region versus the rostral region were enriched in potassium ion transmembrane transport and brain development. DEGs were enriched in cellular response to TGFβ stimulus in the rostral region, especially at 14 days, whereas DEGs were enriched in neuron fate commitment and specification in the caudal region. DEGs enriched in blood vessel development were identified in the rostral region during 3-14 days after SCI, suggesting it is in the rostral region that angiogenesis first takes place. This is noteworthy because angiogenesis plays a critical biological role by providing nutritional support and oxygenation for growing tissue after injury (Ng et al., 2011).Furthermore, genes involved in neuron fate and synaptic transmission had more dominant roles in the caudal region compared with the rostral region during the late period, indicating that these processes satisfy the high demands for energy and ion homeostasis necessary for tissue regeneration (Cai et al., 2011). These results suggest that the rostral and caudal regions to the lesion may undergo different biological processes after SCI.
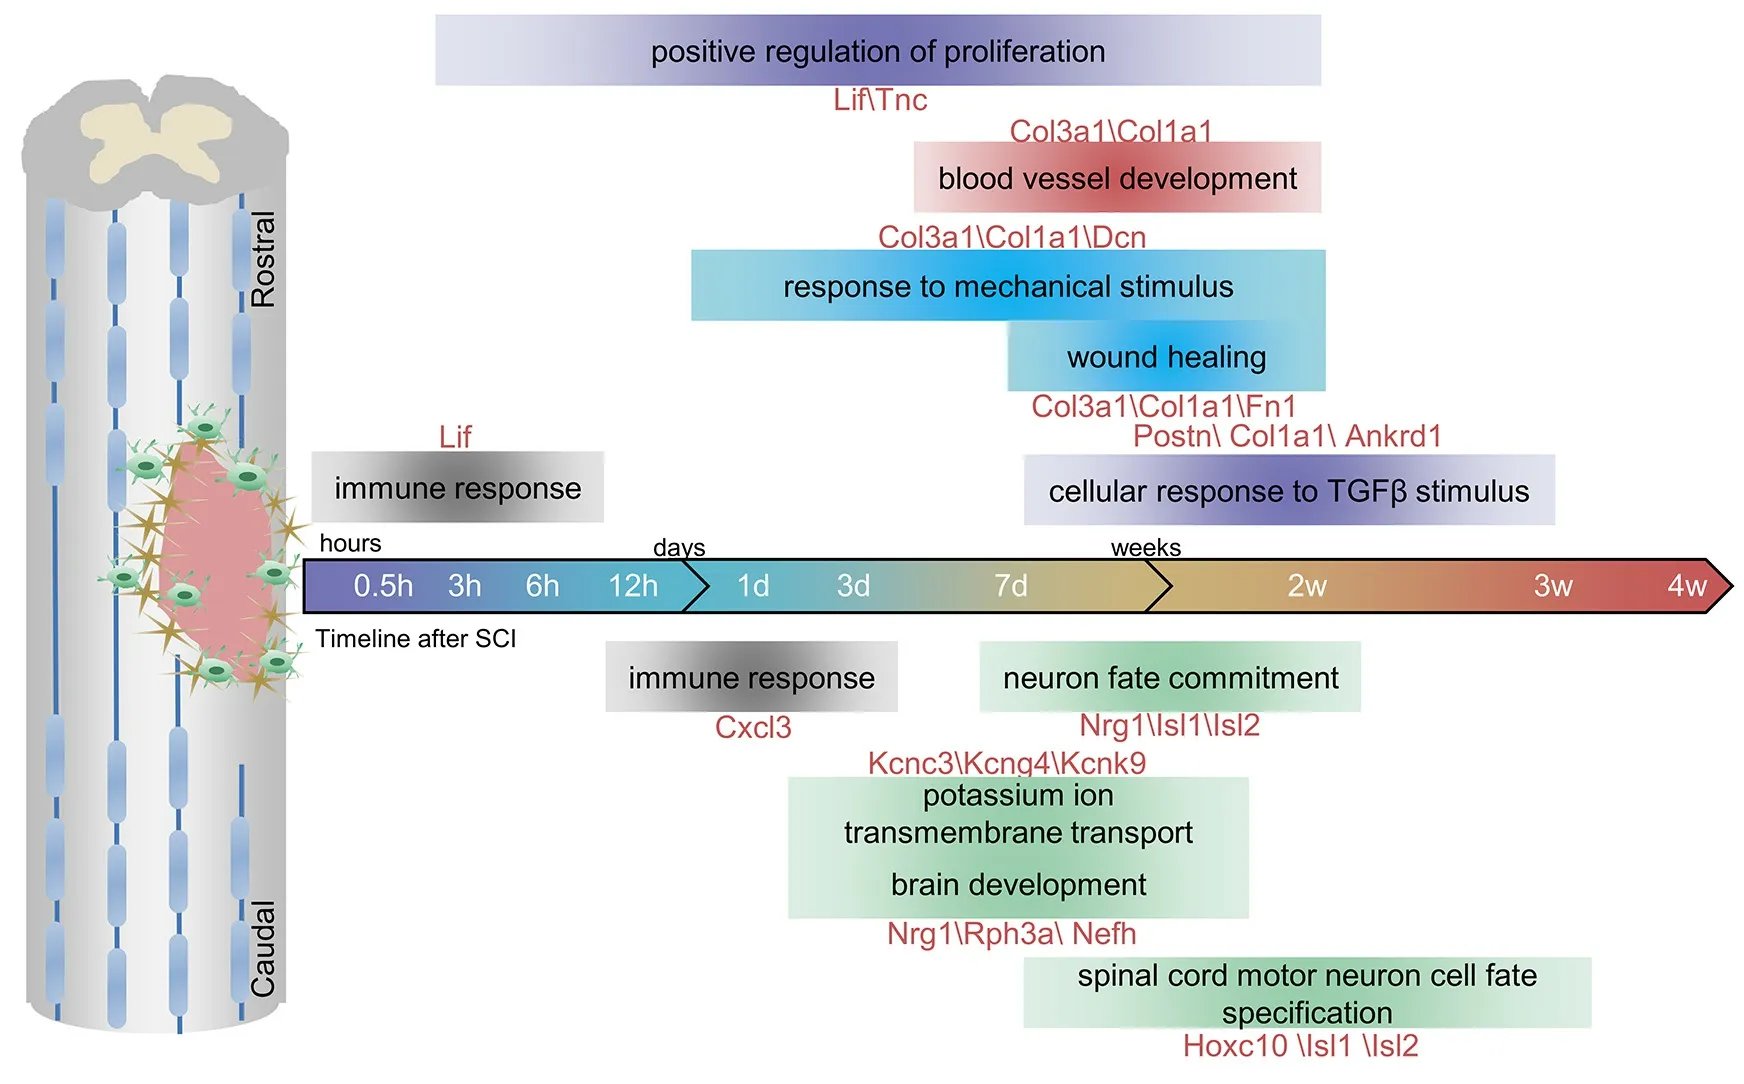
Figure 6 |Schematic of the major biological processes and genes in rostral (R) and caudal (C) regions at different time points after spinal cord injury.We identified key biological processes and genes in the R and C lesion areas. Blood vessel development, cellular response to transforming growth factor-β, response to mechanical stimulus, positive regulation of proliferation and wound healing were enriched in the rostral region. Brain development, neuron fate commitment, potassium ion transmembrane transport and spinal cord motor neuron cell fate specification were enriched in the caudal region. The genes shown below or above the biological processes were involved in the corresponding biological processes. The full names are shown in Additional Table 5.
We identified DEGs involved in multiple biological processes that differed between the rostral and caudal regions at certain time points.Col1a1andCol3a1encode type I and III collagen in connective tissues (Li et al., 2016). In addition,Col1a1andCol3a1are upregulated in cancers and are correlated with tumor progression and metastasis, suggesting the involvement of these two genes in cell proliferation, migration, and focal adhesion (Kuivaniemi and Tromp, 2019; Ma et al., 2019). Decorin (Dcn) plays a crucial role in the injured spinal cord by inhibiting scar formation and inflammation, promoting axon regrowth (Davies et al., 2004; Minor et al., 2008). Our results showed that these genes involved in wound healing and response to mechanical stimulus were mainly enriched in the rostral region of the injured spinal cord.Neuregulin-1 (Nrg1), a member of the neuregulin family, plays a predominant role in neural circuitry assembly, myelination, and synaptic plasticity in the central nervous system (Mei and Nave, 2014). Previous research demonstrated thatNrg1was dysregulated dramatically and permanently after SCI (Gauthier et al., 2013), which is consistent with our data.Kcnk3encodes potassium channel proteins and is also expressed in the central nervous system, including in motor neurons (Talley et al., 2001; Berg et al.,2004).Kcnk3is neuroprotective and plays a critical role in neurodegeneration and neuronal excitability (Ehling et al., 2015). We found that the expressions of DEGs that were upregulated in caudalversusrostral regions decreased with time after SCI both in the rostral and caudal regions. The decreased expression ofNrg1andKcnk3, which were enriched in neuron development and ion transport, in the rostral regionversusthe caudal region suggests that SCI-induced neuron dysfunction was severe in the rostral region.
Our results indicated thatFn1was also upregulated and highly expressed in the rostral region after SCI. FN1 is an extracellular matrix protein that has multiple effects on wound healing (Patten and Wang, 2021). On the one hand,FN1 is a growth permissive and neuroprotective substrate for nerve repair by promoting cell adhesion and sequestering nutrients and growth factors(Haggerty et al., 2017). FN1 administration can also decrease inflammatory cell invasion and blood-spinal cord barrier breakdown (Lin et al., 2012). On the other hand, the fibrotic scar formed by FN1 at the lesion area after SCI inhibits axon regeneration (Zhu et al., 2015; Cooper et al., 2018). Recently,researchers found that after SCI, a subset of microglia highly express FN1 to facilitate scar-free wound healing (Li et al., 2020). Loss of FN1 in microglia resulted in increased GFAP+astrocytes in the lesion site (Li et al., 2020).Consistently, our results showed that FN1 was rarely expressed in the GFAPpositive astrocytes after SCI.
Limitations
In this study, we performed qRT-PCR and immunostaining to validate the expression changes of DEGs. We did not conduct deep exploration on the function of these genesin vitroorin vivo. The differences in the enriched processes and specific genes between the rostral and caudal segments after SCI have not been fully explored in the present study.Recently, the development of single-cell sequencing has provided new insights for the investigation of the microenvironment after SCI, which we could adopt for exploration in the future (Sathyamurthy et al., 2018).In addition, multi-omics analyses integrating genomics, transcriptomics,proteomics, and metabolomics should be applied to explore the complicated microenvironment after SCI. In the future, we will perform additional experiments to detect the detailed functions of these DEGs in rostral and caudal regions in effort to develop new effective therapeutic targets for SCI.
Conclusion
In this study, we investigated the differences in biological processes and expression module of genes between the rostral and caudal regions after SCI in rats. Using bioinformatic analysis and molecular validation, we identified the main biological processes and key DEGs in the rostral and caudal regions.This study on the differences between the rostral and caudal regions would help to understand the recovery of spinal cord injury.
Author contributions:CY and BY conceived and designed the experiments.XMC, SLL, YQC, YHL and YXW performed the experiments. XMC and CY analyzed the data. CY and XMC wrote the paper. CY and BY revised the manuscript. All authors read and approved the final manuscript.Conflicts of interest:The authors declare no competing interests.Editor note: BY is an Editorial Board member of Neural Regeneration Research.He was blinded from reviewing or making decisions on the manuscript. The article was subject to the journal’s standard procedures, with peer review handled independently of this Editorial Board member and their research groups.
Availability of data and materials:All data generated or analyzed during this study are included in this published article and its supplementary information files.
Open access statement:This is an open access journal, andarticles are distributed under the terms of the Creative Commons AttributionNonCommercial-ShareAlike 4.0 License, which allows others to remix, tweak, and build upon the work non-commercially, as long as appropriate credit is given and the new creations are licensed under the identical terms.
Additional files:
Additional Table 1: qRT-PCR pimers of key differentially expressed genes between rostral and cadual regions after spinal cord injury.
Additional Table 2: Differentially expressed genes after spinal cord injury atdifferent time points between rostral and caudal groups.
Additional Table 3:Enriched GO terms of differentially expressed genes with fold change < 1/2, genes highly-expressed in the rostral region around SCI lesion.
Additional Table 4:Enriched GO terms of differentially expressed genes with fold change > 2, genes highly-expressed in the caudal region around SCI lesion.Additional Table 5:Abbreviations and full names of genes in Table 1 and Figure 6.

- 中国神经再生研究(英文版)的其它文章
- Complement activation kindles the transition of acute posttraumatic brain injury to a chronic inflammatory disease
- Role of adipose tissue grafting and adipose-derived stem cells in peripheral nerve surgery
- Potential significance of CX3CR1 dynamics in stress resilience against neuronal disorders
- Toxicities of amyloid-beta and tau protein are reciprocally enhanced in the Drosophila model
- The delivery of miR-21a-5p by extracellular vesicles induces microglial polarization via the STAT3 pathway following hypoxia-ischemia in neonatal mice
- Basic mechanisms of peripheral nerve injury and treatment via electrical stimulation