Modifying regeneration strategies classification to enhance the understanding of dominant species growth in fire-prone forest in Southwest China
Cifng Luo ,Yueqing Liu ,Zeho Shen ,Kng Yng ,Xinpei Wng ,Youxu Jing,c
aDepartment of Ecology,College of Urban and Environmental Science,The MOE Laboratory of Earth Surface Processes,Peking University,Beijing,100871,China
bYunnan Appraisal Center for Ecological and Environmental Engineering,Kunming 650228,China
cKey Laboratory of Forest Ecology and Environment of National Forestry and Grassland Administration,Research Institute of Forest Ecology,Environment and Protection,Chinese Academy of Forestry,Beijing,100091,China
Keywords:Post-fire regeneration strategies Species coexistence Growth priority Subtropical forest Facultative seeder Obligate resprouter
ABSTRACT Background: In fire-prone ecosystems,plant species having different post-fire regeneration strategies (PFRS)coexist at the local scale while showing different growth dynamics.To evaluate the effect of PFRS on species regeneration,we investigated the plant communities burned in different years in the central Yunnan Province,Southwest China.Several indicators describing plant growth and population importance were measured to compare the regeneration of four dominant tree species,including one facultative seeders(FS)and three obligate resprouters (OR).Partial correlation and mixed linear effect modeling were applied to disentangle the contribution of intrinsic and environmental factors to the interspecific variation in post-fire regeneration.Results:We identified two subtypes of plant growth strategy in the early post-fire stage for OR species;i.e.,number growth (OR+N) priority and height growth (OR+H) priority for sprouting stems.Generally,the FS and OR species varied in height growth rate with different temporal dynamics.The OR+N species occupied post-fire space horizontally with more resprouts and larger coverage than OR+H and FS species at the earlier stage.In contrast,the OR+H species generally had far less resprouts per clump,more variations in stem height and basal diameter.Factor analysis showed that the variation of post-fire plant regeneration was not effectively explained by environmental factors (R2 <20%);however,the linear mixed models with the modified PFRS as a random effect substantially increased the explanation.Conclusions: The differentiated regeneration dynamics and growth priorities in the four dominant tree species indicated a critical dichotomy of habitat occupation strategy for the resprouter species during the early stage of post-fire forest restoration.Our study uncovered a trade-off between height versus number growth priority in the post-fire tree growth strategy and provides a novel perspective in understanding the living space occupying(niche partitioning) process and species coexistence in post-fire forest community assembly.
1.Background
As an increasingly prominent feature of global climate changes,the extreme weathers have become more frequent and unpredictable,and caused record-breaking disasters in various regions,such as the catastrophic fire activities reported in Amazon basin,Australia and western of America in the recent years (Boer et al.,2020).According to the latest version of the Sixth Assessment Reports (AR6) of the Intergovernmental Panel on Climate Change(IPCC,AR6),fire weather(compound hot,dry and windy events)have become more probable and fire weather seasons will be lengthened and intensified in some regions with global warming (Seneviratne et al.,2021).Therefore,the sustainability of fire-prone ecosystems and their post-fire restoration have also raised growing concerns,along with the perspective of increasing fire threats.
Plant species of fire-prone ecosystem exhibit different regeneration strategies in responding to fire disturbance(Lamont and Markey,1995;Pausas et al.,2004;Keeley and Pausas,2011;Rogers et al.,2015;Zupo et al.,2020).Resprouting is considered to be an important trait of fire adaptation,particularly for lignotuberous plants (Canadell and Zedler,1995;Keeley et al.,2011;Pausas et al.,2018).Pausas et al.(2004)used the characteristics of resprouting and seed germination ability to propose a hierarchical classification of post-fire regeneration strategies(PFRS).In their study,the two regeneration syndromes (i.e.,seeding and resprouting) were combined to produce four PFRS:obligate resprouters (OR),obligate seeders (OS),facultative seeders (FS),and opportunists (OP).The FS were further classified into type I that recruits exclusively after fire and type II,which recruits after fire or during the fire-free period.The classification of PFRS has proved useful in the Mediterranean context,where the proportions of different PFRS are sensitive to different fire regimes and climates(Lamont and Markey,1995;Cowan,2010;Pausas and Keeley,2014;Rogers et al.,2015).The OR species are distributed widely and constitute more than 50%of the plant species in the area with frequent fires,such as the Mediterranean basin and California,whereas OS and FS species comprise more than 80% of the flora of Australia and South Africa (Cowan,2010).In the subtropical Southwest China,woody plant species in the semi-humid evergreen broadleaved forests were mostly (i.e.90.6%) comprise of resprouters (Su et al.,2015).
Numerous existing studies have also explored the variation in growth dynamics of different PFRS and their mechanistic links with physiological traits,particularly in the environments with periodic drought (Pausas and Keeley,2014;Vilagrosa et al.,2014;Wüest et al.,2016;Parra and Moreno,2017;Cooper et al.,2018).Resprouters have higher root-shoot starch allocation,and their non-structural carbon assimilation enables the species to easily grow faster (Falster and Westoby,2005;Dietze and Clark,2008;Pausas and Keeley,2014).However,resprouter species are observed to have lower growth rates,and divert resources toward building below-ground structures (Bond and Midgley,2003;Clarke and Knox,2009;Nzunda et al.,2014).In other cases,no difference was found between the growth rates of resprouting stems and seeding stems(Zammit and Westoby,1987;Knox and Clarke,2005).These inconsistent results imply the effects of different regeneration strategies on growth rate.Moreover,a wide variability in resprouting ability and growth performance has been found among resprouter species in response to fire,while not well reflected in the current typologies(Vivian et al.,2010).Thus studies have attempted to modify the framework of PFRS.Vesk (2006) considered the growth strategy of plants during the developmental stage in PFRS classification.Clarke et al.(2013) developed an approach for classifying resprouter species with regard to differences in bud origin and resource location.To evaluate the heat shock tolerance of dormant seeds,Zupo et al.(2020) divided seeds of resprouter species according to their tolerance,stimulation,and sensitivity to heat.
In the present study,we conducted a field investigation to measure the growth of tree species in forest communities that were burned at a series of time,and explored the post-fire growth dynamics of tree species with different PFRS.The studied forests are pervasively distributed in Southwest China,dominated by the mixed Yunnan pine -evergreen broadleaved forests,and intensively disturbed by a fire regime regulated by the subtropical monsoon climate(Tang et al.,2010;Han et al.,2015;Ying et al.,2018,2019).We tested the explanation of current PFRS framework in post-fire plant growth,and hypothesized that there is a dichotomy of regeneration strategies for OR species in the early post-fire forest restoration.With this differentiation we tried to improve the understanding of intrinsic and environmental factors in determining the post-fire regeneration and the partitioning of regeneration niche among resprouter species under the studied and similar environmental contexts.
Abbreviations
IPCC Intergovernmental Panel on Climate Change
AR6 the Sixth Assessment Reports
PFRS post-fire regeneration strategies
subPFRS subclassification of post-fire regeneration strategies
BPR buds-protection-resources framework
OR obligate resprouters
OR+N OR placed the priority on occupying more horizontal space by regenerating more sprouts
OR+H OR placed the priority on occupying more vertical space through more rapid stem height and diameter growth
OS obligate seeders
FS facultative seeders
OP opportunists
Envi environmental factors
TSF time since last fire
aspe slope aspects
posi topographic positions
elev elevation
slop slope
TN total nitrogen
IOC inorganic carbon
OC organic carbon
P available phosphorus
OC:N the ratio of organic carbon and total nitrogen
IV importance values
HGR height growth rate
BDGR basal diameter growth rate
BDmeanMean basal diameter
HmaxMaximum height of clump
Stems per clump Stems number of a clump
OLS the ordinary least squares
PCA principal component analysis
LMMs linear mixed-effect models
P.yunnanensis Pinus yunnanensisvar.Pygmaea
L.mairei Lithocarpus mairei
C.delavayi Cyclobalanopsis delavayi
L.villosa Lyonia villosa
2.Methods
2.1.Study sites and species selection
This study was conducted in Lufeng County (25°4′-25°10′N,102°12′-102°20′E) about 70 km west of Kunming,the capital city of Yunnan Province(Fig.1a).The regional climate is subtropical humid to semi-humid.According to the records of the nearest meteorological station (25°0′N,102°23′24′′E,1,888.1 m a.s.l),the mean annual temperature is 15.6°C,and the mean monthly temperature ranges from 7.3°C in January to 22.4°C in July.The annual mean precipitation is 912 mm,75% of which occurs in summer and autumn,as profoundly influenced by the Indian Ocean Monsoon(Han et al.,2015;Luo et al.,2021).The dominant vegetation type in this region is evergreen broadleaved forest and conifer forests dominated by Yunnan pine(Pinus yunnanensis).Accordingly,a warm and dry spring and early summer make the vegetation of this region vulnerable to ignitions caused mostly by intensive human activities,particularly those related to traditional agricultural practices and cultural activities during holidays and festivals (Su et al.,2015;Ying et al.,2018).The fire return interval of a natural secondary Yunnan pine forest is about 20-30 years;however,its historical fire frequency is not clear owing to the lack of ground records or fire scars on tree rings (Wu et al.,1987;Tang et al.,2010;Si,2019).Moreover,the spatial variability of fire severity is prominently shaped by topography(Han et al.,2015).
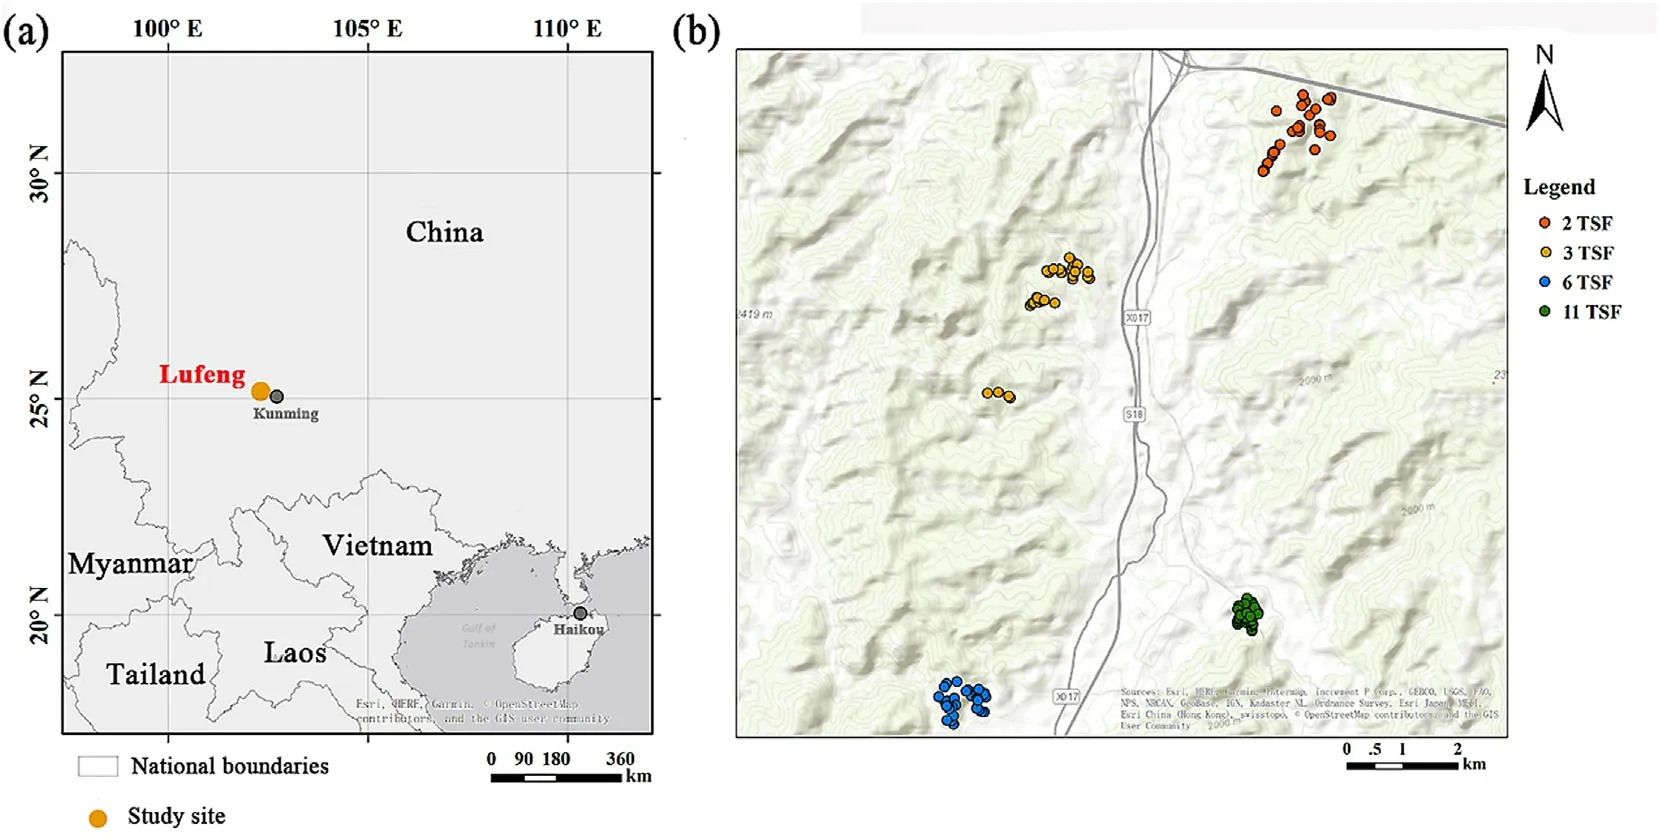
Fig.1.(a) Location of the study region showing the sampling site,and (b) an elevation map of the region showing the four sampling sites.
We studied the four dominant plant species of a fire-prone ecosystem in this region,as described below (Fig.1b).Pinus yunnanensisvar.Pygmaea(Pinaceae) grows as a shrub mainly in infertile soils and in areas frequently disturbed by fires.This species,which can both germinate from seeds and resprout from root crowns after fires,has a high proportion(74.7%)of serotinous cones(Su et al.,2015;Pausas et al.,2021).Lithocarpus mairei(Fagaceae)is an evergreen broadleaf tree species that produces abundant sprouts from shallow woody rhizomes after fires(Wang and He,1992).Cyclobalanopsis delavayi(Fagaceae),another evergreen broadleaf tree species,is one of the most common species dominating the forests of the study region.Lyonia villosa(Ericaceae)is a deciduous woody species that often dominates on sunny slopes.BothC.delavayiandL.villosacan resprout from basal burls after fires or clipping(Fig.2).
2.2.Sampling design
The field investigation was conducted in 2015 within various post-fire communities that were burned in 2005,2010,2013,or 2014 corresponding to 11,6,3,and 2 years since last fire(TSF),respectively,with the burned areas ranging from 235 to 1,240 ha (Luo et al.,2021).All four investigation sites were within a straight line distance of 7.5 km to each other.We used a stratified random sampling design to select 144 plots(10 m×10 m)on two slope aspects(aspe,including shady and sunny)at five topographic positions(posi,including valley bottom,lower slope,middle slope,upper slope,and summit) with four replicates on each specific sampling point.That is,the study included 4×[(2×4)+1]=36 plots in each of the four burned sites for a total of 144 plots.In addition,we recorded the elevation(elev)and slope(slop)of each plot using a portable Global Positioning System instrument and a compass.Surface soil samples were collected from each plot at depths of 0-10 cm below the litter layer.The pH value,total nitrogen (TN),inorganic carbon (IOC),and available phosphorus(P)of the soil were analyzed in the laboratory.The amount of organic carbon(OC)was determined by total carbon minus IOC.Details of the soil analysis are given in Luo et al.(2021).
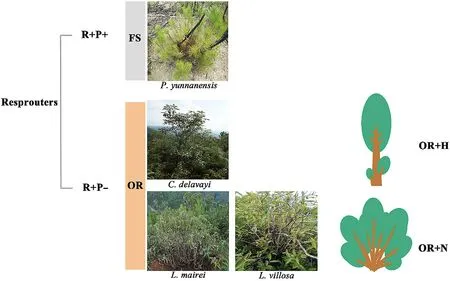
Fig.2.Photographs of the four studied woody species dominating the post-fire regeneration communities,including P.yunnanensis, L.mairei,L.villosa,and C.delavayi. Abbreviations are:R+,resprouters;P+,propagule persisters;P-,propagule non-persisters;FS,facultative seeders,OR,obligate seeders;OR+N,OR placed the priority on occupying more horizontal space by regenerating more sprouts;OR+H,OR placed the priority on occupying more vertical space through more rapid stem height and diameter growth.
We investigated the post-fire plant community in each plot,identified woody species richness,and calculated importance values(IV)of the four dominant species in the post-fire community.In particular,we measured the plant regeneration traits and growth status of the four dominant woody species.Regeneration traits were classified into resprouting and seeding types (Pausas and Keeley,2014).The plant growth measurements included height and basal diameter of each sapling/tree,number of clumps,number of resprouting stems in each clump,and species seedlings/resprouts ratio.In addition,we measured the perimeter and thickness to determine the size of the basal burl for each clump.
2.3.Data analysis
We calculated the IV of the four studied species in each sample plot(Curtis and Mcintosh,1951) as:

Moreover,we also calculated many growth variables for every clump.Hmaxis height of the tallest sprout stems,and BDmeanis the mean stem basal diameter of the clump.The height growth rate (HGR) was quantified asHmaxdivided by the TSF data,and the basal diameter growth rate(BDGR)was quantified as BDmeanalso divided by the TSF data.We then used the non-parametricWilcoxon rank sum testto determine the species differences as well as the temporal differences in plant growing states and IV in the post-fire community.Next,we applied the ordinary least squares (OLS) regression to examine the relationship of the sprout number and height with the burl size.Then we tested the correlation of the number and height of sprouts using partial correlation analysis by controlling environmental factors.Principal component analysis (PCA)was applied to determine the relationship among six variables of plant growth and IV (Table 1),using the“FactoMineR”and“factoextra”package(Sebastien et al.,2008;Alboukadel and Fabian,2020).Using the“lme4”package,we fitted linear mixed-effect models (LMMs) with species or PFRS as random factors (Douglas et al.,2015).The fixed factors including topographic(aspe,elev,posi,slop)and edaphic variables(pH,TN,P,OC,IOC,OC/N).The marginal and conditionalR2were used to indicate the variance accounted for by fixed factors alone and by fixed and random factors combined,to distinguish the effects of PFRS from that of the environment.

Table 1 Plant growth variables measured for sampling plots of post-fire regeneration.
All statistical analyses were conducted using R(R Development Core Team,2019),and its packages as mentioned.
3.Results
3.1.Species growth dynamics
3.1.1.Growth temporal dynamics
Among all sampling plots,speciesL.maireihad the most stem number per clump(65.1±18.9 stems/clump),the largest stem height(179.0±17.7 cm) and basal diameter (18.7 ± 2.0 cm) were observed forC.delavayi.In addition,P.yunnanensisandC.delavayihad obviously largerHmaxand BDmeanin the 6th or 11th year than the 2nd-3rd year after fires(Fig.3a,b).C.delavayishowed larger HGR and BDGR than theL.mairei,L.villosaandP.yunnanensis,especially at the early stages of post-fire regeneration (Fig.3c,d).The HGR and BDGR for theL.maireiandL.villosadecreased with an increase in the TSF,whereas the growth rates forP.yunnanensiswere stable through the study period.The stems per clump and IV in the community of theL.mairei,L.villosaandP.yunnanensiswere higher than those of theC.delavayi(Fig.3e,f).
3.1.2.Relationships among tree regeneration variables
The PCA1 and PCA2 axes loaded 55.7%and 23.5%of total variance in species growth,respectively (Fig.4).All six species performance variables were positively correlated with PCA1,but departed into two groups regarding their relationship with PCA2.Hmax,BDmean,HGR,and BDGR comprised a positively linked group,whereas IV and stem per clump comprised a group negatively linked with PCA2.As growth parameters,HGR and BDGR were closely correlated,and also positively linked withHmaxand BDmean,but were almost independent of stem number per clump.The four tree species revealed differentiated post-fire regeneration patterns,L.maireitended to have larger community IV,closely related with stems per clump.C.delavayishowed larger HGR and BDGR,whereasP.yunnanensisandL.villosashowed neutrality on both axes.
3.2.Post-fire regeneration and growth strategies
In the sampled post-fire plots across different topographical position and different time after fires (Fig.5),the populations ofL.mairei,L.villosa,andC.delavayiregenerated mostly by resprouting,which comprised 90.2%,95.6%,and 94.8% of the total post-fire regeneration for the three species,respectively.In contrast,the resprouts ofP.yunnanensiscomprised only 24.5%,with others contributed by seeding.This difference suggests that theP.yunnanensisis a FS species,and the other three are OR species.
The burl size correlated significantly with the number of stems per clump and maximal stem height for the three OR species (P<0.001;Fig.6b) and for each specific species (Fig.6c,d).Moreover,controlling the effects of environmental factors and burl size resulted in a negative relationship between the stem number per clump and the maximal stem height,the partial correlation coefficientr=-0.261(P<0.001,Fig.6a).The stem number per clump was positively correlated with the burl size(P<0.001),and the slope was 0.27,0.19,0.07 forL.villosa,L.maireiandC.delavayi,respectively.Less effect of burl size on the maximal stem height was noted forL.mairei(R2=0.124)andC.delavayi(R2=0.046),but a significant effect on maximal stem height was observed inL.villosa(slope=1.26,R2=0.252;Fig.6d).At a given value of burl size,C.delavayiclumps had the lowest stem numbers and the highest stem,compared withL.villosaandL.mairei.
Therefore,the OR species differentiated in their grow priority of regeneration and had different growth strategies.One subtype is the OR+N which placed the priority on occupying more horizontal space by regenerating more sprouts,such asL.villosaandL.mairei;alternatively,the OR+H type placed the priority on occupying more vertical space through more rapid stem height and diameter growth,such asC.delavayi.In addition,different height strategies appeared difference in variation and range of stem height and basal diameter in each clump(Fig.7).OR+H speciesC.delavayihad bigger range of height and basal diameter and showed higher variations,whereas the other two OR+N species exhibited more even and stable than OR+H species in different stems of a clump(P<0.001).
3.3.Contributions of environment and PFRS to post-fire plant growth
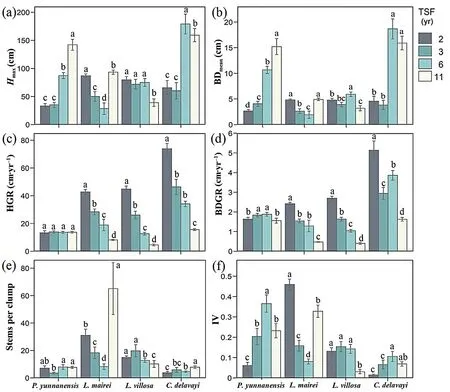
Fig.3.Growth dynamics of the four dominant species based on different regeneration indices:(a)Hmax,(b)BDmean,(c)HGR,(d)BDGR,(e)stems per clump,and(f)IV.The error bar indicates standard error.Different letters above the error bars denote statistical differences of multiple comparisons.Multiple comparisons were corrected using the Wilcoxon rank sum test and tested for significance at the 95% confidence level (α=0.05).
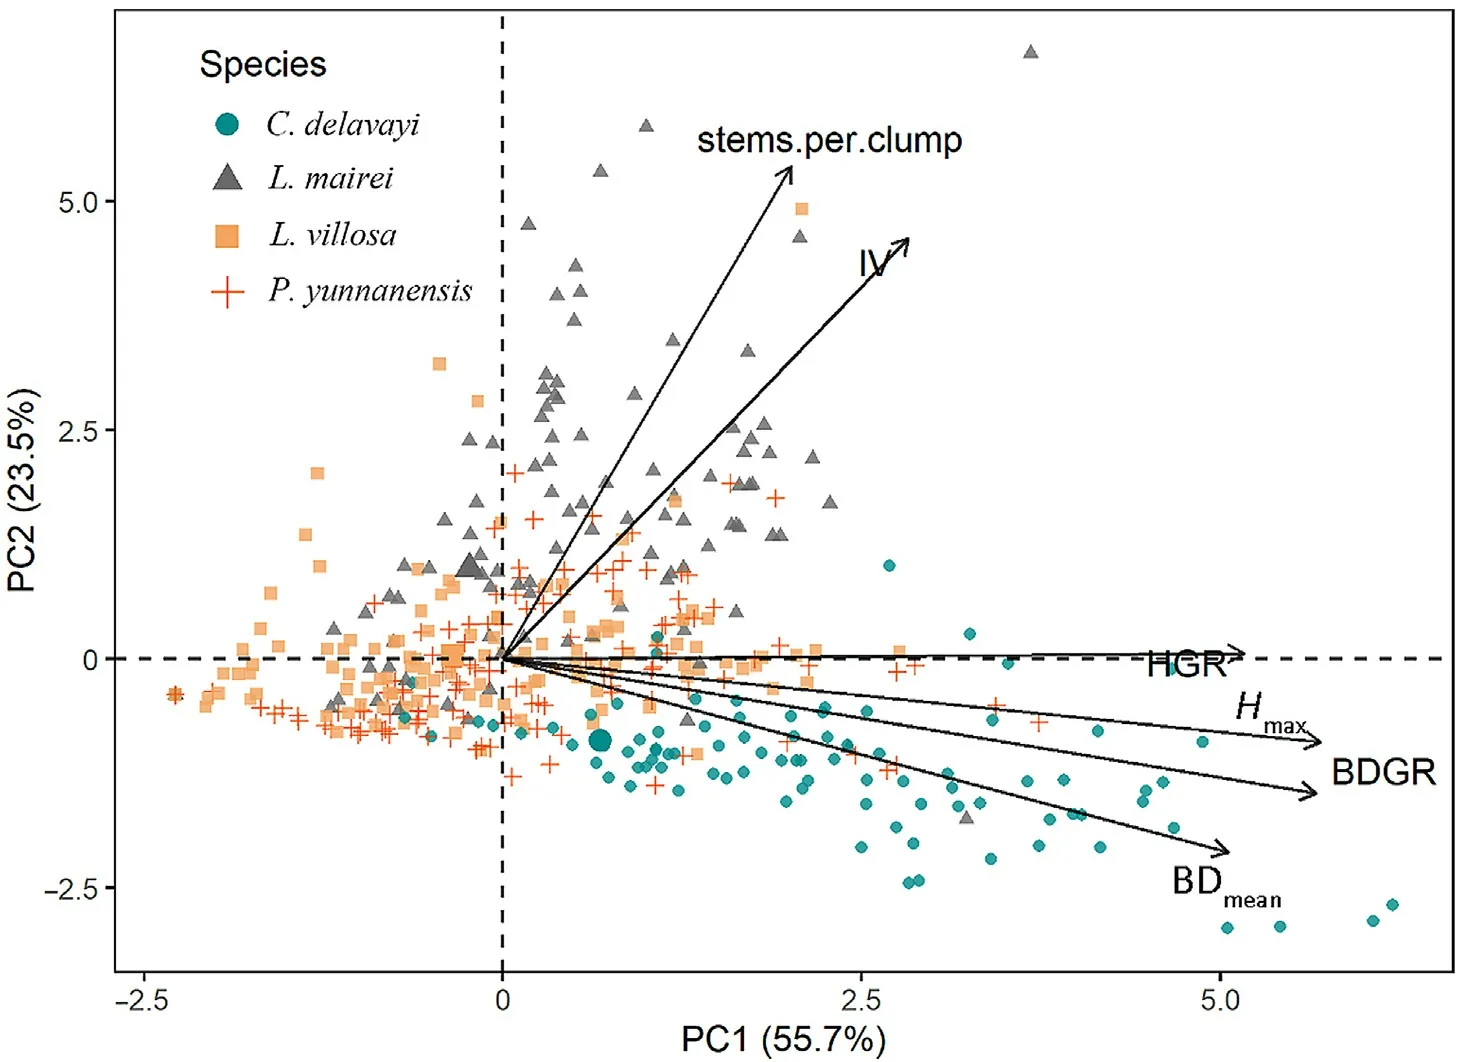
Fig.4.Principal component analysis (PCA) diagram of the six growth variables,with plots and species represented by different symbols.The lengths of the arrows indicate the correlation of six variables with the PCA axes.

Fig.5.Clump density of different regeneration traits including resprouting and seeding for four dominant species.
The linear models with environmental factors alone accounted for only very limited percentages of variance in post-fire plant regeneration,especially for plant size (i.e.Hmaxand BDmean) and resprouting ability(i.e.stems number per clump) (Table 2).When the PFRS framework of FS_OR differentiation was included as a random factor,the variance accounted for by LMMs increased for all growth parameters,especially for HGR.Although replacing the FS_OR with species names further increased the explained variance,the modified PFRS framework including FS_OR+H_OR+N showed the optimal explaining power,except for stem number per clump.In particular,the LMMs with modified PFRS explained most variance of plant size and growth rate(i.e.HGR and BDGR),whereas resprouting ability (i.e.stems per clump) were poorly accounted for in all models.
4.Discussion
Habitat condition,time since of last fire,and regenerating traits have been found critical for regeneration dynamics and habitat selection of plant species in post-fire communities (Wüest et al.,2016;Minor et al.,2017;Han et al.,2018;Zupo et al.,2020).The PFRS plays a critical role in the interspecific variation of post-fire regeneration.Regarding post-fire regeneration growth priority and height strategies,our differentiation of OR species into OR+H and OR+N subtypes substantially improved the predictions of the post-fire tree growth (Table 2).Actually,the two OR subtypes show a trade-off in allocating plant productivity to the occupation of horizontal versus vertical dimensions of the post-fire regeneration niche (Fig.8a).Moreover,the FS species such asP.yunnanensischose to hedge its bets.Its serotiny is generally stopped by fire and the post-fire seed dispersal and seeding strategy is similar to the regeneration strategy of the OR+N species,focusing on horizontal space occupying,and its resprouting strategy is the same as that of the OR+H strategy,pursuing the rapid vertical space filling (Fig.8a).These regeneration strategies can be differentiated by analyzing their percentage investments on the single-stem versus total vegetative growth (Fig.8b).At the early post-fire stage,the OR+N species (L.maireiandL.villosahere) invested more on regenerating many stems to occupy the gaps horizontally,with less investment on each stems (Pausas and Keeley,2014;Tavsanoglu and Gurkan,2014).On the contrary,the OR+H species (C.delavayi) invested more on the height growth of one or few stems for light competition,and lent the species a more important role in the later stage of regenerating communities (Tang et al.,2013;Muscarella et al.,2016).

Table 2 R2 of linear regression model and linear mixed models for plant size,growth rate and resprouting ability based on different random factors.Envi:linear models with 9 environmental explanatory variables including topography(i.e.elevation,position,slope,aspect),pH,soil nutrients(i.e.TN,OC/N,P)and TSF;PFRS:postfire regeneration strategy,including facultative seeder (FS) and obligate resprouter (OR);subPFRS:modified PFRS scheme including FS and the two subtypes of OR with number growth priority(OR+N)and height growth priority(OR +H).

Fig.6.Different post-fire growth strategies of OR species according to the trade-off between the stem number and height.(a)The relationship of stem height and the residuals of stems number after regression with environmental factors.(b) Relationship among burl size,stem number,and stem height for three OR species.(c)Species specific relationship between burl size and stem number.(d)Species specific relationship between burl size and stem height.Solid lines indicate the ordinary least squares linear models;colored lines represent fitted lines of three OR species.The shaded areas surrounding the solid lines represent 95% confidence intervals.
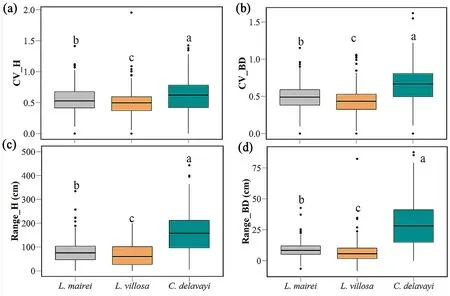
Fig.7.Coefficient of variation and range of stems height and basal diameter of each clump of OR species.Different letters above the boxes denote statistical differences of multiple comparisons.Multiple comparisons were corrected using the Wilcoxon rank sum test and tested for significance at the 95% confidence level (α=0.05).
Clarke et al.(2013) developed a buds-protection-resources (BPR)framework,and reclassified resprouter species into basal resprouters,epicormics,and apical resprouters.It is suggested that basal resprouters are shorter,whereas epicormics and apical resprouters are generally as tall as non-resprouters,because there is no necessity resprouting from the base.In our study,all the OR species resprouted from the base.When the stem height or number priority of the resprouts growing was considered,a substantially higher percentage of interspecific variation in post-fire growth can be accounted for.According to earlier studies of PFRS,resprouters perform better in occupying gaps horizontally,whereas seeders grow upward quicker in gaps (Pausas et al.,2004;Dietze and Clark,2008;Pausas and Keeley,2014;Tavsanoglu and Gurkan,2014;Nzunda et al.,2014).In our post-fire sites,the population of OR+N species tended to be more abundant than those of the OR+H and FS species at the early stages of post-fire regeneration,but their height and diameter growth were slower than that of the FS and OR+H species.Other studies also mentioned about the height strategies of resprouters(Pausas et al.,2004;Falster and Westoby,2005;Dietze and Clark,2008).Midgley (1996) illuestated that resprouters of many genus were supposed to be taller than reseeders,whereas with some exception such asAcaciaandEucalyptus.Those exception could be involved into OR+H species.For instance,resproutersBanksia serratagrew much taller and faster than other seeders;resprouts ofEucalyptushad higher post-fire height growth than seedlings of the same species and other seeder species (Pausas et al.,2004;Falster and Westoby,2005).Moreover,environmental factors and burl size,besides regeneration strategies,also help to explain the variation of post-fire regeneration and plant growth.In our study,the relationship between growth rates and environment factors was in agreement with the results of previous studies,where the growth rates were negatively correlated with TSF (Falster and Westoby,2005;Dietze and Clark,2008) and positively correlated with soil nutrients(Wang et al.,1998;McDonald and Urban,2004).Meanwhile,the number of stems per clump and stem size were not explained well by environmental factors,but were influenced by intrinsic factors such as burl size(Fig.6;Canadell and López-Soria,1998;Walters et al.,2005;Moreira et al.,2012;Nzunda et al.,2014).Burl size also affects the maximum height of stems positively (Cirne and Scarano,2001;Cruz et al.,2002;Muscarella et al.,2016).
According to Su et al.(2015),the resprouter species in this region are dominant or accompanying species in the middle to late stages of forest restoration,and thus play critical roles in the post-fire forest assembly.Species differences in regeneration strategies are an important part of species regeneration niche (Grubb,1977;Clark,1991),and contribute critically to their coexistence and community assembly (Takyu and Ohsawa,1997;Higgins et al.,2000;Aiba and Nakashizuka,2007;Klooster et al.,2007).In this study,the four dominant tree species filled the fire-released niche space with different growth priorities enabled their coexistence (and possibly of other species) in a heterogeneous post-fire landscape.By comparing the species composition of post-fire communities in the same region,Han et al.(2018) found that the repeated fires intensify the priority effect of speciation regeneration and stabilized the post-fire community assembly.According to our analyses,differentiating the number versus height growth priority in OR species represents a novel and useful improvement for the FS-OR framework of PFRS,and should help the understanding of niche partitioning and species coexistence in the fire-prone ecosystems.Although our PFRS classification was based only on the data of four species,they actually comprised over 75% of the post-fire regeneration in all sampled communities (Luo et al.,2021),thus have adequate data to reveal the interspecific difference.However,the applicability of this generalization requires evidence from more species and diverse life forms under various environmental contexts,and observations from longer temporal scales.Its usefulness and limitations for untangling the interaction between fire disturbance regime,regeneration strategies,and post-fire community dynamics deserve further works.
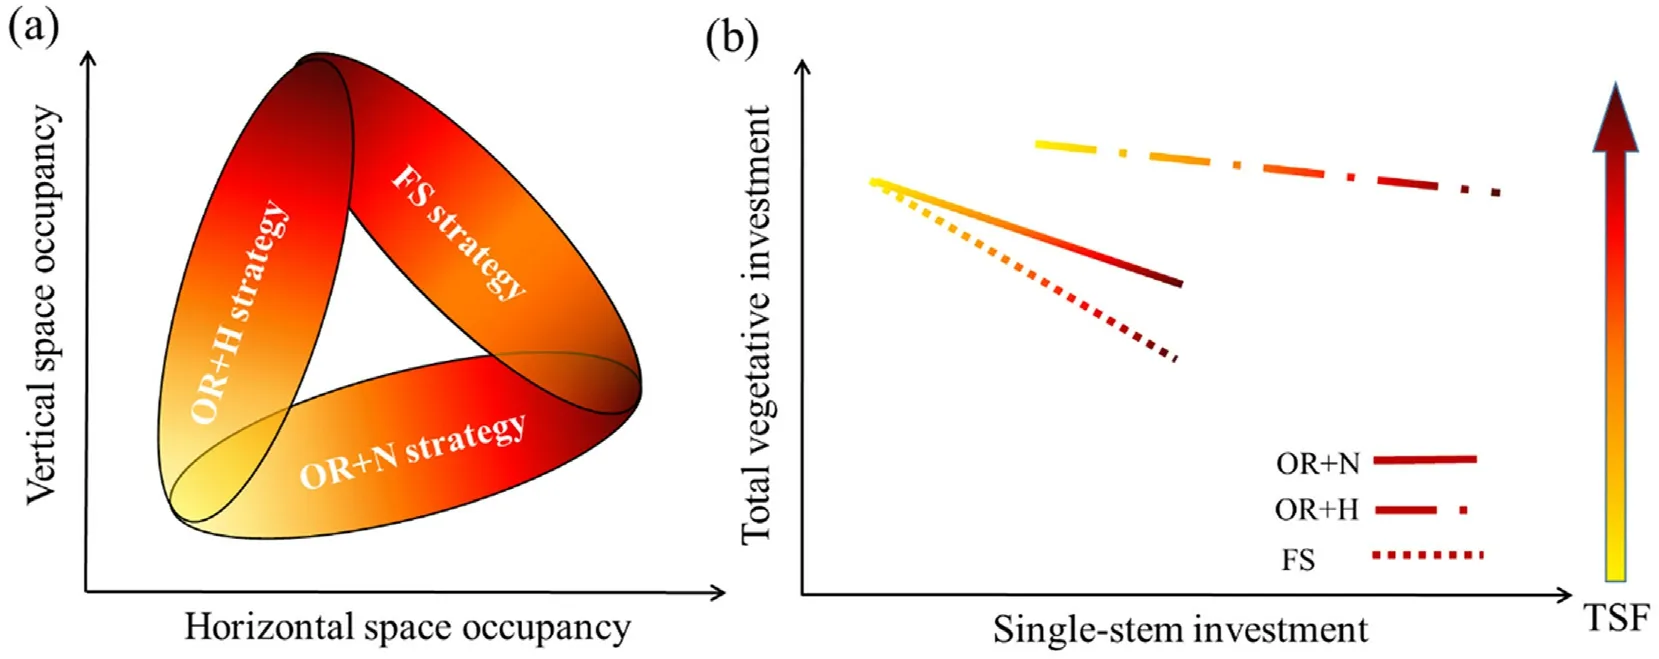
Fig.8.Conceptual models differentiating the post-fire regeneration strategies in the forest of subtropical monsoon climate in Yunnan,Southwest China.(a) Differences of vertical and horizontal space occupancy for different strategies;(b)The change of total vegetative investment and single-stem investment with increasing TSF during the post-fire recovery.
5.Conclusions
The post-fire regeneration dynamics of different species are linked with species specific regeneration ability and strategies.The four dominant tree species in the post-fire plant communities of central Yunnan Plateau,represented typically different PFRS,and showed differed regeneration dynamics and growth features.There were difference between FS and OR especially in multiple traits dynamics,and OR species can be further classified into OR+N and OR+H species regarding priority in stem quantity or height growth.The OR+N species occupy space primarily through horizontal canopy expansion and were more dominant than OR+H and FS at the early post-fire regeneration stages.In contrast,the OR+H species exhibits higher growth rates and primarily pursue vertical space,and has more variations in stems height and basal diameter per clump.Environmental factors could not effectively explain the variation of post-fire plant regeneration (R2<20%);when the modified PFRS as a random effect in the linear mixed models substantially increased the explanation.The modification of PFRS framework showed a potential of generalization and the power of improving the prediction of species performance and niche partitioning in the fireprone ecosystems.
Ethics approval and consent to participate
Not applicable.
Consent for publication
Not applicable.
Availability of data and materials
Data are available from corresponding author on reasonable request.
Declaration of competing interest
The authors declare that they have no competing interests.
Funding
This study was supported by the National Natural Science Foundation of China (41971228) and the National Key R and D Program of the Ministry of Science and Technology of China(2017YFC0505200).
Authors’contributions
CFL participated the field work,performed statistical analyses and drafted the manuscript.YQL,participated the field work,data collection and analyses.ZHS designed the study and participated the field investigation,reviewed and edited the manuscript.KY and XPW contributed to field work and manuscript editing.YXJ participated study design and manuscript review.All authors read and approved the final manuscript.
Acknowledgements
The authors are grateful for the collaboration of field investigation from Yiying Li,Jie Han,Lifang Chen,Mingzheng Yang,Jie Zhang and Yuyang Xie.We thank Dr.Juli G.Pausas for his helpful comments on an earlier version of this manuscript.The suggestions and comments from the anonymous reviewers are appreciated.
- Forest Ecosystems的其它文章
- Elevation gradient distribution of indices of tree population in a montane forest:The role of leaf traits and the environment
- A better carbon-water flux simulation in multiple vegetation types by data assimilation
- Sensitivity analysis of Biome-BGCMuSo for gross and net primary productivity of typical forests in China
- Environmental and biological factors affecting the abundance of Prosopis flexuosa saplings in the central-west Monte of Argentina
- Climate-driven variations in productivity reveal adaptive strategies in Iberian cork oak agroforestry systems
- Conifer establishment after the eruption of the Paricutin volcano in central Mexico

