
Spatiotemporal variation of forest land and its driving factors in the agropastoral ecotone of northern China
2022-02-23 13:40WANGShiqingTAOZefuSUNPilingCHENSijiaSUNHuiyingLINan
Journal of Arid Land 2022年1期
WANG Shiqing ,TAO Zefu ,SUN Piling,3* ,CHEN Sijia ,SUN Huiying ,LI Nan
1 School of Geography and Tourism,Qufu Normal University,Rizhao 276826,China;
2 Rizhao Key Laboratory of Territory Spatial Planning and Ecological Construction,Rizhao 276962,China;
3 College of Land Science and Technology,China Agriculture University,Beijing 100193,China
Abstract:As an important natural resource,forest land plays a key role in the maintenance of ecological security.However,variations of forest land in the agropastoral ecotone of northern China (AENC) have attracted little attention.Taking the AENC as an example and based on remote-sensing images from 2000,2010 to 2020,we explored the spatiotemporal variation of forest land and its driving factors using the land-use transfer matrix,spatial autocorrelation analysis and spatial error model.The results showed that from 2000 to 2020,the total area of forest land in the AENC increased from 75,547.52 to 77,359.96 km2 and the changes were dominated by the transformations among forest land,grassland and cropland,which occurred mainly in areas with the elevation of 500-2000 m and slope of 15°-25°.There was obvious spatial agglomeration of forest land in the AENC from 2000 to 2020,with hot spots of forest land gathered in the southern marginal areas of the Yanshan Mountains and the low mountainous and hilly areas of the Loess Plateau.The sub-hot spots around hot spots moved southward,the sub-cold spots spread to the surrounding areas and the cold spots disappeared.The spatiotemporal variation of forest land resulted from the interactions of natural environment,socioeconomic and policy factors from 2000 to 2020.The variables of average annual precipitation,slope,terrain relief,ecological conversion program and afforestation policy for barren mountains affected the spatial pattern of forest land positively,while those of annual average temperature,slope and road network density influenced it negatively.
Keywords:forest land;spatiotemporal variation;driving factors;spatial error model;agropastoral ecotone;northern China
1 Introduction
In recent years,with the rapid development of urbanization and industrialization in China,the pattern of land use has changed dramatically,manifested mainly by rapid expansion of construction land,continuous decrease of natural ecological land and reconstruction of agricultural production land (Liu et al.,2014).Regional land-use changes and their driving factors have always been important research topics in land science and global climate change (Liu et al.,2018).In particular,comprehensive studies of how human activities and natural environment affect land-use change constitute an important part of the research into the driving mechanisms of land-use changes (Chen and Yang,2001).The spatiotemporal variation and its driving factors for land-use types in specific areas have become important ecological issues (Peng et al.,2017).As an important ecological defense line,ecological environment of the AENC located in an arid and semi-arid transition area is very sensitive and fragile because of frequent human activities,therefore,the AENC has become a research hot spot for ecological environmental response to land-use changes (Liu et al.,2021).
Forest land is an important natural resource and plays a key role in regional development and ecological security maintenance (Godlee et al.,2021).Therefore,the dynamic monitoring of forest land resource and driving factors has attracted widespread attention (Njoghomi et al.,2021;Shriver et al.,2021).With the implementation of ecological projects and other socioeconomic measures,land-use type has undergone huge changes in the AENC,but the effects of these projects on the spatial distribution of forest land and the interaction between socioeconomic development and natural environment are difficult to measure (Wang et al.,2007).Ecological projects such as the Three-North Shelter Forest Program,the Grain for Green and the Taihang Mountain Greening Project have had significant impacts on the evolution of forest land (Du et al.,2016),leading directly to the conversion of forest land on a large scale (Zhou et al.,2012).Therefore,it is very important to pay attention to the factors driving the spatiotemporal variation of forest land in sensitive and fragile areas with extremely important ecological environments.
Currently,research on forest land is mainly focused on the dynamic monitoring (Xie and Gong,2019),saptiotemporal pattern and driving factors (Zhang et al.,2020),landscape pattern and gradient effect (Clarke,2003),scenario simulation and prediction (Yang and Fu,2018),transformation and circulation (Gong et al.,2019;Yu et al,2020),relationship between change of forest land and ecological environment (Garner et al.,2015;Zhu,2015),changes of ecosystem service values (Cao et al.,2008),and management and protection (Li and Zhang,2020;Wei,2020).With progress in remote sensing,geographic information,big-data mining technology,the methods of landscape pattern metrics,spatial autocorrelation analysis,probit regression models,logistic regression models and Cellular Automata-Markov Chain model have been widely used in forest land research (Zhou et al.,2018;Shao et al.,2019;Gou et al.,2021;Li et al.,2021;Xi et al.,2021),but studies of the spatiotemporal variation of forest land and its driving factors in the AENC with spatial regression models are currently lacking.
In recent years,with the rapid development of economy in the AENC,ecological problems such as vegetation destruction,land degradation and soil erosion have been increasing,and conflicts between ecological protection and economic development are becoming serious.Therefore,for the sake of ecological protection and sustainable development,there is an urgent need to clarify the trend of forest land changes in the AENC.The aims of the present study are to (1) analyze the transition of forest land in the AENC from 2000 to 2020;(2) reveal the spatiotemporal variation of forest land;and (3) explore the factors driving this spatiotemporal variation.
2 Materials and methods
2.1 Study area
The AENC includes 226 counties (banners,cities and districts) in the autonomous regions of Inner Mongolia and Ningxia Hui and the provinces of Jilin,Liaoning,Hebei,Shanxi,Shaanxi,Gansu and Qinghai (34°43′31′′N-46°57′46′′N,100°57′11′′E-125°34′11′′E;Fig.1).The total area of the AENC is 699,078.78 km2and its elevation ranges from 160 m below sea level to 4973 m above sea level.This area is dominated by plateaus,mountains and hills.The AENC has a temperate arid and semi-arid climate,experiencing the low temperature and drought.The annual average temperature is 0°C-8°C,the average annual precipitation is 300-450 mm and variation of annual precipitation is high,being 15%-30% (Liu and Gao,2008).With decreasing precipitation from east to west,the vegetation transforms gradually from forest steppe to desert steppe.

Fig.1 Location of study area and sample points
2.2 Data sources and processing
The data used in this study came from remote-sensing images comprising Landsat images from 2000 to 2010 and Operational Land Image in 2020.These images were obtained from China′s Geospatial Data Cloud (http://www.gscloud.cn/).Preprocessing of these Landsat images included an atmospheric correction in the Environment for Visualizing Images (ENVI) 5.1 and geometric rectification.In total,281 sample points were collected and classified in August 2020 with the Google Earth and spot surveying.Approximately 35% of the sample points were selected randomly for accuracy assessment.The methods of neural-net estimation and man-machine interactive interpretation were used to interpret and classify these images.The results were then tested and verified,with overall accuracies of 87.68%,89.72% and 88.59% for the images in 2000,2010 and 2020,respectively,and Kappa coefficients of 0.85,0.87 and 0.86,respectively,indicating that the interpretation results could meet the needs of this study.Land-use types were divided into six categories:cropland,forest land,grassland,water body,construction land and unused land (Wang and Liu,2009).The topographical data were derived from a digital elevation model (DEM) with a resolution of 30 m×30 m and downloaded from the China Meteorological Science Data Sharing Service Network (http://cdc.cma.gov.cn/).The slope,aspect and terrain relief were extracted from the DEM.The meteorological data downloaded from the same datasets were interpolated spatially by the inverse distance weighting method.The road traffic data (including railways and highways) came from the electronic traffic map (2000 and 2020),and the social and economic statistics such as population and regional gross domestic product came mainly from the statistical yearbooks of these provinces and regions of the AENC.
We processed the aforementioned data using the ArcGIS 10.4 software,and we used a 10 km×10 km grid as the data carrier and basic analysis unit.Format conversion,mask clipping and vector data rasterization were processed to unify all the spatial data into the Albers projection system.In the same grid,spatial statistics for forest land,meteorology,topography,socioeconomic data and other multisource data were processed,and spatial data for the driving factors of forest land were obtained.
2.3 Methods
2.3.1 Land-use transfer matrix
Land-use transfer matrix was used to characterize the inter-conversion relationship between forest land and other land types in the AENC from 2000 to 2020.It is expressed as follows (Liu et al.,2021).
whereSijis the area converted from land-use typeito typej(km2);andnis the number of land-use types.
2.3.2 Spatial autocorrelation analysis
The method of spatial autocorrelation analysis is effective for revealing whether the spatial distribution of a spatial element or a property value is related to the adjacent region and the degree of correlation (Qing et al.,2020).In the present study,global spatial autocorrelation was used to analyze the spatial distribution characteristics of forest land.Spatial hotspot analysis (Getis-Ord) was used to identify the spatial characteristics of forest land clusters in the AENC (Ren et al.,2016).The equations were as follows:

whereIis the global Moran′sI;xiandxjare the forest land areas of regionsiandj,respectively(km2);is the mean forest land area (km2);Wijis the spatial weight matrix (i≠j);is the statistic of regioni;Z() is the standardized value of,which is used to execute aZstatistic test for forest land in the AENC;E() is the average of;and var() is the coefficient of variation of.The global Moran′sIranges from -1 to 1.IfI>0,the forest land is positively correlated spatially,and the high or low values of forest land are distributed centrally;ifI<0,there is a negative correlation,which indicates that forest land from one region is different from those of the surrounding regions;ifI=0,forest land occurs randomly.If Z() passes the statistical test and is greater than 0,then regioniis surrounded by the high values of forest land area and a cluster of high values (a hot spot) forms;if Z() passes the statistical test and is less than 0,then regioniis surrounded by the low values of forest land area and a cluster of low values (a cold spot) forms.
2.3.3 Explanatory variables
The spatiotemporal variation of forest land is driven by natural environmental,socioeconomic and regional policy factors (Dwomoh et al.,2021;Hou et al.,2021;Luo et al.,2021).Following previous studies (Bochet et al.,2021;Li et al.,2021;Rohde et al.,2021),we selected explanatory variables from those three aspects,i.e.,natural environment,socioeconomic and regional policy factors (Table 1).Natural environment factors play a key role in forest land changes,and six explanatory variables including average annual precipitation,annual average temperature,elevation,slope,aspect and terrain relief were selected to characterize the natural environment features in the AENC.Three explanatory variables of economic density,population density and road network density were selected to reflect the socioeconomic conditions in the AENC.The regional policy is the measure of afforestation for barren mountains.

Table 1 Explanatory variables relevant to spatiotemporal variation of forest land
2.3.4 Spatial regression model
Generally,the relationship between observed variables and potential driving factors is explored using multiple linear regression (Yu et al.,2017).However,as a geographic phenomenon,forest land changes are correlated spatially,therefore it was necessary to use a spatial regression model that considers the spatial correlation among regions to identify the driving factors of forest land changes.The spatial regression model includes a spatial lag model (SLM) and a spatial error model(SEM) (Liu et al.,2012;Sun et al.,2017) that were used to analyze the relationship between the spatiotemporal variation of forest land and the explanatory variables.Using the ArcGIS and GeoDa software,we screened the appropriate spatial measurement model by using the Lagrange multiplier(LM) test and by checking the spatial autocorrelation of forest land distribution.
The SLM is expressed as follows (Sun et al.,2017):

whereYis the forest land area of spatial regional unit (km2);Wandρare the spatial adjacency weight and its estimated coefficient,respectively;βis the coefficient of explanatory variable;Xis the explanatory variable matrix;andεis a random error.The SEM is expressed as follows (Yu et al.,2017):

whereλis the coefficient of regression;andμis an independent random error.
3 Results
3.1 Transition of forest land in the AENC
From 2000 to 2020,the total area of forest land increased from 75,547.52 to 77,359.96 km2with a 2.40% increase rate for each year.The newly increased forest land was scattered mainly in the mountainous areas of northern Hebei Province,and low mountainous and hilly areas of the Loess Plateau (Fig.2).

Fig.2 Spatiotemporal variation of forest land in the agropastoral ecotone of northern China (AENC) in 2000 (a),2010 (b) and 2020 (c)
As shown in Figure 3,the total area of forest land decreased by 111.55 km2in the AENC from 2000 to 2010.On the one hand,the decreased forest land was converted mainly to grassland and cropland.The areas of this conversion for grassland and cropland were 9142.64 and 517.99 km2,accounting for 94.19% and 5.34% of the total area changed,respectively.The conversion of forest land to grassland occurred mainly in the mountainous areas of northern Hebei Province and Inner Mongolia Autonomous Region.Furthermore,the conversion of forest land to cropland was distributed mainly in river valleys and intermountain basins in the counties of Hunyuan,Lingqiu and Guangling with a low elevation and flat terrain.On the other hand,increased forest land was derived mainly from grassland and cropland.And the areas of the conversion were 8613.02 and 852.37 km2for grassland and cropland,accounting for 89.76% and 8.78% of the total area changed,respectively.The conversion of grassland to forest land occurred mainly in the mountainous areas of northern Hebei Province,while the conversion of cropland to forest land was scattered in areas of high elevation and complex terrain,including the counties of Gujiao,Jingle,Chongli and Zhangbei.In recent years,with the implementation of ecological projects,the expansion of forest land was derived mainly from grassland and cropland from 2010 to 2020,which accounted for 1923.99 and 2991.23 km2,respectively.Cropland was converted to forest land because of the construction of farmland shelterbelt,and the increase of forest land improved the ecological environment further.

Fig.3 Conversation between forest land and other land types in the AENC from 2000 to 2020.(a),2000-2010;(b),2010-2020.
The topographical gradient effect of forest land was obvious in the AENC (Fig.4).Forest land changes were distributed mainly in areas with elevations of 500-2000 m and slopes of 15°-25°.With the implementation of ecological projects such as the Three-North Shelter Forest Program,the Grain for Green and the Taihang Mountain Greening Project,forest land expanded into regions with a higher topographic gradient in the AENC,which occupied a dominant position at elevations exceeding 2000 m and slopes exceeding 15°.

Fig.4 Vertical distribution of forest land in the AENC in different elevations (a) and slopes (b).DEM,digital elevation model.
3.2 Spatiotemporal distribution of forest land in the AENC
3.2.1 Distribution trend of forest land
The geostatistical analysis module of ArcGIS 10.4 software was used to analyze the distribution trend of forest land in the AENC from 2000,2010 to 2020 (Fig.5).The change in forest land in the AENC was very obvious.The overall spatial pattern of forest land showed an inverted U-shaped differentiation trend in the east-west direction,being high in the north and low in the south from 2000 to 2020.
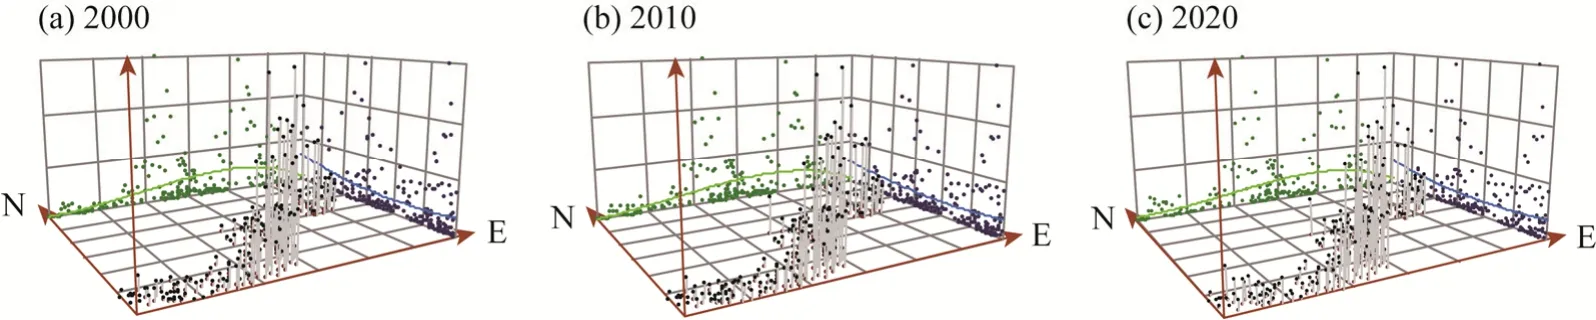
Fig.5 Distribution trend of forest land in the AENC in 2000 (a),2010 (b) and 2020 (c).N,north;E,east.
3.2.2 Spatiotemporal variation of forest land
The global Moran′sIof forest land in the AENC from 2000 to 2020 was calculated using ArcGIS 10.4 (Table 2) and ranged from 0.323 to 0.328 from 2000 to 2020.TheZ() values were positive and all tested significantly at the 0.01 level,which indicated a positive spatial autocorrelation of forest land.This result showed that areas with similar levels of forest land tended to be spatial agglomerated.Furthermore,the global Moran′sImaintained a downward trend in its fluctuations,indicating that the degree of agglomeration continued to weaken after a minor intensification in the AENC from 2000 to 2020.
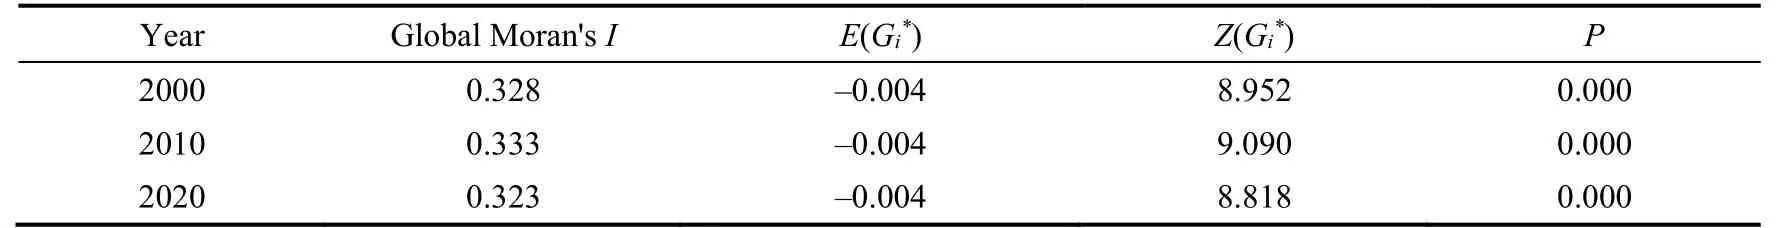
Table 2 Global Moran′s I of forest land in the AENC from 2000 to 2020
To effectively analyze the spatiotemporal variation of forest land in the AENC,we divided the values of Getis-Ordfrom high to low into five types of hot spot,sub-hot spot,sub-cold spot,cold spot and non-significant area using the Jenks natural-breaks method (Cao et al.,2014).The spatial pattern of forest land showed an obvious spatial difference in the AENC from 2000 to 2020(Fig.6).
The spatial pattern of hot spots evolved significantly in the AENC,which was manifested mainly as a reduction trend from 2000 to 2020.Forest land was distributed mainly in the mountainous areas with higher elevations and slopes.From 2000 to 2020,the number of counties (districts) in hot spots decreased constantly,becoming gathered in the southern marginal area.Two clusters of high forest land area formed in 23 counties (districts) located in the Yanshan Mountains and the low mountainous and hilly areas of the Loess Plateau.During this time,the spatial pattern evolution of sub-hot spots moved southward,which occurred mainly in regions around the hot spots.With the implementation of ecological projects,in 2020,the sub-hot spots covered 13 counties (districts) located in the Yanshan Mountains and the Loess Plateau,where the ecological environment is very sensitive and fragile.Meanwhile,the sub-cold spots spread to the surrounding areas,and the number of counties (districts) with sub-cold spots increased from 43 to 47 from 2000 to 2020.These counties (districts) were distributed mainly in areas with a low elevation and flat terrain,such as the valleys of Huangshui,the Yellow River and the Daqing River,located in the provinces of Qinghai,Gansu and Inner Mongolia Autonomous Region,where two clusters of low forest land area (sub-cold spots) formed.Moreover,the spatial pattern of cold spots changed significantly.In 2000,there was a cluster of low forest land area (cold spot) in the region between the provinces of Qinghai and Gansu,including the county of Minhe in Qinghai and the district of Qilihe in Gansu;however,this cold spot disappeared as Minhe and Qilihe fell into sub-cold spots in 2020 (Fig.6c).
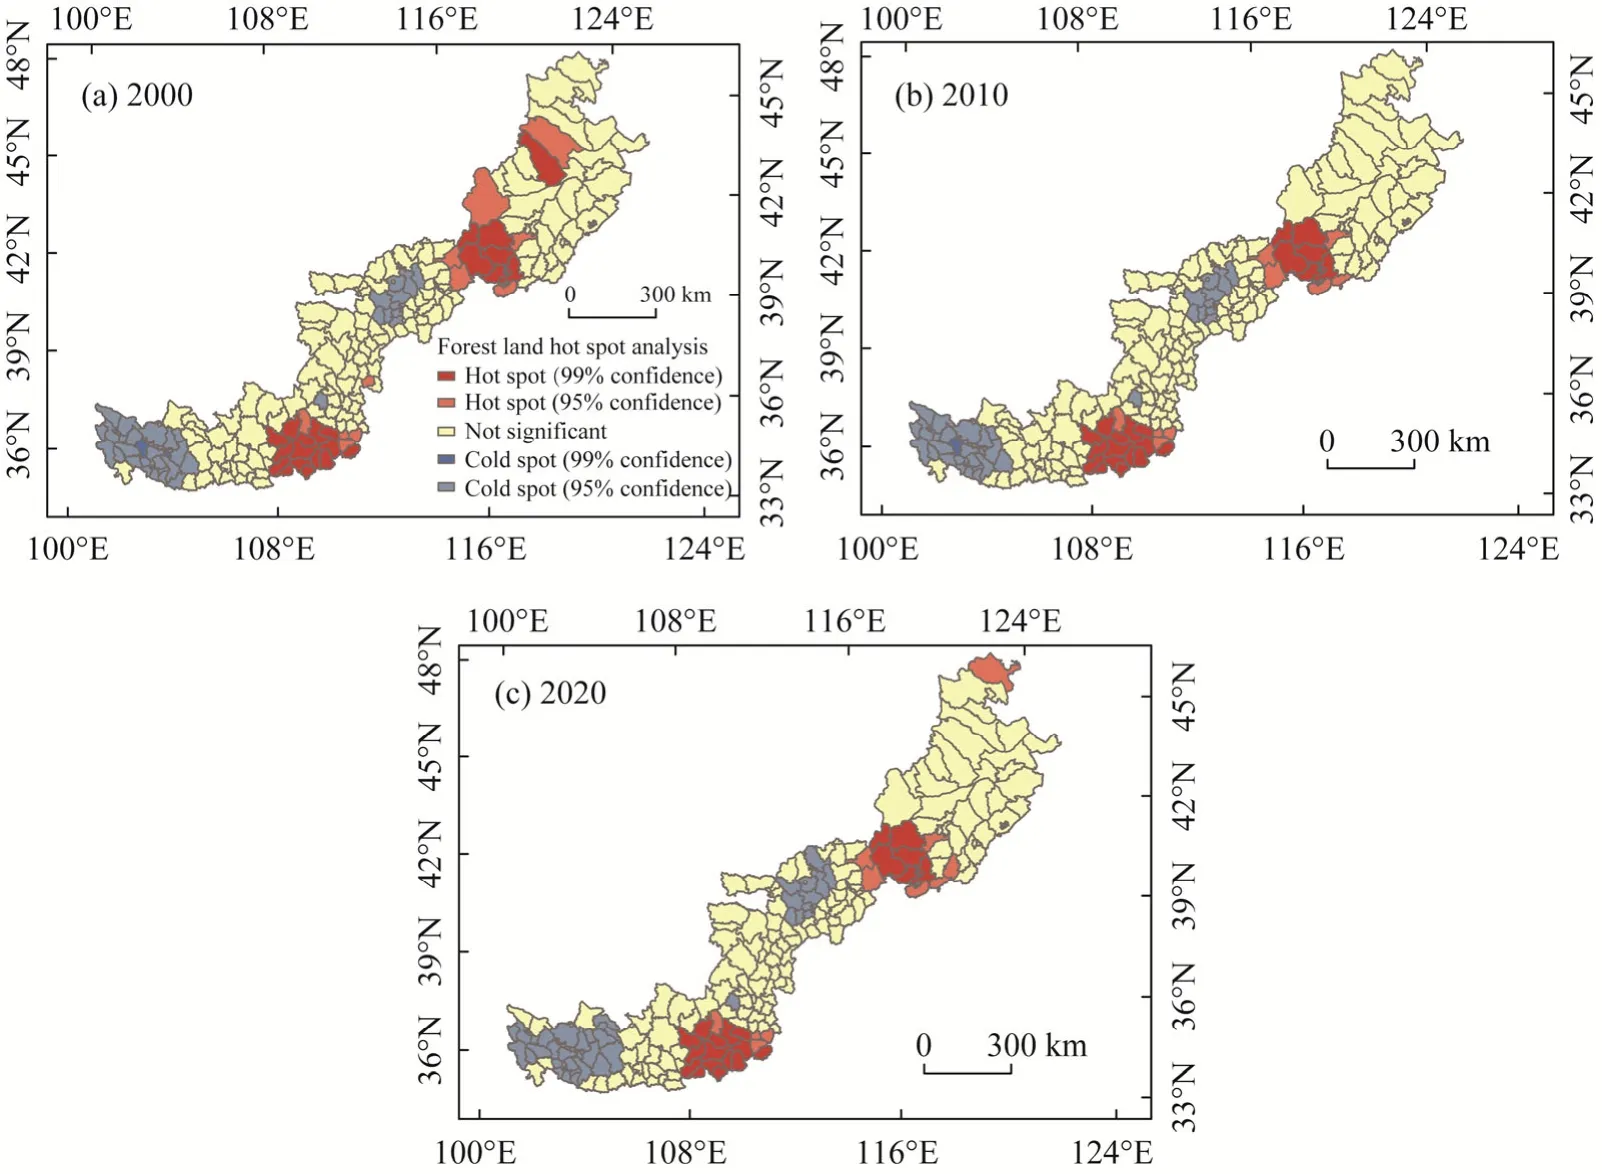
Fig.6 Spatiotemporal variation of forest land in the AENC in 2000 (a),2010 (b) and 2020 (c)
3.3 Driving factors of spatiotemporal variation of forest land
In this study,the LM test was used to select the spatial measurement model.Conventional least-squares analysis showed that the results of SEM and robust LM for the years 2000 and 2020 both passed the test at the 0.01 level.This result indicated that SEM was suitable for identifying the factors driving the spatiotemporal variation of forest land in the AENC.And the spatial variation was influenced by natural environment,socioeconomic and regional policy factors (Table 3).
3.3.1 Natural environment factors
As shown in Table 3,the significant variables are average annual precipitation,annual average temperature,slope,aspect and terrain relief.This result indicates that climate and topographic conditions basically determined the spatial pattern of forest land in the AENC.Precipitation and temperature are important natural conditions for land use,determining the level of climate-induced potential productivity in a region.The spatiotemporal variation of forest land was affected significantly by precipitation and temperature in the AENC from 2000 to 2020.There was a positive correlation between the average annual precipitation and the distribution of forest land,which passed the significance test at the 0.01 level in 2000 and 2020,while it was negatively correlated with annual average temperature.The AENC is located in arid and semi-arid areas,

Table 3 Factors driving spatiotemporal variation of forest land in the AENC
where the distribution of vegetation cover is consistent with the precipitation.Therefore,the higher the precipitation is,the better the forest land covers.In mountainous areas,the sunny slope and flat areas are often suitable for agricultural production,so cropland and garden land usually occupy the dominant position there,while forest land is scarce.The regional differentiation of land resources is restricted by topographical conditions,which can affect the redistribution of heat and water.The distribution of forest land was correlated positively with slope and terrain relief but negatively with aspect.In the southern and northwestern mountainous areas,there was a wide distribution of forest land.As shown in Figure 5,the hot spots of forest land covered the mountainous areas in northern Hebei Province and the low mountainous and hilly areas of the Loess Plateau,with a larger slope and complex terrain.Slope was found to be associated significantly and positively with forest land area (P<0.01),and the coefficients were 2169.820 and 3901.600 in 2000 and 2020,respectively.Terrain relief was not significant in 2000 but was highly significant (P<0.01) and positively associated with forest land area in 2020,with a coefficient of 138.368.
3.3.2 Socioeconomic factors
With improved socioeconomic levels,the distribution pattern of forest land changed significantly.Table 3 shows that two variables passed the significance test of SEM in the socioeconomic dimension:(1) population density was associated significantly and negatively with the dependent variable (P<0.05) in 2000 with a coefficient of -0.022,but it became insignificant in 2020;and (2)road network density was highly significant (P<0.01) in 2000 and 2020 and was also correlated negatively with the distribution of forest land,with the coefficients of -0.711 and -2.856,respectively.These results showed that forest land had a lower possibility of appearing in regions with intensive population,more-developed economy and superior transportation location,where cropland and construction land were dominant.Forest land was distributed mainly in suburbs and remote areas with inconvenient transportation.
3.3.3 Regional policy factors
Table 3 shows that two variables impacted the distribution of forest land in the aspect of regional policies:forest land area was correlated significantly and positively with ecological projects and afforestation policy for barren mountains.The former was significantly relevant to forest land(P<0.01) in 2020,with a regression coefficient of 9643.830.Implemented in 1999 and restarted in 2014,the project of Grain for Green resulted in dramatic changes in forest land distribution in the AENC.Moreover,afforestation policy for barren mountains was significantly and positively relevant to forest land (P<0.01 in 2000 andP<0.05 in 2020,respectively),with the coefficients of 311.692 and 2298.230,respectively.With the implementation of ecological projects,the evolution of forest land has had significant impacts.These results indicate that the probability of forest land increased in regions located in ecological construction areas from 2000 to 2020.
4 Discussion
4.1 Effects of natural environment factors on forest land in the AENC
According to the results of spatial regression model (Table 3),natural environment factors such as average annual precipitation,annual average temperature,slope,aspect and terrain relief were the key driving factors for the spatial distribution of forest land,which were consistent with the existing researches.For example,Morales et al.(2020) and Kibler et al.(2021) found that precipitation was an important natural factor affecting the spatial pattern of forest land.Fu et al(2021) and Deng et al (2021) pointed out that climatic and topographical factors,such as annual average temperature,altitude and slope,played important impacts on the spatial distribution of forest land.Compared with previous studies,the influence of natural environment factors such as average annual precipitation,annual average temperature,slope,aspect and terrain relief on the spatial distribution of forest land was positive.The AENC located in the transitional zone from farming areas to pastoral areas and from semi-arid areas to arid areas,was an important ecological security barrier and water conservation area of Beijing-Tianjin-Hebei with sensitive ecological environment.Those natural environment factors represented the regional natural conditions,which reflected the macro-geographic background of the AENC to a certain extent.Therefore,the effects of those natural environment factors on the spatial distribution of forest land in the AENC was synthetic.Similar results were reported form the researchers of Chen et al.(2017) and Wang et al.(2021),who found that spatial differentiation of forest land was resulted from altitude,aspect and slope position.Since the 21stcentury,government took ecological projects in the AENC,which resulted in the expansion of forest land in high altitude and slope areas.Moreover,because the AENC was located in the transitional areas from the monsoon areas to the non-monsoon areas,its sunny slopes and semi-sunny slopes were also windward slopes,where the heat and precipitation were relatively abundant.Development of forest land in these areas was more suitable.Similar result was confirmed by Nirmal et al.(2021) and Wang et al.(2021),who found that geographical location influenced the drought distribution and the growth of shrub.
4.2 Effects of human activities on forest land in the AENC
Socioeconomic and policy factors played important roles in the spatial distribution of forest land.Our results found that road network density had a negative impact on the spatial distribution of forest land in the AENC,and the impact of population density gradually weakened.Yu et al.(2017) and Bochet et al.(2021) also found that population growth and economic development had significant impacts on the transition and spatial distribution of forest land with the qualitative analysis.Rapid economic development,improvement of urbanization level,changes of industrial structure and urban population growth usually resulted in the decrease of forest land (Wan et al.,2019;Feng et al.,2021;Hou et al.,2021).Due to the limited socioeconomic construction and slow development of industry and agriculture in the AENC,the impact of economic density on the spatial distribution of forest land weakened.Moreover,population outflow was serious and the residents was gradually decreasing in the AENC.The influence of population density on the spatial distribution of forest land is also decreasing.With the implementation of new urbanization construction and rural revitalization strategy in the AENC,the traffic facilities had been continuously improved,and the road accessibility had gradually increased,which caused the change of spatial distribution pattern of forest land.
Policy factors,especially Grain for Green project had significant effects on the spatiotemporal variation of forest land in the AENC.Deng et al.(2021) and Liu et al.(2010) found that the Grain for Green project was an important driving factor for the increase of forest land in mountainous areas,which was consistent with this study.Compared with previous studies,the impact of ecological projects and afforestation policy for barren mountains on the spatial distribution of forest land in the AENC had gradually enhanced.Owing to a series of ecological projects had been carried out since 1999,the function of ecological security barrier of the AENC had been enhanced.
5 Conclusions
This study found that the changes in forest land in the AENC from 2000 to 2020 were dominated by conversion among forest land,grassland and cropland,which occurred mainly in the areas with elevations of 500-2000 m and slopes of 5°-25°.In this study,the spatial pattern of forest land from 2000 to 2020 showed a trend of an inverted U-shaped differentiation in the east-west direction,being high in the north and low in the south.The hot spots of forest land gathered in the southern marginal areas of the Yanshan Mountains and the low mountainous and hilly areas of the Loess Plateau,and the sub-hot spots around the hot spots moved southward.The sub-cold spots spread to the surrounding areas,and the cold spots disappeared.Spatiotemporal variation of forest land was influenced by natural environment,socioeconomic and policy factors.Impacts of terrain relief and ecological conversion policy increased,while those of population density decreased.Consequently,this study offers scientific references for protection of forest land and ecological construction in the AENC.However,a further study should be conducted to explore the impact of intensity of policy implementation and other policy factors that will influence the distribution of forest land.
Acknowledgements
This research was funded by the National Natural Science Foundation of China (41971238),the Ministry of Education Humanities and Social Youth Foundation of China (19YJCZH144),the Natural Science Foundation of Shandong Province,China (ZR2019QD006),and the National College Student Innovation Training Project(S202010446004).
- Journal of Arid Land的其它文章
- Ecological environment quality evaluation of the Sahel region in Africa based on remote sensing ecological index
- Isotope implications of groundwater recharge,residence time and hydrogeochemical evolution of the Longdong Loess Basin,Northwest China
- Lithic soils in the semi-arid region of Brazil:edaphic characterization and susceptibility to erosion
- Spatial variability of leaf wetness under different soil water conditions in rainfed jujube (Ziziphus jujuba Mill.) in the loess hilly region,China
- Neoproterozoic I-type granites in the Central Tianshan Block (NW China): geochronology,geochemistry,and tectonic implications
- Optimal bandwidth selection for retrieving Cu content in rock based on hyperspectral remote sensing