
Ecological environment quality evaluation of the Sahel region in Africa based on remote sensing ecological index
2022-02-23 13:40WUShupuGAOXinLEIJiaqiangZHOUNaGUOZengkunSHANGBaijun
Journal of Arid Land 2022年1期
WU Shupu ,GAO Xin* ,LEI Jiaqiang ,ZHOU Na ,GUO Zengkun ,SHANG Baijun
1 State Key Laboratory of Desert and Oasis Ecology,Xinjiang Institute of Ecology and Geography,Chinese Academy of Sciences,Urumqi 830011,China;
2 University of Chinese Academy of Sciences,Beijing 100049,China
Abstract:Long-term monitoring of the ecological environment changes is helpful for the protection of the ecological environment.Based on the ecological environment of the Sahel region in Africa,we established a remote sensing ecological index (RSEI) model for this region by combining dryness,moisture,greenness,and desertification indicators.Using the Moderate-resolution Imaging Spectroradiometer (MODIS) data in Google Earth Engine (GEE) platform,this study analyzed the ecological environment quality of the Sahel region during the period of 2001-2020.We used liner regression and fluctuation analysis methods to study the trend and fluctuation of RSEI,and utilized the stepwise regression approach to analyze the contribution of each indicator to the RSEI.Further,the correlation analysis was used to analyze the correlation between RSEI and precipitation,and Hurst index was applied to evaluate the change trend of RSEI in the future.The results show that RSEI of the Sahel region exhibited spatial heterogeneity.Specifically,it exhibited a decrease in gradient from south to north of the Sahel region.Moreover,RSEI in parts of the Sahel region presented non-zonal features.Different land-cover types demonstrated different RSEI values and changing trends.We found that RSEI and precipitation were positively correlated,suggesting that precipitation is the controlling factor of RSEI.The areas where RSEI values presented an increasing trend were slightly less than the areas where RSEI values presented a decreasing trend.In the Sahel region,the areas with the ecological environment characterized by continuous deterioration and continuous improvement accounted for 44.02% and 28.29% of the total study area,respectively,and the areas in which the ecological environment was changing from improvement to deterioration and from deterioration to improvement accounted for 12.42% and 15.26% of the whole area,respectively.In the face of the current ecological environment and future change trends of RSEI in the Sahel region,the research results provide a reference for the construction of the ′Green Great Wall′ (GGW) ecological environment project in Africa.
Keywords:ecological environment;remote sensing ecological index;human activities;climate change;Sahel region;′Green Great Wall′ (GGW)
1 Introduction
Over the past 100 a,the Earth′s mean temperature has increased by 0.7°C (IPCC,2014).Numerous studies have shown that climate change has important impacts on polar,temperate,and tropical ecological environments (Vitousek,1994;Walther et al.,2002).Due to the influence of human activities,the changes of ecological environment tend to be complicated and multi-dimensional(Sih et al.,2011).Advances in science and technology provide a basis for monitoring the variability of the Earth′s ecological environment and its possible responses to changes in anthropogenic and natural conditions (Moss et al.,2010).Such advances can contribute to improving our understanding of the operating mechanism of the Earth′s systems by monitoring long-term ecological environment changes,indicating the response of the ecological environment to more intense human activities (Qureshi et al.,2020),and can assist in efforts to minimize the negative impact of global changes on human survival and development (Ji et al.,2020).
Remote sensing (RS) technology has the advantages of large observation range,timeliness,and periodicity.It is widely used in fire monitoring,land-cover change analyses,forestry investigations,and large-scale real-time air pollutant monitoring (Biswal and Gorai,2020;Ebrahimi et al.,2020;Gu et al.,2020;Yim,2020);this technology plays an important role in ecological environment monitoring (Xu et al.,2019).Ecological environment refers to the general term of the environment composed of living and non-living organisms (Liao and Jiang,2020).Due to the different research themes of scholars,there are many differences in the definition of ecological environment quality(Miao et al.,2016;Jing et al.,2020).Based on relevant researches,we define the ecological environment quality as the degree of suitability for the survival of living organisms in this study.
Ecological environment quality evaluation is based on the choice of different indicators;it adopts the comprehensive evaluation method to quantitatively assess the regional ecological-environmental quality (Zhou,2000).Xu (2013) proposed to monitor and evaluate the ecological environment quality by obtaining remote sensing ecological index (RSEI) through RS technology.At present,many scholars have used RSEI to evaluate the ecological environment quality of different regions.For example,Xu et al.(2019) quantified and monitored the ecological environment changes in Fujian Province of China based on the change vector analysis method and four ecological indicators (i.e.,moisture,greenness,heat,and dryness).Liao and Jiang (2020)established China′s RSEI model,based on four indicators (moisture,greenness,heat,and dryness).They monitored the overall ecological environment quality of China from 2000 to 2017 and found that drought was the most important factor affecting the ecological environment quality (Liao and Jiang,2020).
Changes in the ecological environment are usually accompanied by variations of the whole environment,including changes in the surface vegetation,temperature,and soil moisture (Walther et al.,2002;Zheng et al.,2020).Therefore,a comprehensive evaluation of multiple indicators should be included when RS is used to monitor the ecological environment changes.However,previous research has mostly used moisture,greenness,heat,and dryness as evaluation indicators,while ignored the diversity of the ecological environment (Xiong et al.,2020).Different ecological environments should be evaluated with different indicators.Moreover,data loss occurs easily because RS images are limited by bad weather conditions (Steven et al.,1998;Zhang et al.,2020).In addition,some research areas are relatively broad,and images with intervals of 5 or 10 a are often selected for RSEI evaluation to reduce the experimental workload (Fan et al.,2020).However,owing to the influence of data selection,variations in the surface features,and extreme climate events,changes in the ecological environment can be easily misjudged (Hang et al.,2020).In the past,single ecological factor was used to evaluate the ecological environment quality,such as the vegetation index (Dardel et al.,2014),soil moisture index (Gu et al.,2019),precipitation (Dai,2011),and temperature (Wu et al.,2020).There are few studies about the overall ecological environment of the Sahel region.Based on the RSEI model,this paper comprehensively assessed the ecological environment quality of the Sahel region.
As mentioned above,with the consumption of natural resources and global climate change,the global ecological environment is accordingly changing (Singh et al.,2014).The Sahel region is a zone between the Sahara Desert and Savanna.Its ecological environment is very fragile,and it is extremely sensitive to climate change and human activities (Held et al.,2005;Issa et al.,2014).Severe desertification occurs in the Sahel region owing to the harsh ecological environment.The"Green Great Wall" (GGW) ecological environment project of the Sahel region was proposed to combat desertification,which aimed to construct a tree belt from the west to the east of Africa(Goffner et al.,2019).The shelterbelt intends to adjust the temperature along the pathway,reduce the rate of wind erosion of soil,and increase the moisture of the local microclimate (Wade et al.,2018;You et al.,2019).
The main objectives of this study were to:(1) explore reasonable RS ecological indicators for the Sahel region;(2) determine the ecological environment change trend over the last 20 a in the Sahel region;(3) construct the RSEI model for the Sahel region;and (4) predict future ecological environment changes in the Sahel region.Moreover,this research offers an academic reference for the construction of the GGW.
2 Study area and data
2.1 Study area
The Sahel region encompasses the area from the Senegal in the west to the Eritrea in the east of Africa;it lies between the Sudan Savanna zone and the arid Sahara Desert,with a mean width of approximately 350 km.The Sahel region also has numerous wetlands,including the Senegal Delta,Niger River,and Lake Chad region (Moser et al.,2014).The area of the Sahel region is mostly divided by annual precipitation.As shown in Figure 1,the Sahel region has an annual isohyet of 150 mm on its northern border and 700 mm on its southern border (Le and Henri,1989).This region has a dry climate and frequent sandstorms.Due to the rapid growth of population,farmland and pastoral areas are continuously expanding,resulting in ecological environment deterioration and spread of desertification (Tucker et al.,1985;Scheffer et al.,2001).The conception of the GGW was introduced to manage the ecological environmental conditions caused by climate change and human activities in the Sahel region,which was later gradually developed into the current GGW ecological environment project (Goffner et al.,2019).The latitude of the areas of the GGW ecological environment project is similar to that of the Sahel region of Africa.There is a huge spatial overlap between the areas of the GGW ecological environment project and the Sahel region of Africa.
2.2 Data
Moderate-resolution Imaging Spectroradiometer (MODIS) data (https://lpdaac.usgs.gov/products/,2001-2020) with a spatial resolution of 500 m were used as the datasets for the analysis,including the MOD09A1 surface reflectance within an 8-d composite and MCD43A3 albedo within a 16-d composite.We used the Google Earth Engine (GEE) to remove clouds in the MOD09A1 surface reflectance within an 8-d composite (https://earthengine.google.com/).There are a small number of unevenly distributed meteorological stations in Africa,and therefore precipitation data in the ERA5(ECMWF Reanalysis v5) dataset (https://cds.climate.copernicus.eu/#!/home) were used to process and calculate the annual mean precipitation data.Furthermore,annual isohyets of 150 and 700 mm were extracted to delimit the scope of the Sahel region.In addition,the total precipitation in the months from May to October in the Sahel region during 2001-2019 was calculated.We used GlobeLand30 production (http://www.globallandcover.com/) in 2020 as land classification data.We adopted the water products of Joint Research Centre (JRC)(https://global-surface-water.appspot.com) to reduce the influence of water on the experimental results,and used water areas from 2001 to 2020 as masks to remove water areas from the MODIS image data.Detailed information regarding the data is shown in Table 1.
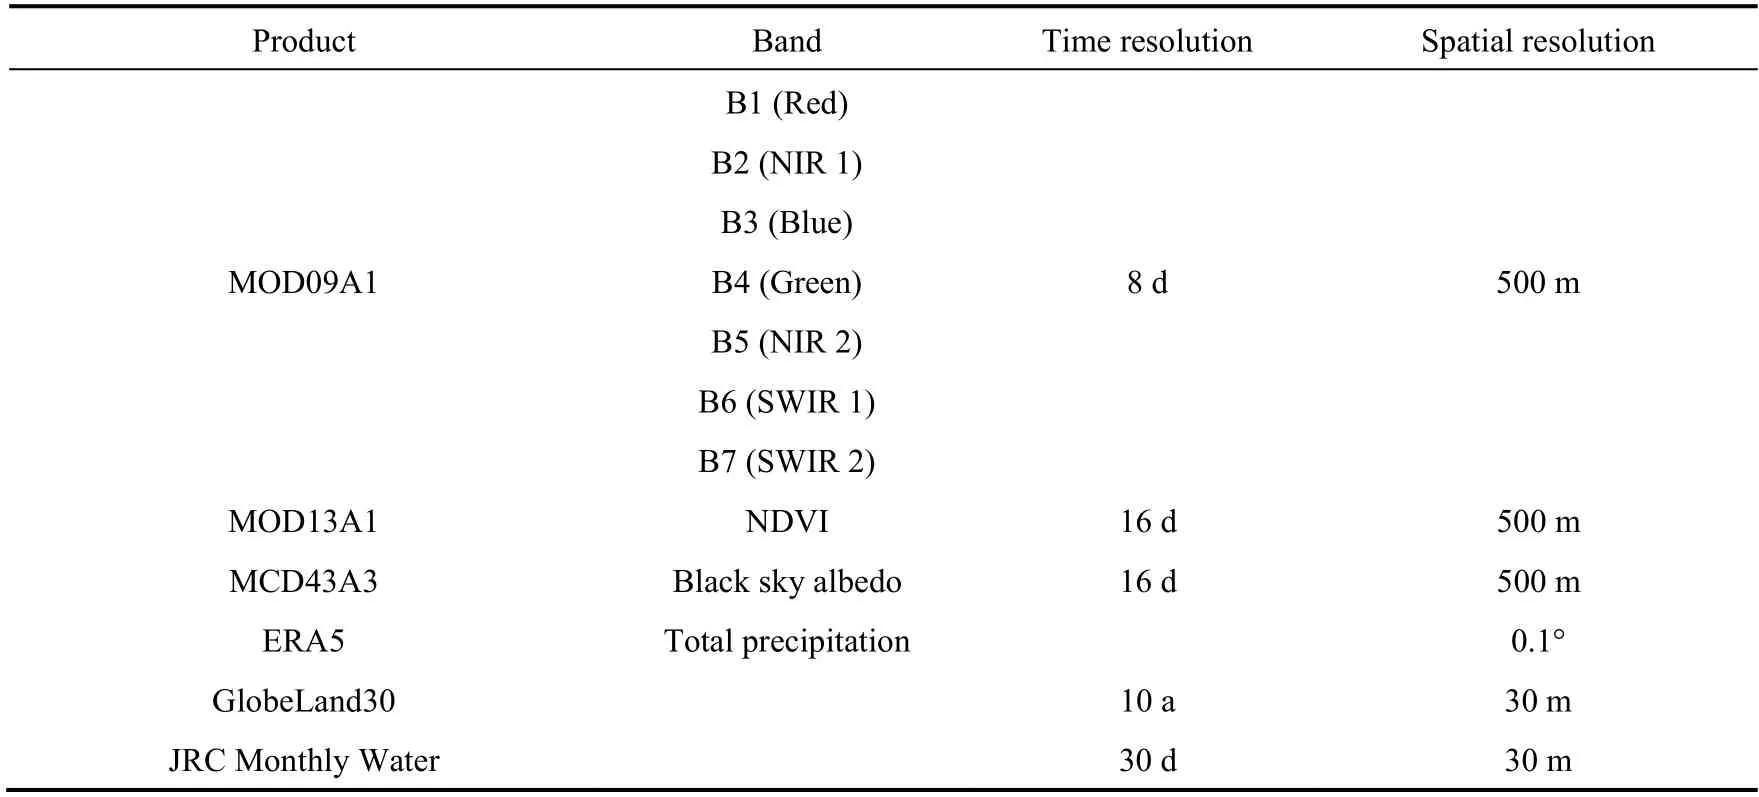
Table 1 Data products used in the study and their spatial-temporal resolutions
3 Methods
3.1 RSEI
RSEI was used to monitor the ecological environment,as proposed by Xu et al.(2019),based on four indicators (moisture,greenness,heat,and dryness) and RS data.The RSEI model has demonstrated a good performance in evaluating the ecological environment of different regions (Gou and Zhao,2020;Jing et al.,2020;Wen et al.,2020).This method also has some limitations;that is,because the indicator of heat is based on urbanization,a large error may occur when the method is used to evaluate the ecological environment without cities (Shao et al.,2020).The ecological environment in the Sahel region is fragile and desertification is serious (Toure et al.,2019).Furthermore,the temperature has been increasing in this region during recent decades (Diedhiou et al.,2018).Therefore,taking the heat indicator as an ecological environment evaluation index may cause inaccurate results.In this study,we removed the heat indicator and included the reverse desert difference index (RDDI) as part of the improved RSEI model,based on the ecological environment of the Sahel region.The improved RSEI model is as follows:

where RSEI is the remote sensing ecological index;NDSI (normalized dry soil index) represents the ecological environment dryness;WETI (wet index) represents the ecological environment moisture;NDVI (normalized difference vegetation index) represents the ecological environment greenness;RDDI represents the ecological environment desertification degree;andfis the principal component analysis(PCA) method,which is used to extract the first principal component band.Here,PCA is a statistical method to transform a group of correlated variables into irrelevant variables through orthogonal transformation,and these transformed variables are called principal components to reduce the dimension and simplify the dataset (Jolliffe and Cadima,2016).
Generally,if the calculated RSEI value was high,it represented the region with a healthy ecological environment;by contrast,if the calculated RSEI value was low,it represented the region with a poor ecological environment (Xu et al.,2019;Ning et al.,2020).In this study,after PCA was conducted for the years 2004,2005,2008,2010,2018,2019,and 2020,we found that the low RSEI value represented the region with a healthy ecological environment,whereas the high RSEI value represented the region with a poor ecological environment.Then,we subtracted the RSEI value of the above years from 1,so that the high value represented the region with a healthy ecological environment and the low value represented the region with a poor ecological environment (Xu et al.,2019;Ning et al.,2020).
3.1.1 Dryness indicator
The dryness indicator,reflecting the degree of surface dryness in a region,was obtained by combining the bare soil indicator and the index-based built-up indicator (Rikimaru,2002;Xu,2008;Liao and Jiang,2020).The dryness indicator is expressed as follows:
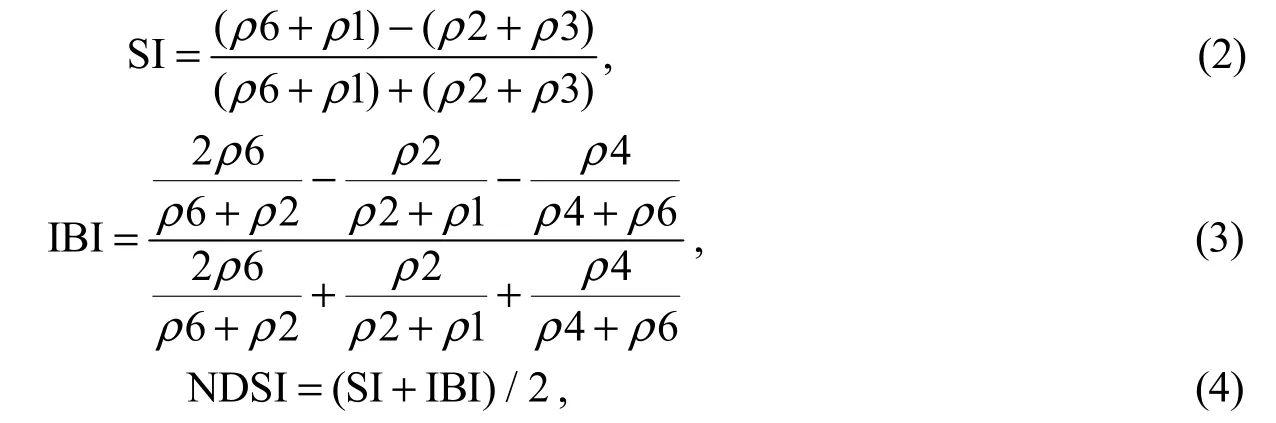
where SI is the bare soil indicator;ρ1-ρ7 denote bands 1-7 of the MODIS image data,corresponding to the red band,near infrared 1 band,blue band,green band,near infrared 2 band,short-wavelength infrared 1 band,and short-wavelength infrared 2band,respectively;and IBI is the index-based built-up indicator.
3.1.2 Moisture indicator
The moisture indicator reflects the humidity of water body,vegetation,and soil.Based on the research results of Lobser and Cohen (2007),we adopted the Tasseled Cap Transformation method to obtain the moisture indicator by using MODIS09A1 data.The formula is as follows:

3.1.3 Greenness indicator
The NDVI represents surface vegetation characteristics (Carlson and Ripley,1997);it was selected as the greenness indicator.The calculation formula is as follows:

3.1.4 Desertification indicator
In this study,the desertification difference index (DDI) model was used (Ma et al.,2011).We subtracted the normalized DDI value from 1 to obtain the RDDI value.The closer the RDDI value was to 1,the more serious the desertification was.The specific extraction steps were as follows:MCD43B3 images and MOD13A1 images from 1 May to 1 October of each year during the period of 2001-2020 were spliced using the GEE platform;albedo and NDVI values of the Sahel region during the period of 2001-2020 were also extracted and averaged;and totally 19,847 sampling points were established in the Sahel region.The DDI model was established by using the albedo and mean NDVI values of the corresponding sampling points,and then the RDDI model was derived.The formulas are as follows:
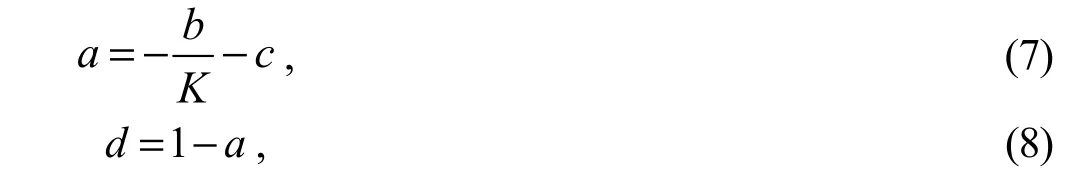
whereais the DDI value;Kis the slope of the correlation between albedo and NDVI values;bandcare the NDVI and albedo values,respectively;anddis the RDDI value.
3.2 Linear regression
We used the linear regression method to analyze the interannual variation characteristics of RSEI from 2001 to 2020 (Bashir et al.,2020;Wu et al.,2020).The formula is as follow:
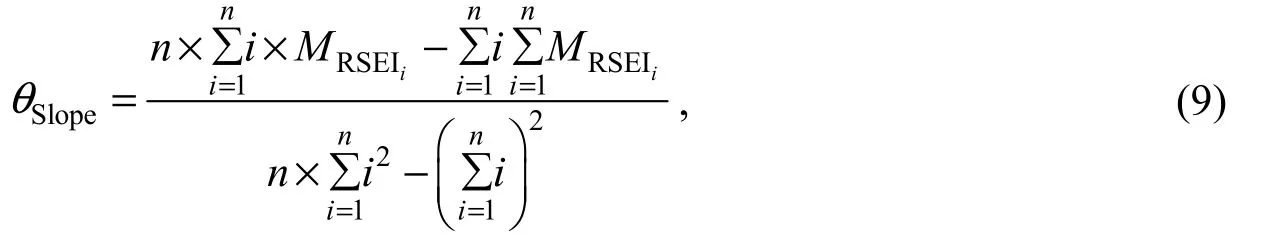
whereθSlopeis the slope of RSEI variations;nis the number of years in the monitoring period;andMRSEIiis the RSEI for theithyear.WhenθSlope>0,RSEI showed an increasing trend during the studiednyears;whenθSlope<0,RSEI showed a decreasing trend during the studiednyears;and whenθSlope=0,RSEI maintained a constant trend.
3.3 Fluctuation analysis
The coefficient of variation (CV) analysis method can effectively reveal the data fluctuation(Kesteven,1946);in this study,it was used to analyze the RSEI fluctuation in the Sahel region from 2001 to 2020.The formula is as follows:

where CVRSEIis the coefficient of variation of RSEI;σRSEIis the standard deviation of RSEI data;and RSEImeanis the mean RSEI value.The CV can be used to measure the variation of the overall ecological environment in the Sahel region.A higher CV value indicated the greater volatility in the time series (Wu et al.,2020).
3.4 Stepwise regression analysis
The stepwise regression analysis method is the synthesis of the forward introduction and backward elimination methods,and it incorporates the advantages of both methods (Pope,1970).The basic idea is that the selected variables will be removed when they become unimportant after the introduction of new variables (Birth,1985).The removed variables can be included in the equation if the new variables are not important after introduction.To ensure that the regression equation contained only the variables with significant influence on dependent variable prior to the introduction of new variables,each variable that was introduced or removed from the regression equation was subject to theFtest.In this study,we used this method to deduce and test the four indicators that affected the RSEI,eliminate insignificant variables,and establish the RSEI model in the Sahel region.
3.5 Correlation analysis
Correlation analysis is a tool to reveal the correlation between different variables.We used this method to study the relationship between RSEI and precipitation.
3.6 Hurst index
The Hurst index is an important tool to analyze the time series change of data (Liu et al.,2017;Tong et al.,2018).In recent years,it has been used to monitor vegetation change trends (Tong et al.,2018).Thus,we regarded the Hurst index as an important indicator to monitor the RSEI changes in this study.RSEI values in the past 10 a were selected for the Hurst index analysis in this study.When the Hurst index (HI)=0.5,the time series is completely independent,showing no evident correlation or only a short-term correlation;when 0.0<HI<0.5,the future change is opposite to the past change,and the closer the HI is to 0.0,the stronger the anti-persistence will be;when 0.5<HI<1.0,the future change is consistent with the past change,and the closer the HI is to 1.0,the stronger the persistence will be.
4 Results
4.1 Extraction of RDDI
Figure 2 shows an obvious negative correlation between albedo and NDVI,i.e.,albedo increased with the decrease of NDVI.According to the frequency analysis,the most values of albedo and NDVI ranged from 0.23 to 0.68 and 0.20 to 0.60,respectively.Then,the RDDI model of the Sahel region was obtained as follows:
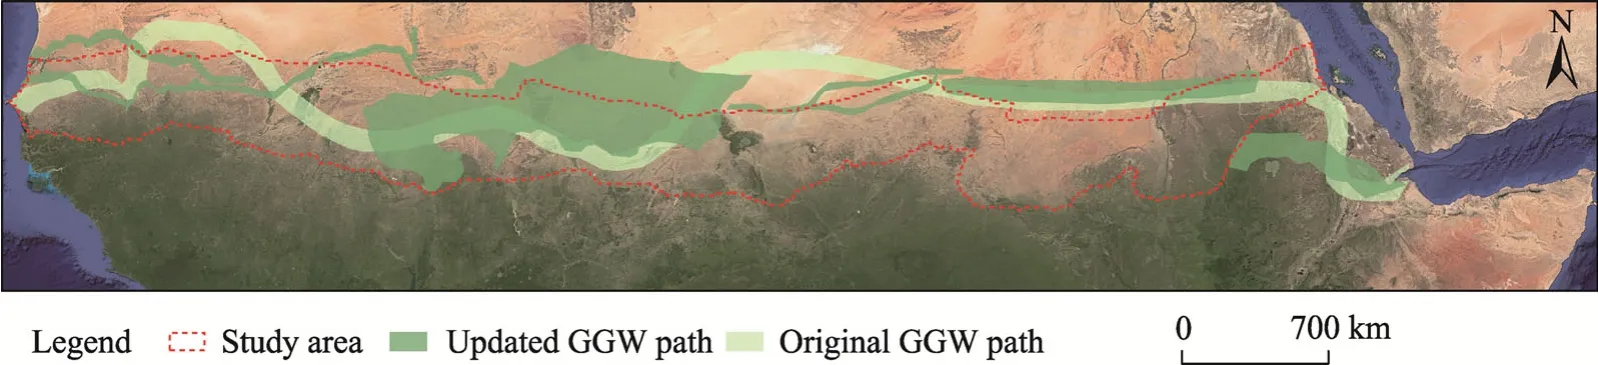
Fig.1 Location of the Sahel region in Africa (study area) and the paths of the ′Green Great Wall′ (GGW)ecological environment project

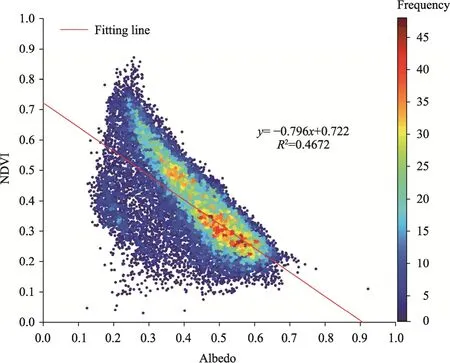
Fig.2 Correlation between albedo and normalized difference vegetation index (NDVI).The red line represents the best linear fit,and colors represent the frequency of point-to-point overlap
As shown in Figure 3,values of RDDI in the Sahel region were not evenly distributed (mean value of 0.50),demonstrating the spatial heterogeneity of the desertification degree in the Sahel region.The RDDI also showed gradient characteristics with a gradual increase from south to north.The RDDI values around rivers (Senegal River and Niger River),lakes (Lake Chad),and wetlands were significantly lower than those at the same latitudes,because soils around rivers,lakes,and wetlands was relatively moist and vegetation growth was well developed (Zoffoli et al.,2008;Thakur et al.,2012).
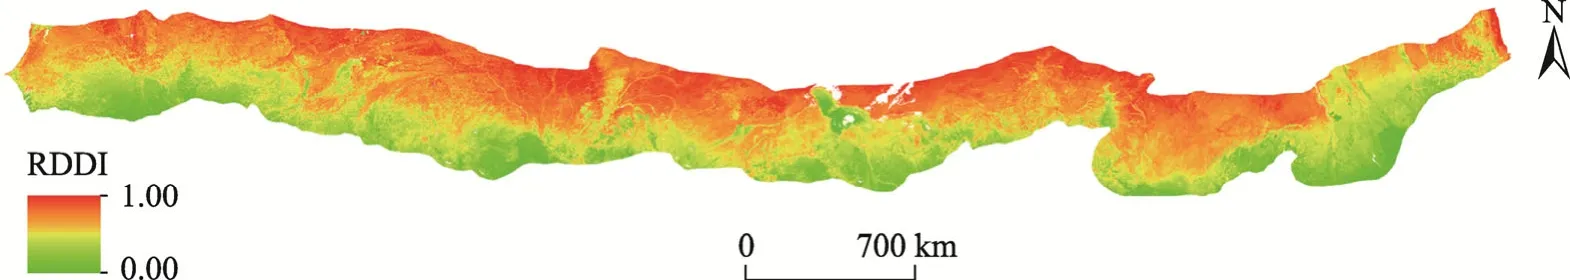
Fig.3 Spatial distribution of mean reverse desert difference index (RDDI) in the Sahel region during the period of 2001-2020
4.2 Principal component analysis (PCA) of RSEI
In this study,we only provided the PCA results of 2001,2006,2011,and 2016 due to the large amount of data.Table 2 shows that the contribution rates of the first principal component (PC1) for the four phases (2001,2006,2011,and 2016) of data were higher than 90.00%,indicating that the PC1 accounted for more than 90.00% of the indicator characteristics of the original data after the process of the PCA,thus better reflecting the data of the four indicators.Second,for the PC1,NDVI and WETI were higher than zero and NDSI and RDDI were less than zero,showing that NDVI and WETI had positive effects on RSEI,whereas NDSI and RDDI had negative effects on RSEI.Finally,the contribution rate of the PC1 remained almost constant for different years;therefore,it can provide a basis for obtaining RSEI and analyzing its trend.
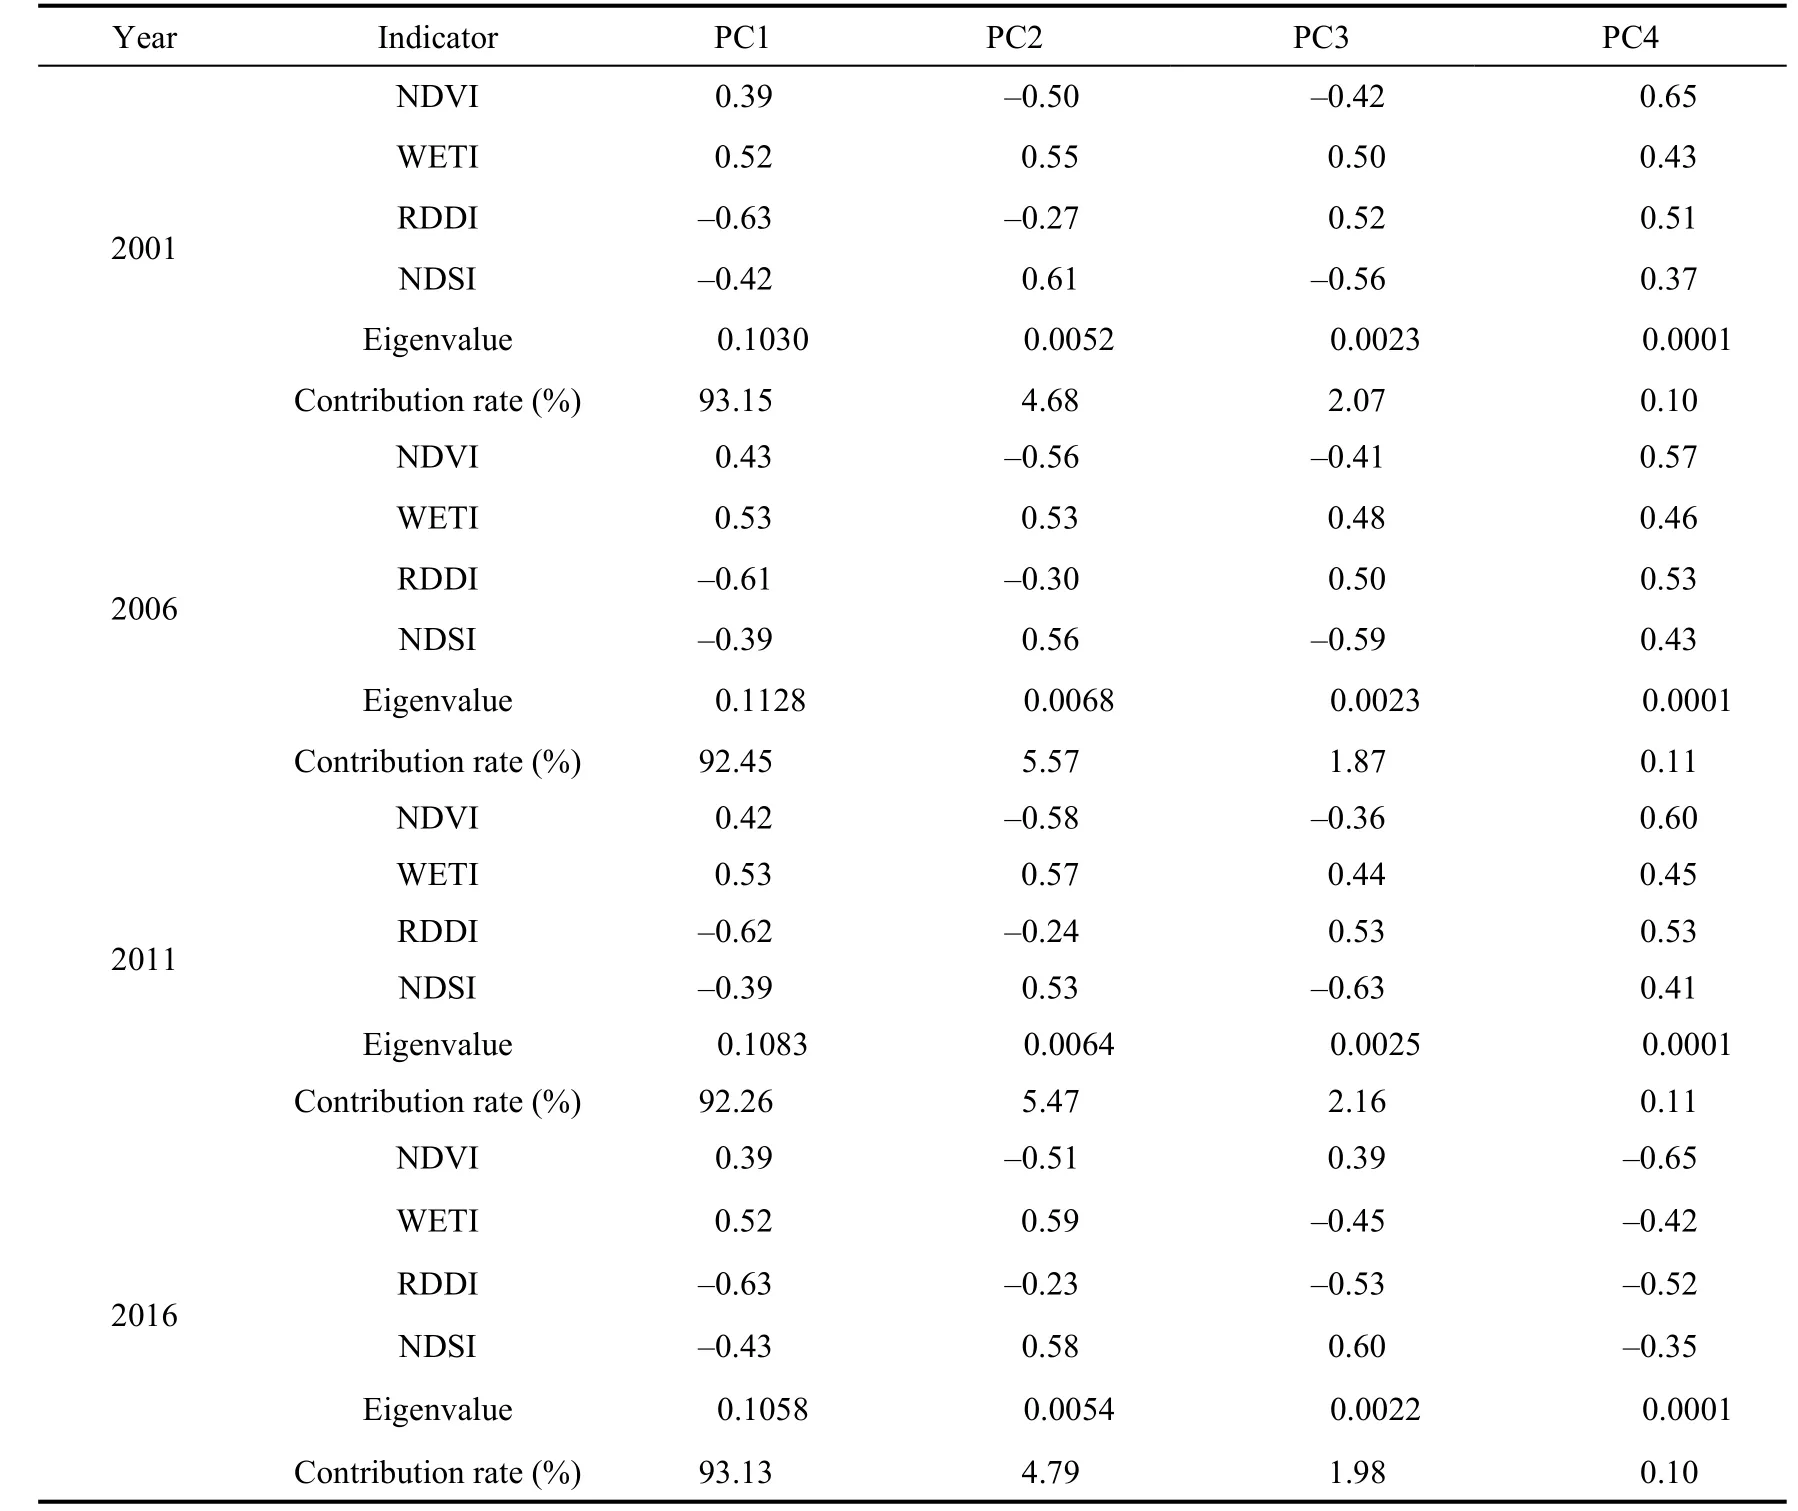
Table 2 Principal component analysis (PCA) results
4.3 RSEI in the Sahel region
Figure 4 shows the spatial distribution of the mean RSEI in the Sahel region during the period of 2001-2020.The mean RSEI value in the Sahel region was 0.40,and the value in the southernregion was obviously larger than that in the northern region (Fig.4).However,some areas demonstrated non-zonal characteristics.For example,RSEI value near the Lake Chad was higher than that at the same latitude area due to the humid microclimate in the Lake Chad (where there is an abundance of vegetation).Meanwhile,RSEI value of the eastern Nile River region was high due to the large cultivated land area.As a result,the eastern Nile River region had higher greenness and moisture degrees and lower desertification and dryness degrees.Here,we selected regions A(13°35′N,30°44′E;Sudan),B (14°50′N,15°10′W;Senegal),and C (11°06′N,34°39′E;Sudan)shown in Figure 4 to analyze the RSEI characteristics according to the high spatial resolution images (Fig.5) obtained from the Google Earth software (Google Inc.,Mountain View,California,America).The mean RSEI values of regions A,B,and C were 0.20,0.40,and 0.75,respectively.Specifically,region A had no vegetation cover and the sandy soil was relatively dry;region B was sparsely vegetated with scattered shrubs,and part of it was cultivated land;and region C had high vegetation coverage and tall trees (Fig.5).Regions A,B,and C represented completely different ecological environments,and the RSEI results also supported this conclusion.Overall,it was possible to use the improved RSEI to better monitor the ecological environment of the Sahel region.
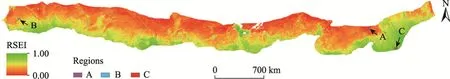
Fig.4 Spatial distribution of the mean remote sensing ecological index (RSEI) during the period of 2001-2020 in the Sahel region as well as in the locations of regions A,B,and C
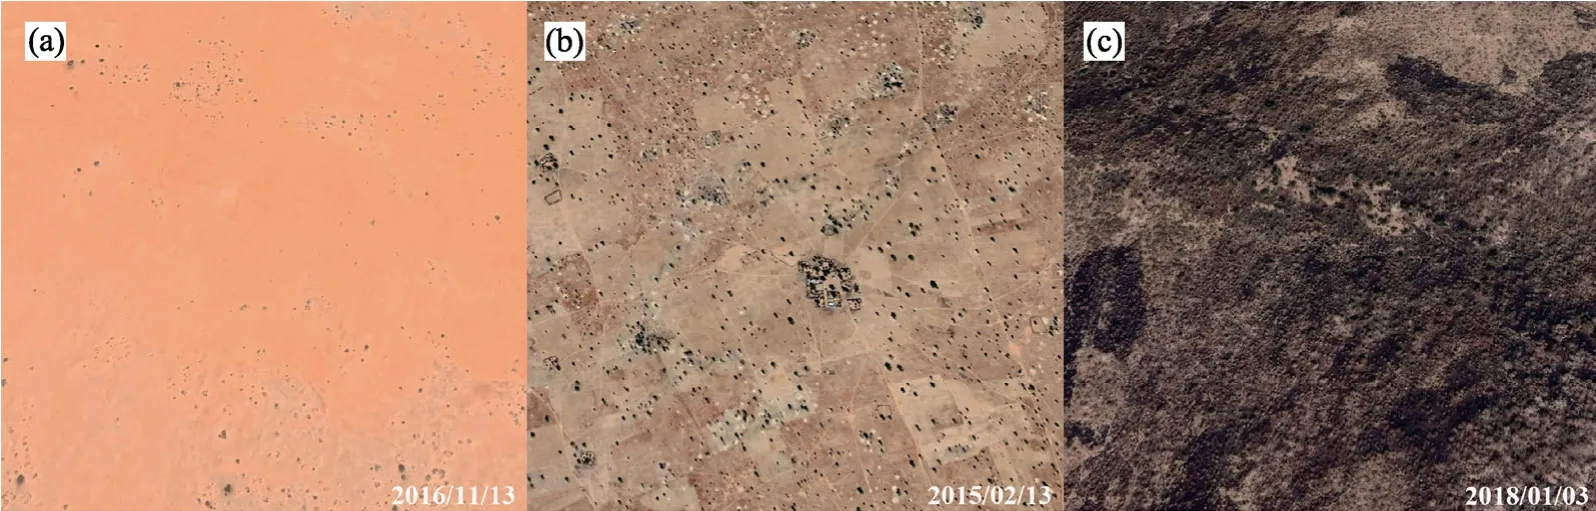
Fig.5 High spatial resolution images of regions A (a),B (b),and C (c) from the Google Earth software.(a),sandy soil;(b),sparse vegetation;(c),trees and shrubs with high vegetation coverage.
The land cover in the Sahel region was divided into seven types:cultivated land,forest,grassland,shrubland,wetland,artificial surface,and bare land (see Fig.6;Table 3).The grassland area (113.92×10⁴km2) occupied the largest proportion,and the artificial surface area (1.02×10⁴km2) occupied the smallest proportion.Specifically,the areas of different land-cover types decreased in the following order:grassland>cultivated land>bare land>shrubland>forest>wetland>artificial surface.However,there were considerable differences in the RSEI values of the different land-cover types.The RSEI of wetland was the highest (0.64),whereas that of bare land was the lowest (0.27).The RSEI values for different land-cover types decreased in the following order:wetland>forest>shrubland>cultivated land>grassland>artificial surface>bare land.
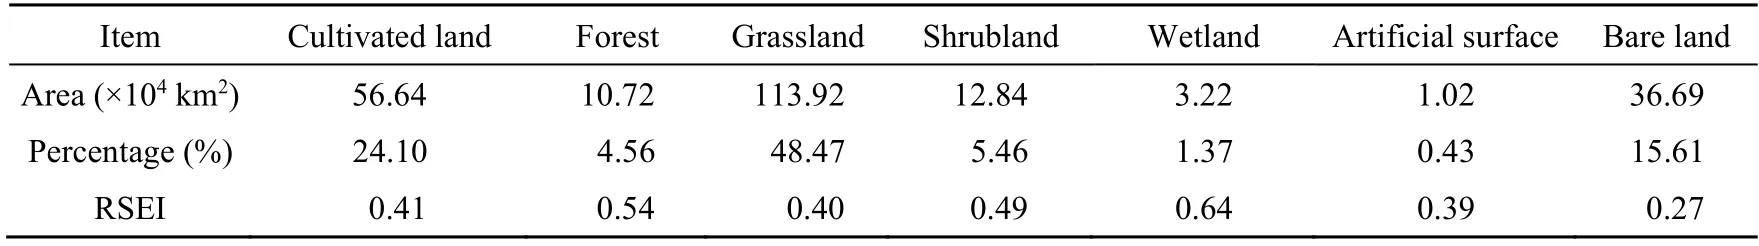
Table 3 RESI values of different land-cover types in the Sahel region
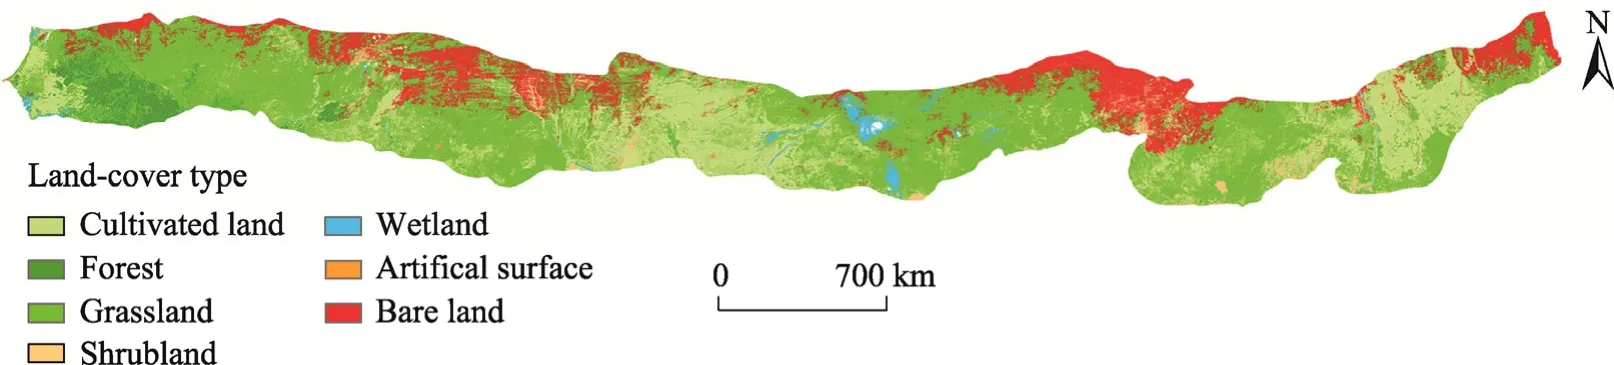
Fig.6 Spatial distribution of land-cover types in the Sahel region in 2020
Figure 7 shows that the correlation coefficients between RSEI and precipitation in the Sahel region during the period of 2001-2020 varied from -0.92 to 0.91,demonstrating evident spatial heterogeneity.The areas with positive and negative correlations between RSEI and precipitation accounted for 67.44% and 32.56% of the entire area,respectively,indicating that RSEI in most areas of the Sahel region showed a positive correlation with precipitation.Figure 8 exhibits an obvious positive correlation between RSEI and normalized precipitation.RSEI showed an increasing trend with the increase of precipitation.According to the frequency analysis,the most RSEI and precipitation values were in the range of 0.19-0.38 and 0.11-0.31,respectively.
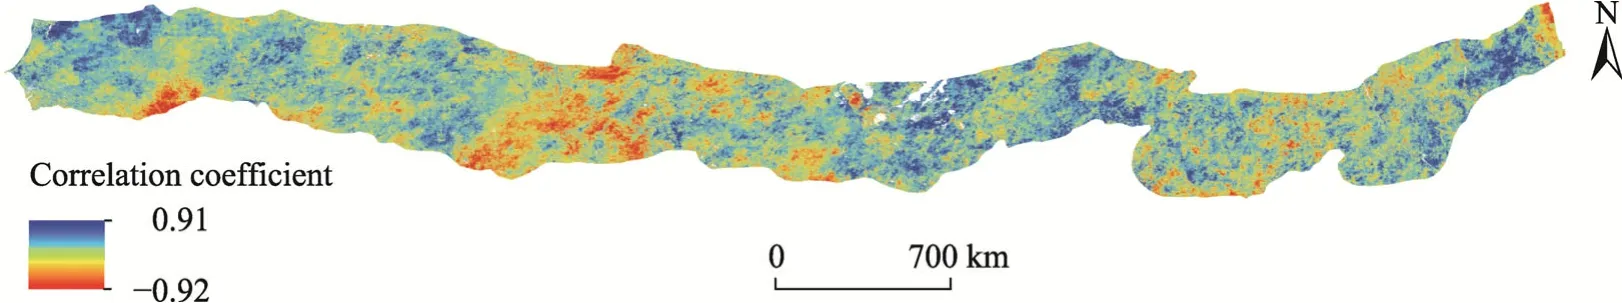
Fig.7 Spatial distribution of the correlation coefficients between RSEI and precipitation in the Sahel region during the period of 2001-2020
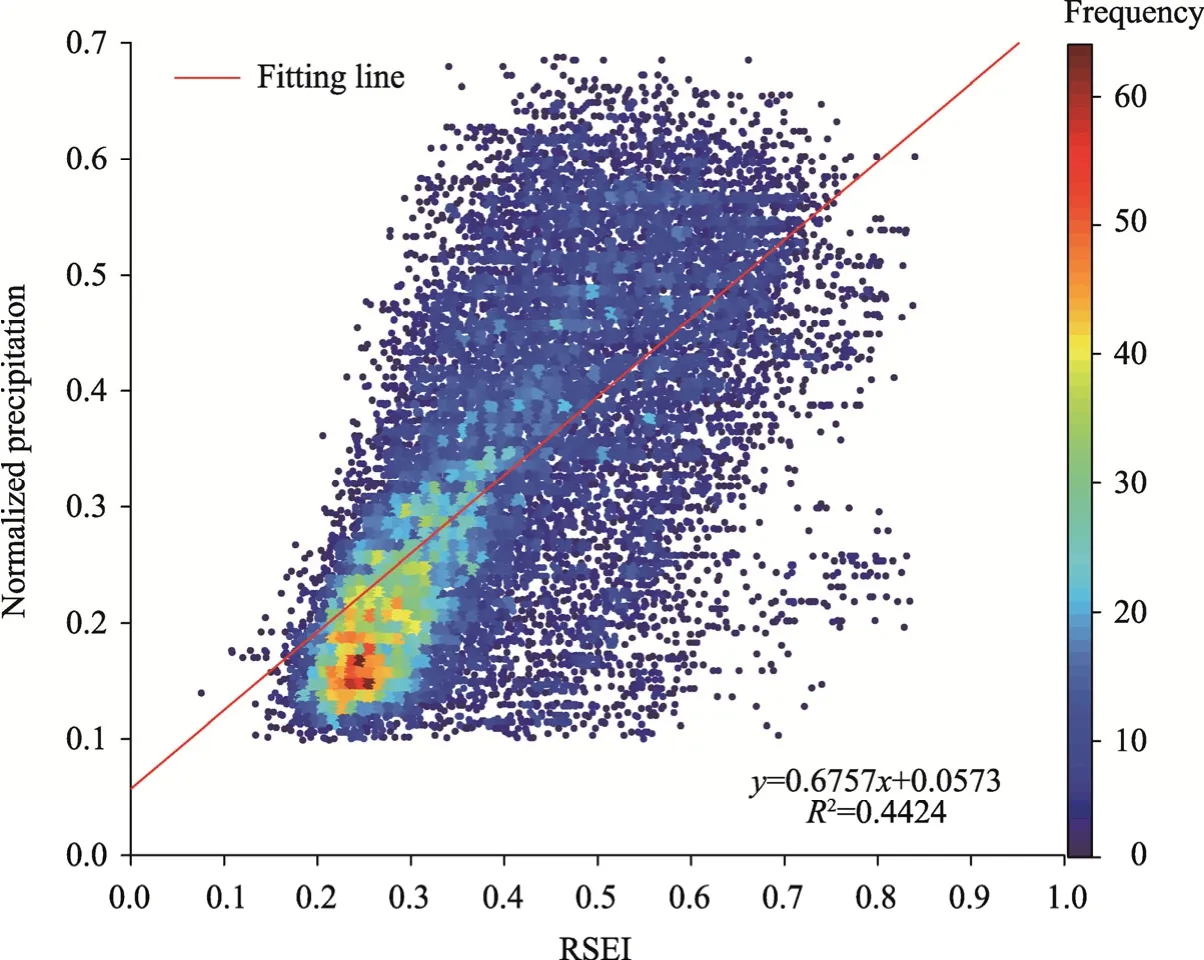
Fig.8 Correlation between RSEI and normalized precipitation.The red line represents the best linear fit,and the colors represent the frequency of point-to-point overlap.
4.4 Changes in RSEI of the Sahel region
4.4.1 Fluctuation analysis
Figure 9 shows the spatiotemporal fluctuations of RSEI;the CV values of RSEI in the Sahel region during the period of 2001-2020 varied from 0.02 to 0.48,demonstrating evident spatial heterogeneity.We divided the CV values of RSEI into five fluctuation levels,i.e.,very low fluctuation,low fluctuation,moderate fluctuation,high fluctuation,and very high fluctuation (Fig.9b;Table 4) (Rey et al.,2017).The area with low fluctuation was the largest,accounting for 31.48% of the total area of the Sahel region.The areas with very low fluctuation and moderate fluctuation were relatively large and accounted for 28.99% and 22.75% of the entire region,respectively.The areas with high fluctuation and very high fluctuation had small proportions,accounting for 12.66% and 4.13% of the entire region,respectively.The CV values of RSEI in the northern Sahel region were evidently larger than those in the southern region.The areas with large fluctuations of RSEI were mainly located in southern Mauritania,southern Mali,and central Chad,whereas the areas with highly stable RSEI values were mainly located in northern Burkina Faso,northern Nigeria,Lake Chad,and most regions of central and southern Sudan.
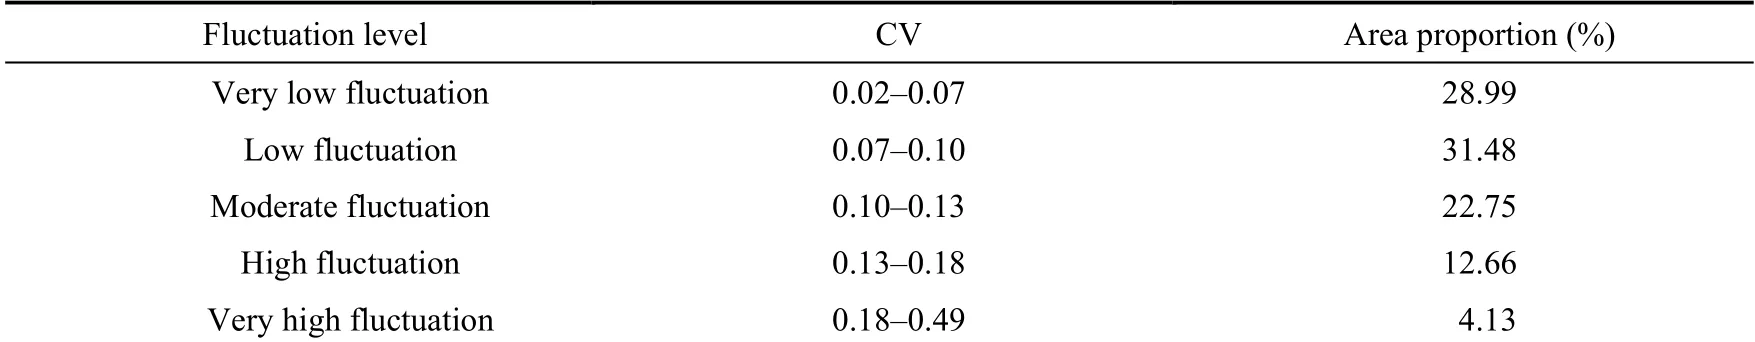
Table 4 Fluctuation levels of the coefficient of variance (CV) values of RSEI in the Sahel region
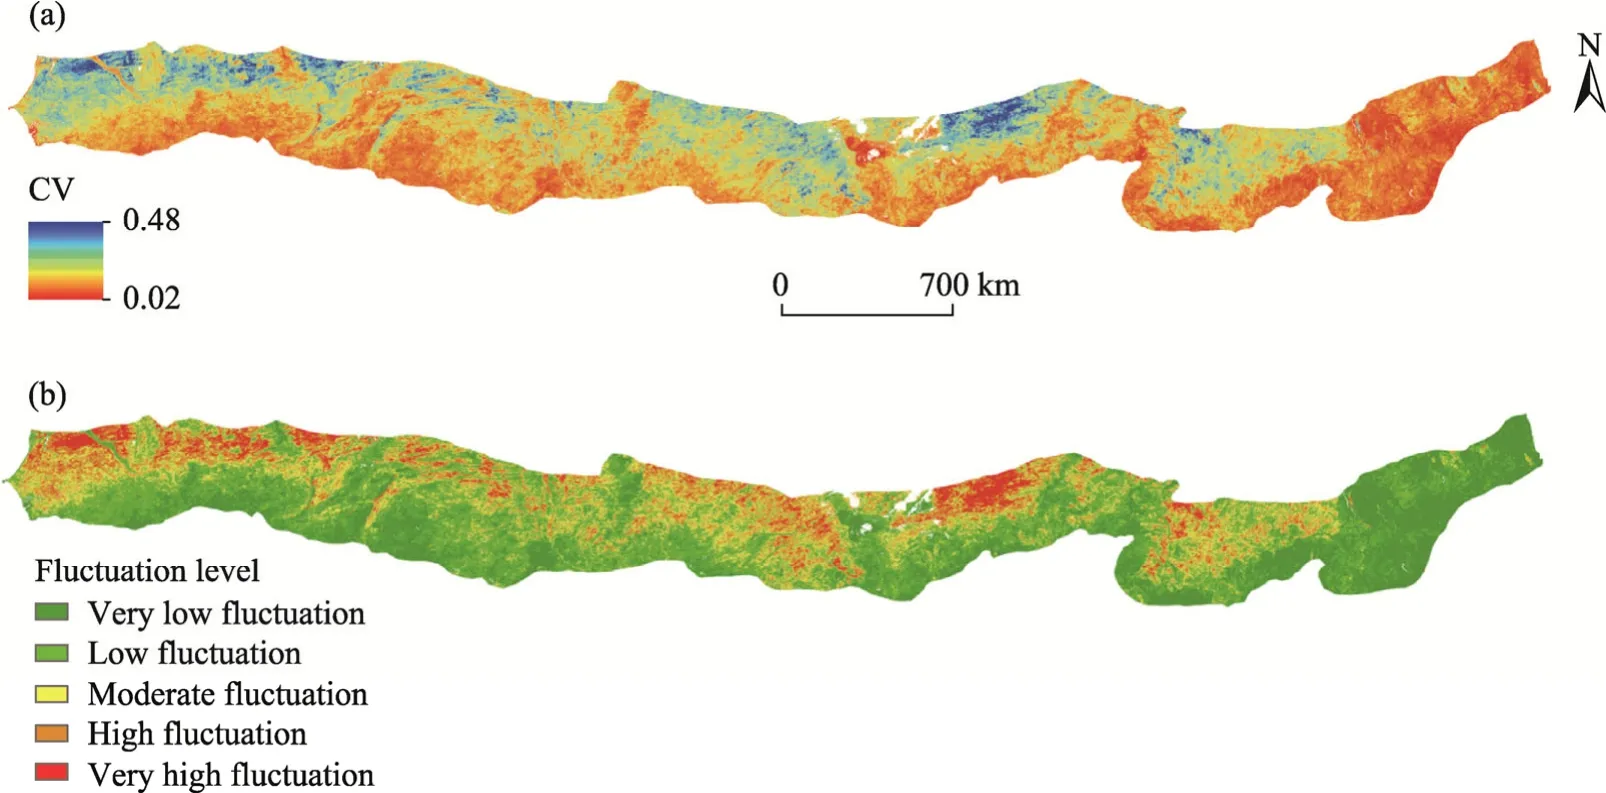
Fig.9 Spatial distributions of the coefficient of variance (CV) values of RSEI (a) and different fluctuation levels of the CV values of RSEI (b) in the Sahel region during the period of 2001-2020
4.4.2 Interannual trend characteristics of RSEI in the Sahel region
As shown in Figure 10,the annual change trend of RSEI in the Sahel region demonstrated spatial heterogeneity during the period of 2001-2020.The areas in which RSEI exhibited decreasing and increasing trends accounted for 53.43% and 46.57% of the whole study area,respectively.In the whole Sahel region,the proportion of areas with increased RSEI was less than that with decreased RSEI.The area with a significantly changing RSEI trend accounted for 23.09% of the whole Sahel region,and the areas in which RSEI increased and decreased significantly accounted for 43.52%and 56.48%,respectively.The RSEI in eastern Senegal,central and western Mali,northeastern Burkina Faso,southwestern Niger,and southern Sudan showed decreasing trends,whereas in the border between Chad and Nigeria and in the border between Chad and Sudan,RSEI showed increasing trends.
We investigated interannual RSEI trends for different land-cover types.The RSEI of grassland(-0.23×10⁻³),forest (-1.33×10⁻³),and cultivated land (-0.36×10⁻³) showed a trend of decline,among which the RSEI of forest was the most significant.The RSEI of wetland (0.93×10⁻³),shrubland (0.30×10⁻³),and artificial surface (0.17×10⁻³) showed an upward trend,among which the RSEI of wetland showed the most significant upward trend.However,the change trend of RSEI for bare land was not obvious.At the same time,we conducted a statistical analysis of RSEI and its trends in different countries within the Sahel region,as shown in Table 5.Burkina Faso and Sudan had higher RSEI values of 0.46 and 0.45,respectively.The RSEI values in Mauritania and Nigel were lower,both at 0.26.The RSEI of the Sahel region had obvious spatial heterogeneity at a national scale.Different countries had different linear variation trends in RSEI,among which Senegal and Mauritania showed large decreasing trends,whereas Sudan and Chad showed large increasing trends.
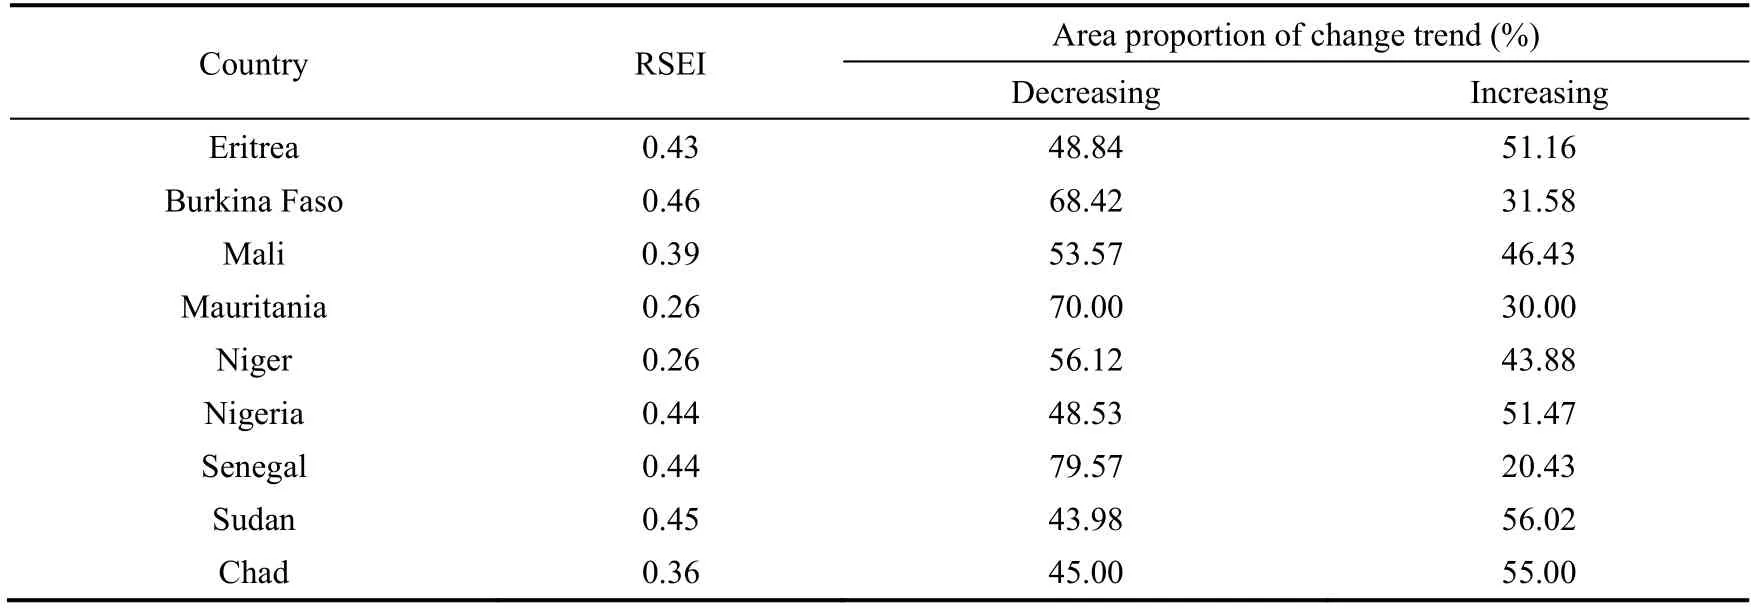
Table 5 RSEI and its trends in different countries within the Sahel region
4.5 Ecological environment modeling in the Sahel region
In order to quantitatively describe the ecological environment of the Sahel region,we established the ecological environmental quality model for the region.Specifically,we extracted 3000 random points generated in each year in the Sahel region,including RSEI,NDVI,NDSI,RDDI,and WETI.We then screened the random points and obtained a total of 59,394 effective sample points.The RS ecological environment quality model of the Sahel region was obtained by using the stepwise regression method:
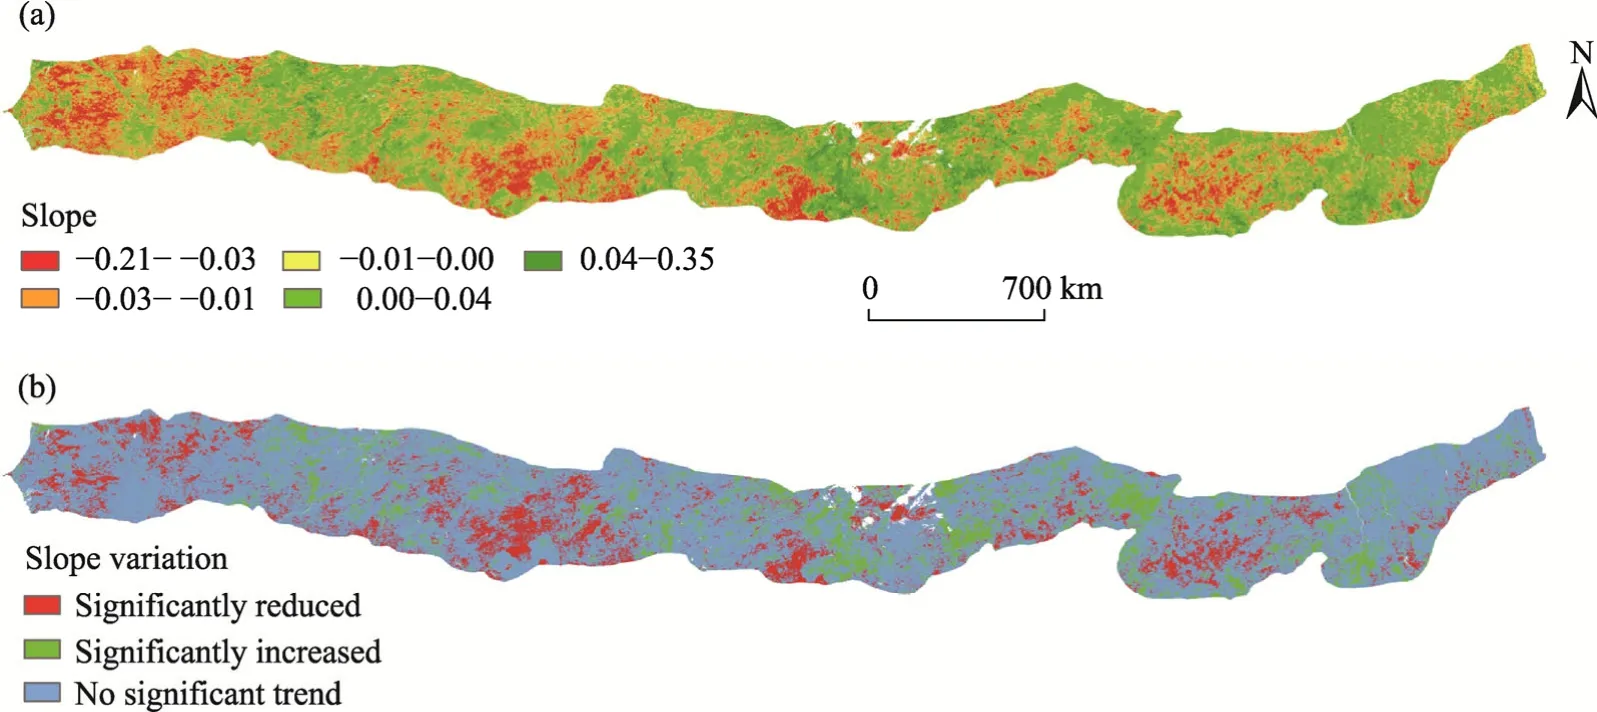
Fig.10 Spatial distributions of RSEI trend in the Sahel region during the period of 2001-2020.(a),the slope of RSEI change trend;(b),significance test of slope variation.

Figure 11 shows that WETI and NDVI were positive indicators for RSEI,whereas RDDI and NDSI were negative indicators for RSEI.Four indicators (WETI,NDVI,RDDI,and NDSI) were retained after the stepwise regression analysis,indicating that these four indicators play a key role in the RSEI model.In general,WETI had the largest influence on the RSEI model,followed by RDDI and NDVI indicators,and NDSI had the smallest influence on the RSEI model.According to the projection of NDSI,RDDI,and RSEI on the three dimensions,RSEI showed a decreasing trend with the increases in NDSI and RDDI,and NDSI showed an increasing trend with the increase in RDDI (Fig.11a).The reason for this may be that NDSI represents the scale of urban buildings and the degree of surface exposure,and the probability and degree of desertification will inevitably increase to some extent with the expansion of impervious surface and surface exposure.Further,according to the projection of WETI,NDVI,and RSEI on three dimensions,RSEI showed an increasing trend with the increases in WETI and NDVI,and NDVI showed an increasing trend with the increase in WETI (Fig.11b).This can be attributed to the fact that precipitation is an important factor that restricts surface vegetation growth in arid and semi-arid regions.The WETI had a high correlation with precipitation.
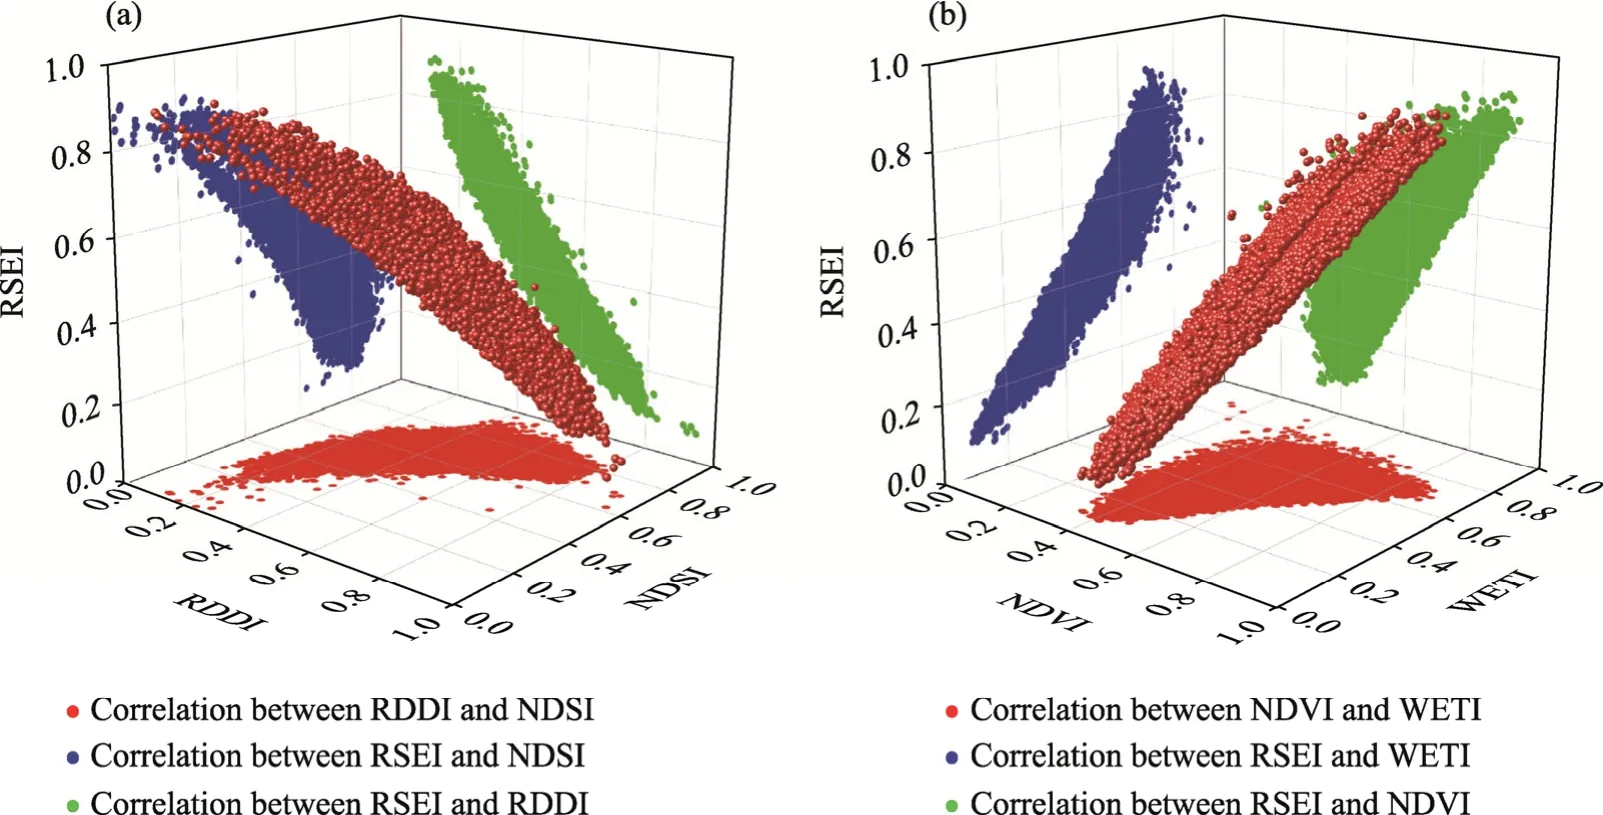
Fig.11 Three dimensions scattered feature maps showing (a) the projection of the correlations among RSEI,RDDI,and normalized dry soil index (NDSI) and (b) the projection of the correlations among RSEI,NDVI,and wetness index (WETI)
4.6 Predicting the ecological environment in the Sahel region
The RSEI from 2001 to 2020 cannot reflect the recent trend of ecological environment changes;therefore,it is less reliable to use it to predict the future trend of ecological environment changes of the Sahel region.Therefore,RSEI values in the past 10 a were selected for the Hurst index analysis in this study.
Figure 12 shows the spatial distributions of the slope of predicted RSEI trend,the HI,and the predicted trend of RSEI in the Sahel region.The areas with increasing RSEI (slope>0.00) and decreasing RSEI (slope<0.00) accounted for 40.71% and 59.29% of the total study area,respectively.In the last decade,the proportions of areas with ecological environment deterioration(slope<0.00) in the Sahel region were greater than the proportions of areas with ecological environment improvement (slope>0.00) (Fig.12a).This result is similar with the finding obtained when we previously monitored the trend of ecological environment change in the Sahel region from 2001 to 2020.The areas with ecological environment deterioration in the Sahel region were mainly distributed in the west of Niger,while the areas with ecological environment improvement were concentrated in the east of Niger.
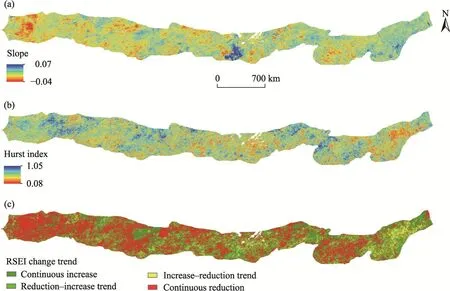
Fig.12 Spatial distributions of the slope of RSEI trend (a),the Hurst index (HI) (b),and the predicted RSEI change trend in the Sahel region in the future (c)
The mean HI of the Sahel region was 0.57.The areas with the HI higher than 0.50 accounted for 72.31% of the entire area,and the areas with the HI less than 0.50 accounted for 27.69% of the entire area.Meanwhile,we combined the RSEI change trend of the Sahel region in the past 10 a with the HI values,and divided the RSEI change trend in the future into four types:continuous reduction,continuous increase,reduction-increase trend,and increase-reduction trend.The areas with these four types accounted for 44.02%,28.29%,15.26%,and 12.42% of the entire study area,respectively.The areas with continuous deterioration of ecological environment were mainly distributed in the western Sahel region,such as the border area of Senegal,Mauritania,Mali,the northeastern area of Burkina Faso,and the southwestern area of Sudan.The areas where the ecological environment continued to improve were mainly distributed in southern Niger,northern Lake Chad.The areas where the ecological environment changed from improvement to deterioration were mostly distributed in the southeastern region of Sudan.Further,the areas where the ecological environment changed from deterioration to improvement were distributed widely in the Sahel region.
Different land-cover types exhibited different RSEI change trends (Fig.13).For bare land,the area in which RSEI continuously increased accounted for the largest proportion (37.52% of the total study area),and the same was true for shrubland and artificial surface (33.12% and 33.37%,respectively).Forest showed the largest proportion (67.80%) of the area with continuous reduction in RSEI.The areas of grassland and bare land showing continuous reduction of RSEI accounted for 45.73% and 43.23% of the total study area,respectively.The total RSEI value for the six land-cover types increased in the following order: wetland>bare land>artificial surface>shrubland>cultivated land>grassland>forest,generally demonstrating an obvious changing trend in the Sahel region.
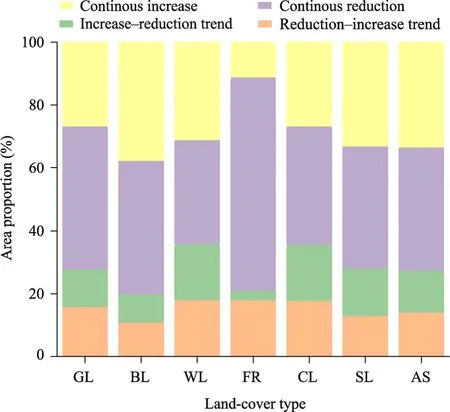
Fig.13 Area proportions of predicated RSEI trend for different land-cover types in the Sahel region in the future.GL,grassland;BL,bare land;WL,wetland;FR,forest;CL,cultivated land;SL,shrubland;AS,artificial surface.
5 Discussion
Previous studies mostly focused on single indicator of NDVI,pollutant concentration,or biodiversity when studying the change trend of the ecological environment while ignored the integrity of the ecological environment (Adams et al.,2012;Firth et al.,2014;Mutti et al.,2020).The current method of RSEI is considered more reasonable than a single indicator for the ecological environment assessment (Liu et al.,2019;Gao et al.,2020;Ji et al.,2020).However,owing to different ecological environment types,using constant indicators to evaluate different ecological landscape changes may cause deviations or errors.Thus,we selected the evaluation indicators for different ecological conditions to evaluate the ecological environment of the Sahel region.Because the Sahel region is a semi-arid region with severe desertification (Wu et al.,2020),we added the RDDI (which represents the degree of desertification) into the RSEI model.The Sahel region has few large-scale urban agglomerations located in the tropical areas where there is less disturbance from human activities;therefore,we removed heat indicator from the original RSEI model.
We evaluated the ecological environment in the Sahel region in the past 20 a based on the improved RSEI model and found that RSEI of the Sahel region exhibited spatial heterogeneity and showed a gradual decrease in gradient from south to north.The Sahel region is a transitional region between Sahara Desert and Savanna.The northern part,which is in the vicinity of the Sahara Desert,is sparsely vegetated,and the land is highly exposed with severe desertification and poor soil moisture,while the southern part of the Sahel region exhibits the opposite characteristics(Foley et al.,2003;Lee et al.,2015).Notably,the gradient-trend of RSEI from north to south has been disturbed in some regions,such as the Lake Chad and the eastern part of the Nile River.Aquatic vegetation is abundant in the vicinity of the Lake Chad (Leblanc et al.,2011),improving the greenness indicator in the RSEI model.Moreover,the high soil moisture of the land around the lake improves the moisture indicator in the RSEI model,correspondingly reducing the degrees of desertification and dryness.There are substantial cultivated lands in the eastern region of the Nile River,and we selected the RS data in the crop-growing season from May to October for analysis.The NDVI and RSEI values of the above regions were obviously higher than those of the regions with the same latitudes.The order of RSEI values for different land-cover types decreased as follows:wetland>forest>shrubland>cultivated land>grassland>artificial surface>bare land.The indicators of the RSEI model were dryness,moisture,greenness,and desertification;among which,WETI and NDVI were positive indicators,while RDDI and NDSI were negative indicators.Wetland had high WETI and NDVI values,while NDSI and RDDI values were lowest among the land-cover types.On the contrary,each indicator of bare land was the opposite to that of wetland;therefore,RSEI of bare land reached the lowest value.The RSEI of grassland,forest,and cultivated land showed an interannual decline trend,which may be related to human grazing activities,deforestation,and excessive reclamation of wasteland for agricultural production (van Keulen and Breman,1990;Mainali,2006;Epule et al.,2014).The RSEI of wetland,shrubland,and artificial surface showed an interannual upward trend;the reasons may be related to the construction of greening projects and climate change (Fensholt et al.,2012;Abiodun et al.,2013).
According to our predictions for the RSEI,bare land with a high continuous increase of RSEI was associated with the "greening" phenomenon caused by large-scale afforestation projects and the increase of precipitation in the Sahel region (Giannini et al.,2008;Kusserow,2017),and the continuous reduced RSEI of grassland may be related to the spread of desertification.The forest with a high reduction of RSEI may be related to the decrease of woody plant coverage caused by the increased grazing and wood demand (Leroux et al.,2017).The RSEI prediction for different land-cover types had randomness,and other land-cover types with insignificant changes were not discussed here.
Precipitation was positively correlated with RSEI.In arid and semi-arid areas,the change of precipitation will significantly affect the local ecosystem,and an increase of precipitation is generally conducive to improving the ecological environment (Fensholt et al.,2012;Xu et al.,2020).The RSEI fluctuations in the Sahel region showed obvious spatial heterogeneity,and the CV values of RSEI in the northern region were significantly greater than those in the southern region,which was likely related to precipitation fluctuations.Figure 14 shows that the CV values of precipitation in the northern region of the Sahel region was larger than those in the southern region.Among the four indicators,moisture indicator was directly related to precipitation.The Sahel region is characterized by a semi-arid climate,and precipitation is a key factor restricting vegetation growth (Huber et al.,2011;Fensholt et al.,2013).Therefore,the fluctuation in annual precipitation had an important influence on the fluctuation of RSEI values.The areas where RSEI increased were smaller than the areas where RSEI decreased.Figures 10 and 15 show similar trends in RSEI and precipitation.However,some differences remained in local areas.For example,because population in Burkina Faso increased by 56.00% since 2000 (i.e.,from 11.60×10⁶in 2000 to 18.10×10⁶in 2015) (FAO,2010),the ecological environment of the northern region showed a deteriorating trend.The rapidly growing population has placed great pressure on agriculture(Knauer et al.,2017).Meanwhile,inadequate land management and agricultural activities have also largely contributed to land degradation in Burkina Faso (Knauer et al.,2017).We found that RSEI in the Sahel region was largely dependent on the moisture indicator,which confirmed that precipitation was a key factor affecting the ecological environment changes in arid and semi-arid areas to some extent (Fensholt et al.,2012).Prediction of the ecological environment in the Sahel region shows that the ecological environment of the western Sahel region will continue to deteriorate in the future.
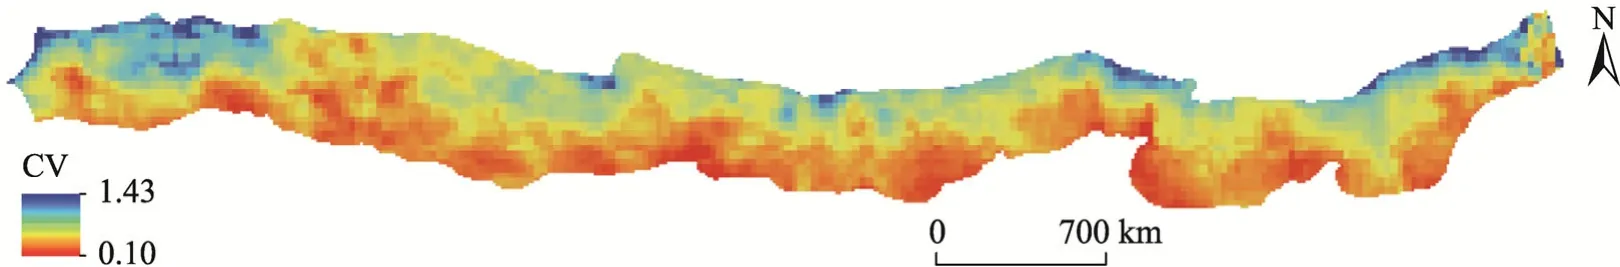
Fig.14 Spatial distribution of CV values of precipitation in the Sahel region from 2000 to 2019
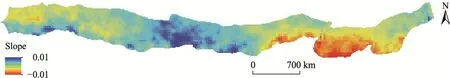
Fig.15 Spatial distribution of precipitation variation trend (expressed as slope) in the Sahel region from 2000 to 2019
According to the results of Monerie et al.(2020),precipitation in the western part of the Sahel region is expected to decrease in the future.The change of precipitation is directly related to the greenness indicator and moisture indicator in this region,which also confirms our prediction that the ecological environment in the western Sahel region will continue to deteriorate in the future.The prediction results also show that the ecological environment in the eastern part of the Nile River presented a trend from improvement to deterioration,owing to the expansion of cultivated area in the east of the Nile River from 3.90×10⁴to 5.00×10⁴km2between 2000 and 2020 (Zika and Erb,2017).
In this study,RSEI was used to observe and predict future changes in the ecological environment in the Sahel region.However,some shortcomings should be noted.First,RESI can observe the changes in the ecological environment;however,the attribution of its change trend can only be expressed qualitatively (rather than quantitatively) by measuring the corresponding ′contributions′of human activities and climate change.Second,specific land-cover types will directly affect the monitoring of RSEI in the Sahel region.For example,a large area of water will directly affect the moisture indicator in the RSEI model.When the cultivated land changed at different periods,such as the area with high vegetation coverage prior to crop harvesting,the positive indicator of RSEI is larger;however,if there is a large amount of bare land after crop harvesting,the positive indicator will decrease,thus affecting RSEI.At the same time,when the wasteland is reclaimed for farmland and shelterbelt is planted,their NDVI will increase in a short time and the RSEI will also increase correspondingly (Estel et al.,2015;Mark,2019;Zhou et al.,2020).However,the increase of RSEI is at the cost of consuming groundwater and fertility,which will cause damages to the original ecological environment.Future research should be combined with field investigations to clarify the phenological changes with different land-cover types and select specific periods for future RSEI observations.Moreover,the attribution analysis of RSEI changes is also very important.
6 Conclusions
The RSEI in the Sahel region showed obvious spatial heterogeneity.From 2001 to 2020,RSEI of grassland,forest,and cultivated land showed a decline trend,while RSEI of wetland,shrubland,and artificial surface showed an upward trend.RSEI and precipitation were positively correlated.The CV values of RSEI in the northern Sahel region were obviously larger than those in the southern region during the period of 2001-2020.The areas in which RSEI values presented an increasing trend were slightly less than the areas in which RSEI values presented a decreasing trend.We then constructed the RSEI model for the Sahel region.Based on the HI analysis method,the areas with RSEI showing continuous reduction,continuous increase,increase-reduction trend,and reduction-increase trend accounted for 44.02%,28.29%,12.42%,and 15.26% of the entire area,respectively.As an afforestation project,the GGW in Africa can effectively improve the positive indicators of RESI.As key regions,more attention should be paid to the areas with continuous deterioration and areas with increase-reduction trend.
Acknowledgments
This research was financially supported by the West Light Foundation of the Chinese Academy of Science(2017-XBQNXZ-B-018),the National Natural Science Foundation of China (41861144020),and the National Key Research and Development Program of China-Joint Research on Technology to Combat Desertification for African Countries of the ′Great Green Wall′ (2018YFE0106000).
- Journal of Arid Land的其它文章
- Spatiotemporal variation of forest land and its driving factors in the agropastoral ecotone of northern China
- Isotope implications of groundwater recharge,residence time and hydrogeochemical evolution of the Longdong Loess Basin,Northwest China
- Lithic soils in the semi-arid region of Brazil:edaphic characterization and susceptibility to erosion
- Spatial variability of leaf wetness under different soil water conditions in rainfed jujube (Ziziphus jujuba Mill.) in the loess hilly region,China
- Neoproterozoic I-type granites in the Central Tianshan Block (NW China): geochronology,geochemistry,and tectonic implications
- Optimal bandwidth selection for retrieving Cu content in rock based on hyperspectral remote sensing