
Spatial variability of leaf wetness under different soil water conditions in rainfed jujube (Ziziphus jujuba Mill.) in the loess hilly region,China
2022-02-23 13:40GAOZhiyongWANGXing
Journal of Arid Land 2022年1期
GAO Zhiyong ,WANG Xing
1 State Key Laboratory of Eco-hydraulics in Northwest Arid Region of China,Xi′an University of Technology,Xi′an 710048,China;
2 School of Agriculture,Ningxia University,Yinchuan 750021,China
Abstract:Leaf wetness provides a wide range of benefits not only to leaves,but also to ecosystems and communities.It regulates canopy eco-hydrological processes and drives spatial differences in hydrological flux.In spite of these functions,little remains known about the spatial distribution of leaf wetness under different soil water conditions.Leaf wetness measurements at the top (180 cm),middle (135 cm),and bottom (85 cm) of the canopy positions of rainfed jujube (Ziziphus jujuba Mill.) in the Chinese loess hilly region were obtained along with meteorological and soil water conditions during the growing seasons in 2019 and 2020.Under soil water non-deficit condition,the frequency of occurrence of leaf wetness was 5.45% higher at the top than at the middle and bottom of the canopy positions.The frequency of occurrence of leaf wetness at the top,middle and bottom of the canopy positions was over 80% at 17:00-18:00 (LST).However,the occurrence of leaf wetness at the top was earlier than those at the middle and bottom of the canopy positions.Correspondingly,leaf drying at the top was also latter than those at the middle and bottom of the canopy positions.Leaf wetness duration at the middle was similar to that at the bottom of the canopy position,but about 1.46-3.01 h less than that at the top.Under soil water deficit condition,the frequency of occurrence of leaf wetness (4.92%-45.45%) followed the order of top>middle>bottom of the canopy position.As the onset of leaf wetness was delayed,the onset of wet leaf drying was advanced and the leaf wetness duration was shortened.Leaf wetness duration at the top was linearly related (R2>0.70) to those at the middle and bottom of the canopy positions under different soil water conditions.In conclusion,the hydrological processes at canopy surfaces of rainfed jujube depended on the position of leaves,thus adjusting canopy structure to redistribute hydrological process is a way to meet the water need of jujube.
Keywords:canopy position;leaf wetness;rainfed jujube;soil water condition;loess hilly region
1 Introduction
Plant leaf wetness is a natural phenomenon occurring when leaves are wetted over their lifetimes due to rain,dew,fog and irrigation (Dawson and Goldsmith,2018).Leaf wetness can increase leaf water potential (Limm et al.,2009),and reduce transpiration rate and vapor pressure deficit.Furthermore,it can reduce water loss,change water balance,maintain carbon dioxide absorption and improve water use efficiency in the ecosystem.Thus,leaf wetness can be beneficial to plant,community and ecosystem (Konrad et al.,2015;Dawson and Goldsmith,2018;GerleinSafdi et al.,2018).Although triggered by several forms of precipitation,leaf wetness is mainly driven by dew in arid areas (Jacobs et al.,2006;Magarey et al.,2006).In arid and semi-arid areas,dew is a common and significant source of water,accounting for 4.5%-77.0% of the total precipitation(Hanisch et al.,2015;Zhuang and Zhao,2017).Leaf wetness driven by dew in the Chinese loess hilly region can be as high as 60.0% (Gao et al.,2020a).
Leaf wetness duration (LWD) is the period from wetting to drying of water on a leaf surface.It is not only a parameter expressing leaf wetness,but is also an index that can be used to reflect plant function,such as leaching,deposition,energy balance and reproduction (Sentelhas et al.,2004;Dawson and Goldsmith,2018).LWD affects the susceptibility of plants to pathogens and primary productivity of agro-ecosystem (Kim et al.,2010).Measurement and modelling are two methods of obtaining LWD (Kim et al.,2010;Rowlandson et al.,2015).However,no uniform standard currently exists for measuring LWD (Tomaszkiewicz et al.,2015),and simulation results from models are sensitive to the changes in input parameters (Sentelhas et al.,2008).Parameters with different time steps can induce uncertainties and errors in model results (Zito et al.,2020).
Research on LWD has mostly focused on crops and grasslands,and the monitoring position of leaf wetness has been limited to the top of canopy (Sentelhas et al.,2008;Park et al.,2019;Wang et al.,2019).Only a few studies monitored LWD at different canopy positions (Igarashi et al.,2018).In fact,due to complex canopy structure and variable canopy micro-meteorology,canopy wetness is variable in both time and space (Bassimba et al.,2017;Binks et al.,2021).Modeled or measured LWD at the top of canopy or at other canopy positions cannot fully reflect the overall state of leaf wetness (Binks et al.,2021).Moreover,there have been only a few studies on the distribution of canopy wetness in forest ecosystem (Aparecido et al.,2016).Additionally,climate change significantly affects LWD.For example,LWD caused by dew is highly sensitive to relative humidity and temperature (Monteith,1957),and climate warming will reduce LWD in arid and semi-arid areas (Vuollekoski et al.,2015;Feng et al.,2021).Under the effects of climate change,reduced LWD will affect water use and energy distribution at different canopy positions,resulting in significant impacts on the ecosystem′s function (Berry et al.,2018;Dawson and Goldsmith,2018).Therefore,predicting the capacity of ecosystem′s function may be largely dependent on an understanding of the spatial variations in leaf wetness (Binks et al.,2021).
Jujube (Ziziphus jujubeMill.) is a tree crop traditionally grown in China.It has been widely cultivated under rainfed conditions in the semi-arid loess hilly region of China for thousands of years.Because it is highly drought-tolerant and has considerable economic benefits,jujube is the main economic plantation in the loess hilly region,covering an area of 1×10⁶hm2(Liu et al.,2013;Chen et al.,2015).Because rainfall cannot completely meet the water demands of vegetation in this region,soil desiccation has become the dominant hydrological phenomenon(Wang et al.,2015).The mechanisms of water use and regulation in jujube in dry soils have been widely studied (Liu et al.,2013;Chen et al.,2014;Chen et al.,2015;Chen et al.,2016;Nie et al.,2017;Ma et al.,2019;Chen et al.,2020).Recent studies have shown that dew has a positive eco-hydrological effect on dryland jujube (Gao et al.,2020b).Dew is a critical potential water source making considerable contributions to the canopy energy budget (Magarey et al.,2006).Under dry soil conditions,however,the spatial distribution of leaf wetness at different jujube canopy positions remains unclear.Clarification of this spatial distribution can deepen insight into the hydrological processes at the canopy level,thereby guiding water management decisions in jujube and other similar crop plantations.Thus,the objectives of this study were to:(1) analyze the state and dynamics of leaf wetness at different jujube canopy positions;(2) explore the duration of leaf wetness at different canopy positions;and (3) find the relationship between these two above parameters.
2 Materials and methods
2.1 Study area
The study area located in the Jujube Demonstration Base in the Mizhi County,Yulin City,Shaanxi Province (38°11′N,109°28′E) with an elevation of 1049 m.This area belongs to a semi-arid climate.Rainfall in the region mainly occurs in July,August and September.The mean annual precipitation is 452 mm,with annual mean temperature of 9°C,solar radiation of 162 W/m2and frost-free period of 160 d.Soil profile in the 0-500 cm layer is loess soil with moderate permeability,uniform texture (7.7% silt,47.8% sand and 44.5% clay),and 1.29-1.31 g/cm3bulk density.Available nitrogen,phosphorus and potassium in the 0-200 cm soil layer are respectively 30.12,1.56 and 89.33 mg/kg.In the upper 100 cm soil layer,soil field capacity and wilting moisture content are respectively 22.06 and 6.66 cm3/cm3.The average groundwater table lies below 50 m from the soil surface.
The area of experimental plot was 2.7 hm2.Dwarf jujube trees were planted in 2003 under rainfed conditions on the 25° east-facing terraced land (Fig.1).The trees were planted in rows spaced 3 m apart with an interrow spacing of 2 m.The mean trunk diameter of jujube trees was 8 cm at about 20 cm above the soil surface.Three main bifurcate branches were maintained on the trunks at about 80 cm above the soil surface.Jujube trees were pruned every 21 d during the growing season to keep the tree height at about 2.0 m and canopy size at 2.2 m×2.2 m.The experiment was conducted during the growing seasons in 2019 and 2020 (Table 1).The meteorological factors monitored during the study period are also given in Table 1.

Table 1 Average values of meteorological factors during the growing seasons in 2019 and 2020
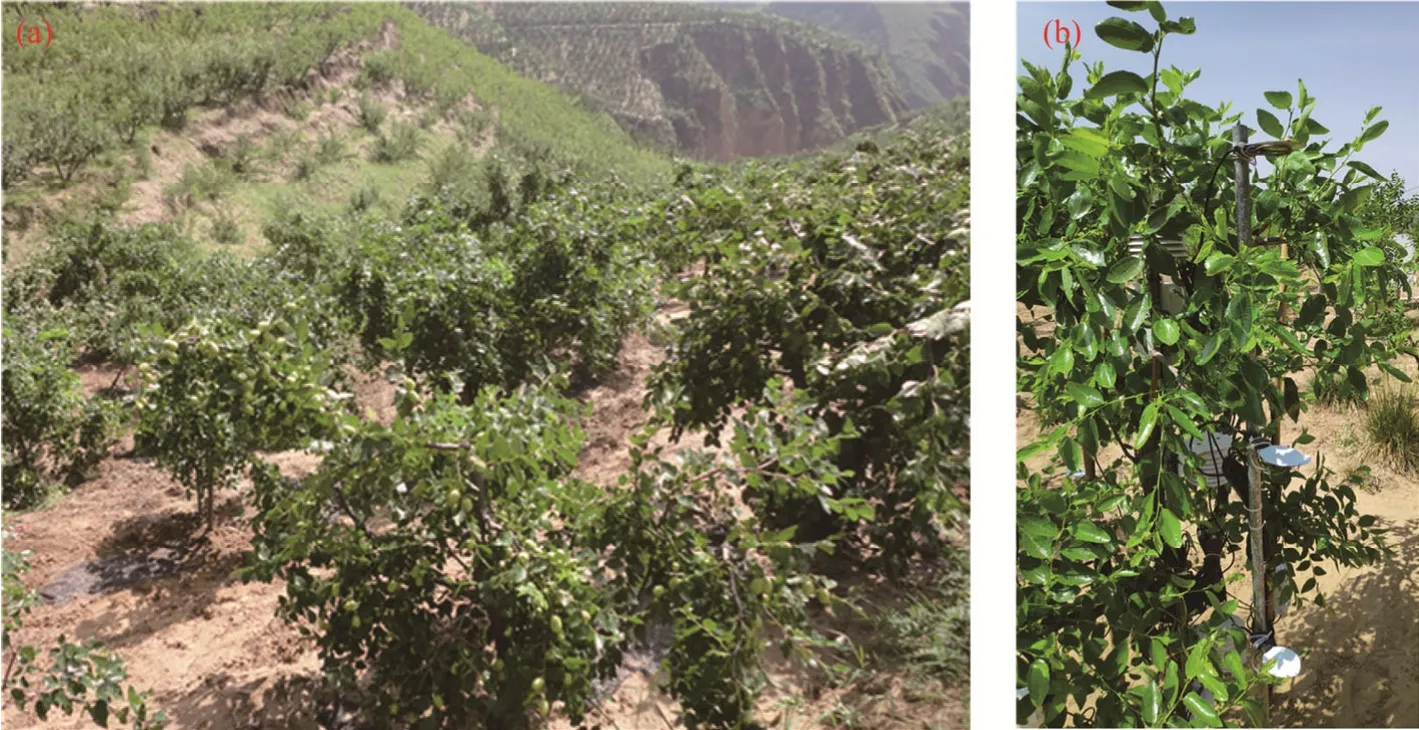
Fig.1 (a),Dwarf jujube trees on the 25° east-facing terraced land;(b),leaf wetness measurement sensors.
2.2 Leaf wetness measurement
Dew and rainfall days during the experiment accounted for 60% and 20%,respectively,of the total observation period.The frequency of light rainfall accounted for over 50% of the rainfall days (Fig.2).Light rainfall was intermittent and dew often fell in between the intermittent rains.Therefore,it was sometimes difficult to determine whether leaf wetness was caused by rain or by dew.Rainfall data recorded at a nearby weather station were used to exclude leaf wetness occurring from rain,and therefore only leaf wetness occurring by dew was analyzed.
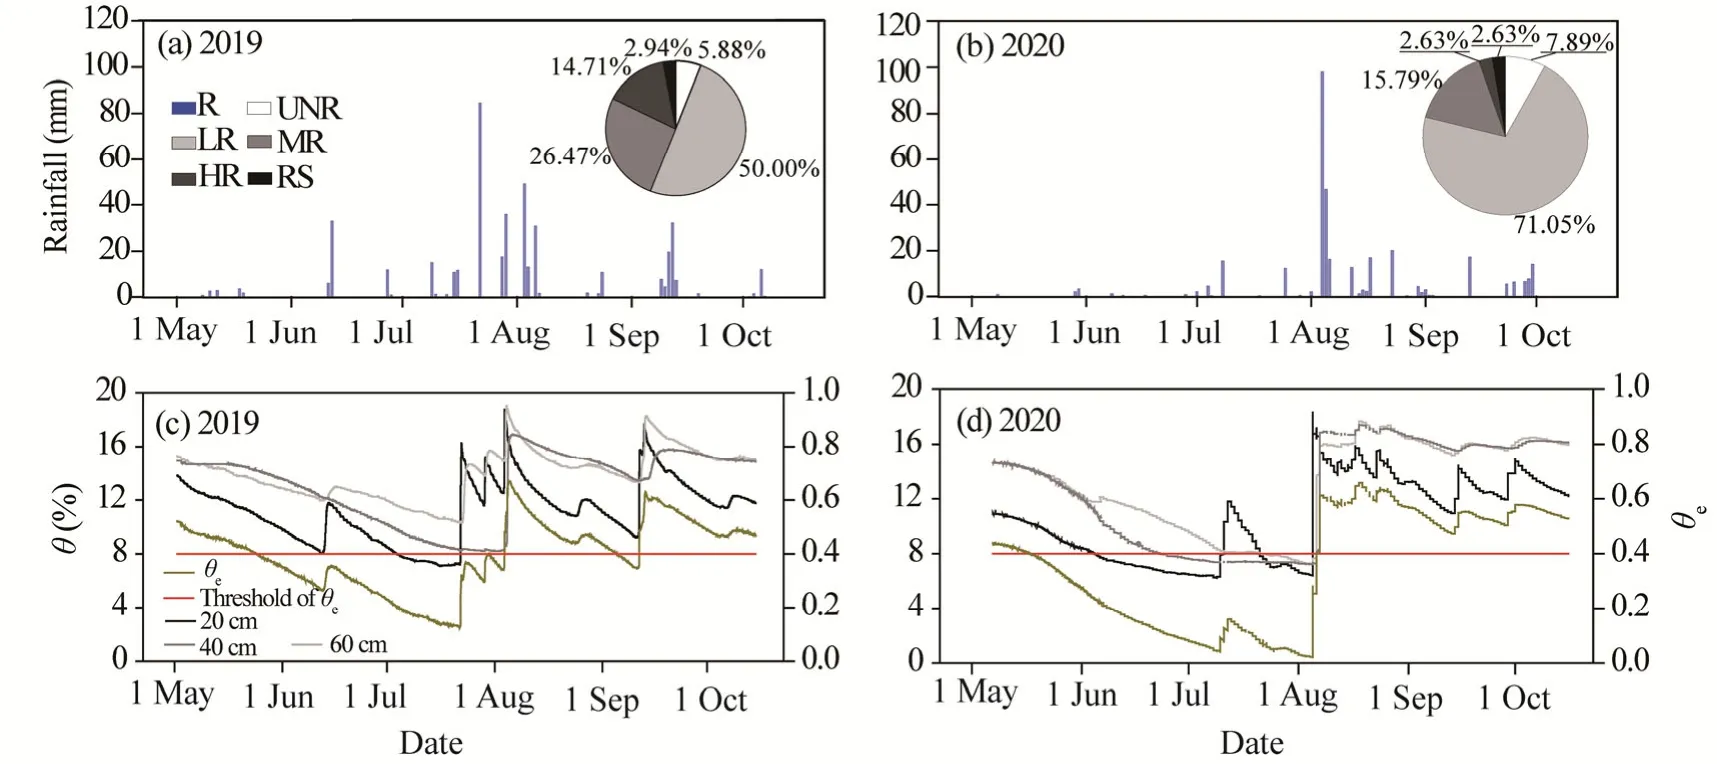
Fig.2 Rainfall (a and b) and soil water (c and d) in the 20,40 and 60 cm soil layers during the growing seasons of jujube in 2019 and 2020.R,rainfall;UNR,ineffective rainfall (<0.5 mm);LR,light rainfall (<10.0 mm);MR,moderate rainfall (10.0-25.0 mm);HR,heavy rainfall (25.0-50.0 mm);RS,rainstorm (50.0-100.0 mm).
There are many types of sensors for measuring leaf wetness.These sensors are made up of different materials and also operated on different principles (Dalla Marta and Orlandini,2010).Thus,there is no unified standard for measuring leaf wetness (Kaseke et al.,2017).Leaf wetness is often caused by dew,and the necessary condition for dew is for surface temperature to be lower than the dew-point temperature.However,differences in dew duration measurements are attributed to the differences in time when the surface temperature of the instrument reaches or falls below the dew-point temperature.In fact,there are biases in some measuring instruments.In this study,the dielectric Leaf Wetness Sensor (LWS,Decagon Devices Inc.,Pullman,WA,USA)was used to measure leaf wetness of jujube.LWS has similar thermodynamic characteristics with real leaf blades and therefore can measure blade wetting time more accurately than other instruments (Ghobakhlou et al.,2016).Visual and tactile observation methods (Sentelhas et al.,2004;Rowlandson et al.,2015) were used to check LWS.The threshold value of LWS sensor was set at 455 raw counts because this value most correctly reflected jujube leaf wetness in the study.When LWS wetness threshold was greater than 455 raw counts,leaves were wet,and when it was less than 455 raw counts,leaves were dry (Gao et al.,2020a).
Three jujube trees were randomly selected for monitoring leaf wetness using LWS sensors.LWS sensors were deployed at 0° relative to the horizontal plane,and with the tips pointed northwards (Kabela et al.,2009).The sensors were installed at the top (180 cm),middle (135 cm),and bottom (85 cm) of the canopy positions of each jujube tree.At each position,leaf wetness was measured using one LWS sensor,resulting in a total of nine LWS sensors.Signals from LWS sensors were automatically recorded every 15 min by EM50 data loggers (Decagon Devices Inc.,Pullman,WA,USA) connected to the sensors.
Daily LWD is the sum of the time of leaf wetness calculated over 24 h,starting at 18:00 (LST)and ending at 18:00 the next day.Equation 1 was used to calculate daily LWD for the three replicates,and the average value was used as the final daily LWD for each canopy position.

where LWD is the daily leaf wetness duration (h);tiis the measured duration of theithleaf wetness event (h);andnis the total number of leaf wetness per day.
2.3 Soil water and meteorological factors
Soil water content in the 20,40 and 60 cm soil layers was measured using GS3 (Decagon Devices Inc.,Pullman,WA,USA) placed 30 cm away from jujube tree trunks.Therefore,a total of nine sensors were used for the three selected jujube canopies.The sensors were connected to EM50 data loggers (Decagon Devices Inc.,Pullman,WA,USA),concurrently recording soil water content every 15 min at the same time as the LWS sensors were recorded.Given long-term soil water deficit in rainfed jujube,we categorized soil water in the 0-60 cm soil layer (Fig.2) based on relative extractable water (θe).Based onθethreshold value (0.4) determined by Chen et al.(2014) for jujube plantation in the loess hilly region,we categorized the state of soil water as:jujube trees were under water stress forθe<0.4 and jujube trees were not under water stress forθe>0.4.Thus,θewas calculated by the following equation (Chen et al.,2014):
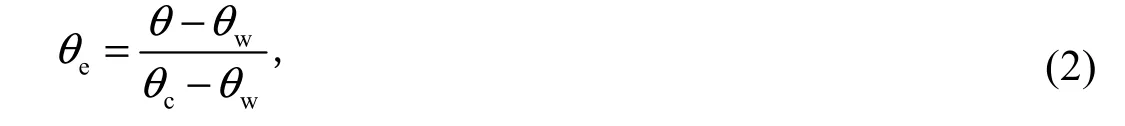
whereθeis the relative extractable water in the 0-60 cm soil layer;θis the average soil water content in the 0-60 cm soil layer (%);θwis the wilting moisture content (%);andθcis the soil field capacity (%).
Three VP-4 sensors (Decagon Devices Inc.,Pullman,WA,USA) were placed at the top,middle,and bottom of the canopy positions to monitor canopy temperature (T) and relative humidity (RH).The data were automatically logged every 15 min by EM50 data loggers (Decagon Devices Inc.,Pullman,WA,USA).The dynamic changes in T and RH at different canopy positions are shown in Figure 3.The relative humidity (RH2m,%),air temperature (T2m,°C),wind speed (v2m,m/s),and rainfall were monitored at 2 m above the soil surface using an automated meteorological weather station (RR-9100,Yugen Technology Co.,Ltd.,China) installed in the experimental field,and data were collected every 30 min.
Soil water at the three measurement layers fluctuated with rainfall.Changes in soil water at the 20 cm layer were large,while soil water was more stable at the 40 and 60 cm layers than at the 20 cm layer.Soil water deficit days accounted for 46.11% in 2019 and 49.69% in 2020 of the total monitoring period.Also,non-deficit days accounted for 53.89% in 2019 and 50.31% in 2020 of the total monitoring period (Fig.2).RH and T at different canopy positions had the same trend with time,but the values varied from year to year.From 21:00 to 07:00 the next day,RH of canopy was 1.49%-6.29% higher in 2019 than in 2020.Then from 08:00 to 18:00,canopy RH was 3.03%-7.41% lower in 2019 than in 2020.T of canopy was 1.05°C-2.38°C higher in 2019 than in 2020 from 07:30 to 18:30 (Fig.3).
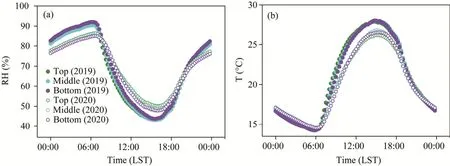
Fig.3 Dynamic changes of relative humidity (RH,a) and temperature (T,b) at different canopy positions during the growing seasons of jujube in 2019 and 2020
2.4 Statistical analyses
All statistical analyses were conducted with SPSS16 (SPSS,Chicago,USA).Significant differences in LWD at different canopy positions under the same soil water condition were tested using multiple comparisons.The results obtained were tested atP=0.05 using LSD post-hoc test.The significance of differences in LWD at the same canopy position under different soil water conditions was analyzed using thet-test at the 5% probability level.Regression analysis was used to determine the correlation between LWD and canopy position.Then LWDs at difference canopy positions were compared using mean absolute difference (MAD) and mean difference (MD)(Santos et al.,2008).
3 Results
3.1 Frequency of leaf wetness
The frequency of leaf wetness was higher at the top than at the middle and bottom of the canopy positions of jujube plant (Fig.4).Under soil water non-deficit condition (θe>0.4),the frequency of leaf wetness was 9.52% higher at the top than at the middle of the canopy position and 8.73%than at the bottom of the canopy position in 2019 (Fig.4a).In 2020,these values are 1.40% and 2.16%,respectively (Fig.4b).Under soil water deficit condition (θe<0.4),the frequency of leaf wetness was 4.76% and 3.97% higher at the top than at the middle and bottom of the canopy positions,respectively,in 2019 (Fig.4a),and 1.76% and 5.58%,respectively,in 2020 (Fig.4b).The frequencies of leaf wetness at the middle and bottom of the canopy positions of jujube varied from year to year.As the precipitation was 436 mm in 2019 (Table 1),the frequency of leaf wetness was lower at the middle than at the bottom of the canopy position under both soil water non-deficit and deficit conditions (Fig.4a).As the precipitation was 333 m in 2020 (Table 1),the frequency of leaf wetness was higher at the middle than at the bottom of the canopy position.
The onset time of leaf wetness and the end time of leaf drying at different canopy positions were different (Fig.4c and d).Underθe>0.4 condition,the onset time of leaf wetness at the top of the canopy position was 20:00-21:00,with a frequency of 8.70%-44.44%.The onset time of leaf wetness at the middle and bottom of the canopy positions was similar (20:45-21:30),with a frequency of 5.80%-31.48%.The time of leaf drying at the top of the canopy position was 10:15-11:00,with a frequency of 15.94%-22.22%.The time of leaf drying at the middle and bottom of the canopy positions was 09:00-10:15 and 08:45-09:30,respectively,with respective frequencies of 17.39%-21.81% and 15.94%-20.37%.The frequency of leaf wetness at the top,middle and bottom of the canopy positions reached the highest values at 05:00-06:00,and were respectively 87.01%,85.45% and 81.48%.The onset time of leaf wetness at different canopy positions was delayed underθe<0.4 condition compared withθe>0.4 condition.Also,the time of leaf drying was earlier and the frequency was reduced.The onset time of leaf wetness at the top of the canopy position was 21:00-23:15,with a frequency of 9.83%-19.67%.The onset time of leaf wetness at the middle and bottom of the canopy positions was 22:00-00:00,with a frequency of 4.92%-20.00%.The time of leaf drying at the top of the canopy position was 08:15-10:00,with a frequency of 13.11%-23.64%.The time of leaf drying at the middle and bottom of the canopy positions was respectively 07:15-09:00 and 07:45-08:30,with a similar frequency of 13.11%-21.81%.The frequencies of leaf wetness at the top,middle and bottom of the canopy positions were 45.45%,41.81% and 38.18%,respectively,reaching the highest at 06:15-06:45.The frequency of leaf wetness at the same canopy position within a certain time was higher underθe>0.4 than underθe<0.4 condition (Fig.4c and d).
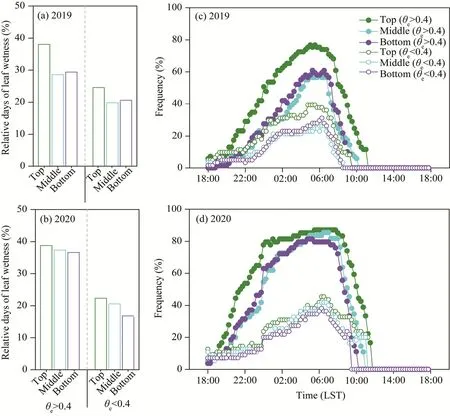
Fig.4 Relative days (a and b) and frequencies (c and d) of leaf wetness at different jujube canopy positions under soil water deficit (θe<0.4) and non-deficit (θe>0.4) conditions in 2019 and 2020.θe,relative extractable water.
3.2 LWD
LWD was higher at the top than at the middle and bottom canopy positions,but LWDs at the middle and bottom canopy positions were similar (Fig.5).In 2019,LWDs at the top were 8.60 h underθe>0.4 condition and 6.60 h underθe<0.4 condition.These values were respectively 3.01 and 2.68 h (P<0.05;θe>0.4) at the middle and bottom of the canopy positions.In 2020,LWDs at the top were 11.10 (θe>0.4) and 6.16 h (θe<0.4).These values were respectively 1.17 and 1.46 h(P>0.05;θe>0.4) and 1.09 and 0.60 h (P>0.05;θe<0.4) higher than those at the middle and bottom of the canopy positions.In addition,LWDs at the top,middle and bottom of the canopy positions were higher underθe>0.4 than underθe<0.4 condition (Fig.5).LWDs at the top,middle and bottom of the canopy positions were 2.00,0.56 and 0.81 h higher underθe>0.4 than underθe<0.4 condition in 2019 (P>0.05).They were 4.94,4.86 and 4.08 h in 2020 (P<0.05).

Fig.5 Leaf wetness duration (LWD) at different canopy positions under soil water deficit (θe<0.4) and non-deficit (θe>0.4) conditions in 2019 (a) and 2020 (b).Different lowercase letters indicate significant differences at different canopy positions within the same soil water condition (P<0.05);different uppercase letters indicate significant differences under different soil water conditions within the same canopy position (P<0.05).Lower and upper whiskers denote the 10th and 90th percentiles,respectively;top and bottom box boundaries denote the 75th and 25th percentiles,respectively;solid dot in box denotes the mean value;solid horizontal line in box denotes the median value;θe,relative extractable water.
3.3 Correlation among LWDs at different canopy positions
There were strong linear correlations between LWDs at the top and middle of the canopy positions and between LWDs at the top and bottom of the canopy positions.The coefficients of determination (R2) for these correlations ranged from 0.70 to 0.94.The fitting effect of the three canopy positions in 2020 was better than that in 2019.TheR2values in 2020 were 0.11-0.24 higher than those in 2019,but LWD was always greater at the top than at the middle and bottom of the canopy positions (Fig.6).
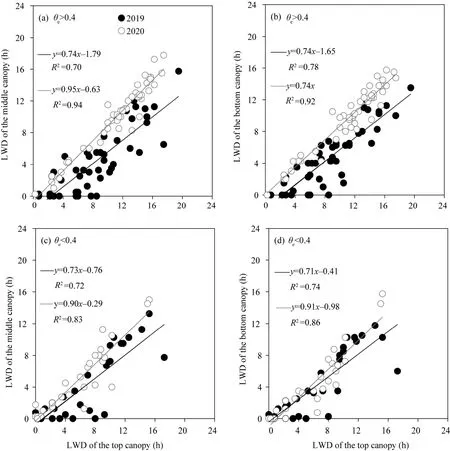
Fig.6 Correlations among leaf wetness durations (LWDs) at different canopy positions under soil water non-deficit (θe>0.4;a and b) and deficit (θe<0.4;c and d) conditions in 2019 and 2020.θe,relative extractable water.
A detailed analysis of the spatial variability of LWD is given in Table 2.The result showed that the onset time of leaf wetness was 0.38 and 0.49 h (θe>0.4),and 0.44 and 0.76 h (θe<0.4) earlier at the top than at the middle and bottom canopy positions,respectively.The average MADs for the onset time of leaf wetness were 1.67 and 2.05 h (θe>0.4),and 1.27 and 1.55 h (θe<0.4),respectively.However,the average MADs for the time of drying was 1.61 and 2.37 h (θe>0.4),and 1.40 and 1.56 h (θe<0.4) later at the top than at the middle and bottom of the canopy positions,respectively.The average MADs for the time of drying were 2.30 and 2.37 h (θe>0.4),and 1.74 and 1.84 h (θe<0.4),respectively.
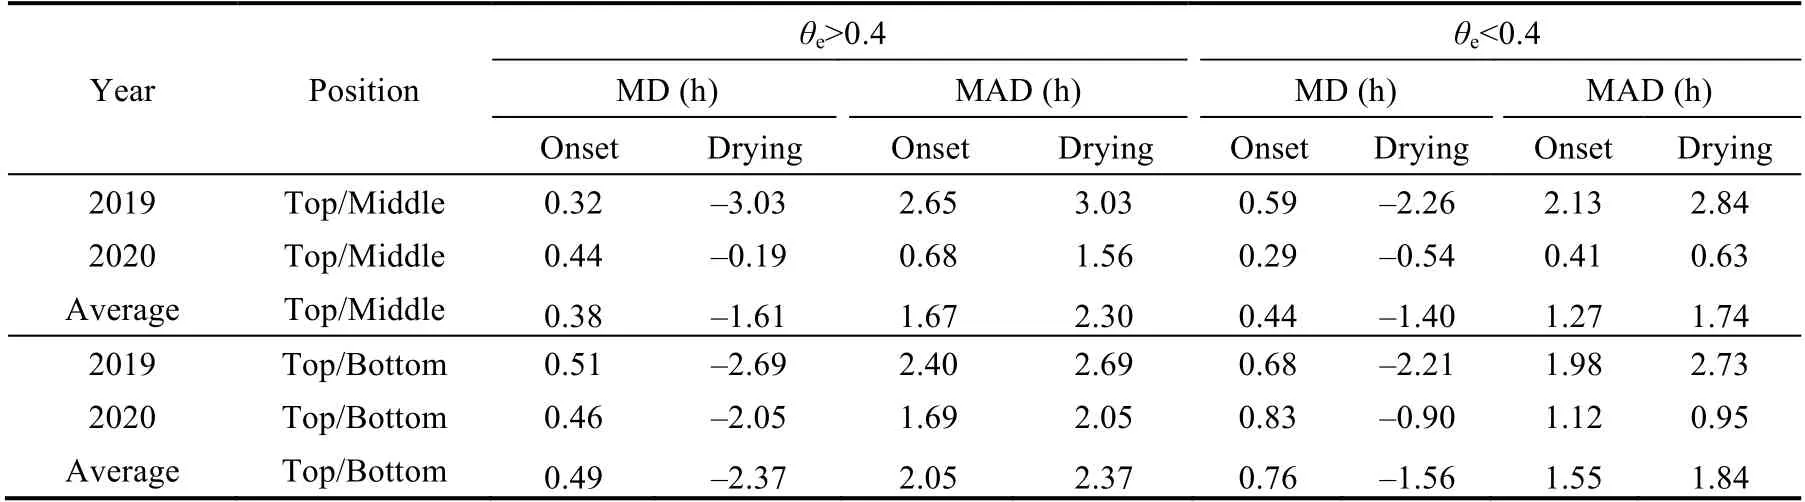
Table 2 Mean difference (MD) and mean absolute difference (MAD) between the time of onset and drying of leaf wetness at different canopy positions in 2019 and 2020
4 Discussion
4.1 Leaf wetness characteristics
Leaf wetness has more ecological effect than the total amount of water stored in leaves (Lulu et al.,2008;Kidron and Starinsky,2019).When leaves are wet,the thin water layer or water droplets will be formed on the surfaces of wet leaves,these water can serve as a supplementary water source for plants and be absorbed by leaves (Dawson and Goldsmith,2018).Kidron and Starinsky (2019) found that water stored in leaves is mainly a CaSO4water type,with a total dissolved ion (TDI) range of 88-758 mg/ L,the ionic composition of the water stored in leaves is generally higher than that of rain,and the absorption of these water by leaves is not affected by the amount of dew,but by the LWD (Kidron and Starinsky,2019).Our results showed that LWD was higher at the top than at the middle and bottom of the canopy positions (Fig.5).This observation is consistent with those of previous studies on LWD for rainforest,apple,soybean,grape and corn plantations (Sentelhas et al.,2005;Batzer et al.,2008;Lulu et al.,2008;Schmitz and Grant,2009;Binks et al.,2021).Our results are,however,different from those obtained for the studies on coffee,cotton and banana plantations (Sentelhas et al.,2005;Santos et al.,2008).On the one hand,longtime leaf wetness can make water move into the leaves (Burkhardt et al.,2012).At the same time,nutrients was absorped by plant leaves (Fernandez and Eichert,2009).On the other hand,water absorbed by leaves can promote cell expansion by increasing turgor pressure,thereby promoting stem and leaf growth (Dawson and Goldsmith,2018).Thus,leaf wetness affects not only the plant physiology but also the canopy microclimate.
The instrument used to monitor leaf wetness in this study was placed in the north-facing direction (Sentelhas et al.,2005;Schmitz and Grant,2009;Park et al.,2019).Different directions of the instrument affects the result of leaf wetness.For example,grape leaves growing in southwest usually start to wet earlier and dry later than those growing in northeast (Lulu et al.,2008).Also,tomato leaves growing in east dried 20 min later than those growing in north,south and west (Lau et al.,2000).LWD of citrus was higher on the west side than on the east side(Bassimba et al.,2017),but our result showed that in the north there was a significant linear correlation between LWD at different canopy positions of jujube.
4.2 Factors driving leaf wetness
The interaction between climate factors and plant community structure and composition influences leaf wetness.Planting density,plant height,tree age,canopy structure,canopy microclimate,field management and other factors also affect the interception and balance of radiation at the canopy.These factors can result in leaf wetness or drying at different canopy positions and time (Sentelhas et al.,2005;Batzer et al.,2008;Rowlandson et al.,2015).
Batzer et al.(2008) found that overhanging leaves of trees such as apple create a barrier that reduces loss of radiant and convective heat from the ground,and delays cooling of surfaces in the lower canopy.Thus,overhanging leaves can delay the formation of dew in the lower canopy,making LWD lower at the lower position than at the top position.When leaf temperature in open positions falls below the dew-point temperature up to 6 h in night,understory leaves remain below the dew-point temperature for only 1 h (Brewer and Smith,1997).Rowlandson et al.(2015)observed that when planting density was low,the whole plant undergoes radiative cooling at almost the same rate.Thus,dew deposition is more uniform with no time difference of leaf wetness at different canopy layers.For example,the leaf wetness of tomato starts at the top and then to the bottom.Drying of leaf has the similar trend (Jacobs et al.,2009).However,dwarf jujube has a dense spacing,with a similar canopy structure of apple.Here,LWD was higher at the top than at the middle and bottom of the canopy positions (Fig.5).Moreover,leaf wetness started earlier at the top than at the middle and bottom of the canopy positions.Drying of leaf wetness occurred later at the top than at the middle and bottom of the canopy positions (Fig.4;Table 2).
Substrate temperature and water vapor source are also key parameters that influence leaf wetness (Beysens,1995;Kidron and Starinsky,2019).Climate factors such as RH and T are primary factors driving leaf wetness in jujube plantation (Gao et al.,2020a).However,RH and T at different canopy positions of jujube plants were similar under the same soil water condition.The maximum difference of temperature between the top and bottom of the canopy positions was 0.35°C and the maximum difference of RH was 1.72% (Fig.3).Soil water deficit reduced the frequency of occurrence of leaf wetness in rainfed jujube,which is consistent with previous results (Rowlandson et al.,2015;Kaseke et al.,2017;Aguirre-Gutierrez et al.,2019).Figure 4 showed that the relative days of leaf wetness in jujube under soil water deficit condition was 16.43%-24.22% less than that under soil water non-deficit condition.Soil water affected LWD in rainfed jujube,with LWDs at the top,middle and bottom of the canopy positions under soil water non-deficit condition of 0.56-4.94 h higher than those under deficit condition.Even with less rainfall and low soil water,the differences in LWD under different soil water conditions were obvious (Fig.5).However,soil water is not a limiting factor in humid areas or in areas with dense planting,and water vapor source causing leaf wetness mainly comes from the atmosphere rather than the soil.Wen et al.(2012) found that dew water in densely spaced crops and grasses (Stipa klinderi,Agropyrus aestivumandFrigida frigida) came from the atmosphere (98%) at the top and only 2% dew water originated from soil evaporation.
5 Conclusions
Leaf wetness affects hydrological processes at the canopy surface.Leaf wetness is driven by climate factors and plant community structure and composition.The frequencies of occurrence of leaf wetness at different canopy positions under soil water non-deficit condition were higher than those under soil water deficit condition.The frequency of occurrence of wetness at the top was higher than those at the middle and bottom of the canopy positions.The onset time of leaf wetness at the middle and bottom of the canopy positions was later than that at the top.However,the time of leaf drying at the middle and bottom of the canopy positions was earlier than that at the top.Although the differences of leaf wetness at different positions were found in jujube,the redistribution of water and nutrient in those leaves and the water use efficiency are not clear.Future studies should analyze the mechanisms of water use from leaf wetness at different positions.In conclusion,the hydrological processes at canopy surfaces of rainfed jujube depended on the position of leaves,thus adjusting canopy structure to redistribute hydrological process is a way to meet the water need of jujube.
Acknowledgements
This work was funded by the National Natural Science Foundation of China (32060301).We are very thankful to the anonymous reviewers whose comments were vital in improving the quality of the work.
- Journal of Arid Land的其它文章
- Spatiotemporal variation of forest land and its driving factors in the agropastoral ecotone of northern China
- Ecological environment quality evaluation of the Sahel region in Africa based on remote sensing ecological index
- Isotope implications of groundwater recharge,residence time and hydrogeochemical evolution of the Longdong Loess Basin,Northwest China
- Lithic soils in the semi-arid region of Brazil:edaphic characterization and susceptibility to erosion
- Neoproterozoic I-type granites in the Central Tianshan Block (NW China): geochronology,geochemistry,and tectonic implications
- Optimal bandwidth selection for retrieving Cu content in rock based on hyperspectral remote sensing