
Lithic soils in the semi-arid region of Brazil:edaphic characterization and susceptibility to erosion
2022-02-23 13:40CarlosPINHEIROJUNIORConanSALVADORTiagoTAVARESMarcelABREUHugoFAGUNDESWilkALMEIDAEduardoSILVANETOciaANJOSMarcosPEREIRA
Journal of Arid Land 2022年1期
Carlos R PINHEIRO JUNIOR ,Conan A SALVADOR ,Tiago R TAVARES ,Marcel C ABREU ,Hugo S FAGUNDES ,Wilk S ALMEIDA ,Eduardo C SILVA NETO,Lúcia H C ANJOS,Marcos G PEREIRA*
1 Federal Rural University of Rio de Janeiro (UFRRJ),Department of Soils,Seropédica,Rio de Janeiro 23890,Brazil;
2 Center for Nuclear Energy in Agriculture (CENA),University of São Paulo (USP),Piracicaba,São Paulo 13416,Brazil;
3 Federal Institute of Education,Science and Technology of Rondônia (IFRO),Rural Zone,Ariquemes,Rondônia 78930,Brazil
Abstract:Soils (Leptosols or Epileptic Regosols) with lithic contact at a depth of 50 cm occupy almost 20% of the Brazilian semi-arid region.These lithic soils are susceptible to erosion due to faster saturation of water-holding capacity during rainfall,which accelerates the beginning of runoff.However,erosion traits of lithic soils in the semi-arid region of Brazil are less studied.The aim of this study was to characterize the soil and landscape attributes in areas with Neossolos Litólicos (Entisols) in the Caatinga biome to identify region of high susceptibility to erosion.Results showed that the soils were characterized by a sandy texture,soil structure with poor development and low content of organic carbon.These attributes increase susceptibility to erosion and reduce water storage capacity,especially in the states of Ceará and Sergipe.In these states,the content of rock fragments in the soil reaches 790 g/kg.High contents of silt and fine sand,high silt/clay ratio,predominance of Leptosols and strong rainfall erosivity were observed in Piauí and northwestern Ceará.A very high degree of water erosion was observed in the states of Pernambuco and Paraíba.Despite the low degree of erosion observed in the state of Bahia,it is highly susceptible to erosion due to the predominance of very shallow soils,rugged relief and high values of rainfall erosivity.Lower vulnerability was observed in the state of Alagoas because of its more smoothed relief,greater effective soil depth,thicker A horizon of soil and lower rainfall erosivity.In general,the characteristics that intensify the susceptibility to erosion in the Caatinga biome are those soil structures with poor development or without aggregation,low contents of organic carbon,high contents of silt and fine sand,high values of silt/clay ratio and rugged relief in some regions.This study collected information contributing to a better characterization of soils with lithic contact in the semi-arid region of Brazil.In addition,regions with a higher susceptibility to erosion were identified,revealing insights that could help develop strategies for environmental risk mitigation.
Keywords:Caatinga biome;drylands;erosive processes;leptosols;soil degradation
1 Introduction
The arid,semi-arid and dry sub-humid regions of the world,commonly referred to as drylands,occupy an area of 67×106km2,accounting for approximately 45.4% of the world′s total area(Pravalie,2016).In Brazil,drylands cover approximately 97×104km2of the national territory(Lapola et al.,2014),and are mainly concentrated in the northeastern region of the country and in the northern state of Minas Gerais (IBGE,2017).This area covers 1269 municipalities with a population of approximately 26×106people.Therefore,it is the most populous semi-arid region in the world (IBGE,2011;SUDENE,2017).
The native vegetation of the Caatinga biome is classified as savanna-steppe (IBGE,2012),which is characterized by great floristic and physiognomic spatial variability,with a predominance of shrubby,woody,shrub-tree species and xerophilous species (Andrade-Lima,1981;Araújo et al.,2007).Caatinga vegetation is part of the global biome called seasonally dry tropical forests and shrubs,and is biodiversity-rich,with approximately 3150 catalogued species,of which 23% are endemic (Queiroz et al.,2017).Due to the long period of water deficit in the Caatinga,its sparse vegetation cover provides poor soil surface protection.Such vegetation cover along with low soil organic matter,and short duration and high-intensity rainfall make some areas highly susceptible to water erosion.
Caatinga is occupied by the soils with low pedogenetic development and mostly (19.2%)present lithic contact in the first 50 cm depth from the surface (Araújo Filho et al.,2017),classified as Neossolos Litólicos according to the Brazilian Soil Classification System (Santos et al.,2018).According to the World Reference Base (WRB) for soil resources (IUSS Working Group WRB,2015),researchers classified these soils as Leptosols when the rock occurs in the first 25 cm depth from the surface,or as Epileptic Regosols when the contact occurs between 25 and 50 cm depths.These shallow soils have important constraints that promote the action of erosive processes,such as (i) natural impediment to root growth (i.e.,due to the parent rock′s physical barrier),which hinders vegetation development (Kosmas et al.,2000);and (ii) faster saturation of water-holding capacity during rainfall,which accelerates the beginning of runoff(Pedron et al.,2011).
In addition to the sparse vegetation cover and predominance of shallow soils,other common soil attributes that make these environments further vulnerable to degradation are high contents of silt and fine sand (S+FS),high silt/clay ratio (S/C ratio),and low stability of soil aggregates(Vaezi et al.,2008,2017;Ribeiro et al.,2009;Cantón et al.,2011).Furthermore,different combinations of topographic characteristics (Quan et al.,2020) and rainfall erosivity (Mello et al.,2013;Oliveira et al.,2013;Almagro et al.,2017) can also contribute to increased erosion rates.To the best of our knowledge,there is no research in the literature,which provides comprehensive spatial information on lithic soils,rainfall erosivity and landscape features to characterize the susceptibility to erosion in the Caatinga biome.
Given the high vulnerability of the Caatinga biome,the objective of this study was to spatially characterize the information related to landscape and soil (morphological,physical and chemical)attributes of Neossolos Litólicos within the Caatinga biome and to identify areas with a high susceptibility to erosion.
2 Materials and methods
2.1 Dataset
We created the dataset based on bibliographical research on exploratory soil surveys conducted in the states of Ceará (CE),Rio Grande do Norte (RN),Paraíba (PB),Pernambuco (PE),Piauí (PI),Maranhão (MA),Alagoas (AL),Sergipe (SE),Bahia (BA),and in the northern state of Minas Gerais (MG) (Jacomine et al.,1971,1972a,b,1975a,b,1976,1979a,b;Jacomine,1973;1986a,b).We selected 95 soil profiles within the Caatinga biome (Fig.1),all classified as Neossolos Litólicos (Santos et al.,2018).These profiles,besides having lithic contact in the first 50 cm depth from the surface,show the absence of a subsurface diagnostic horizon,i.e.,with a sequence of A-R or A-C-R horizon.
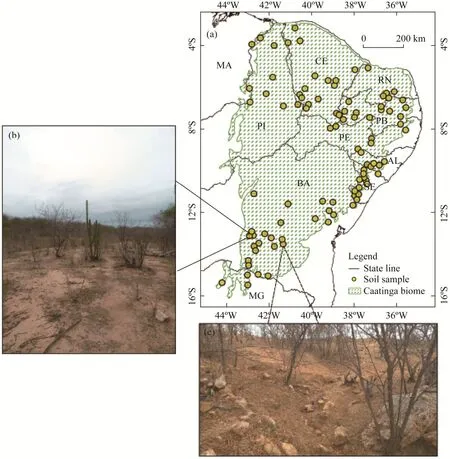
Fig.1 Soil samples (a) and profile distribution (b and c) of Neossolos Litólicos in the Caatinga biome.CE,Ceará;RN,Rio Grande do Norte;PB,Paraíba;PE,Pernambuco;PI,Piauí;MA,Maranhão;AL,Alagoas;SE,Sergipe;BA,Bahia;MG,Minas Gerais.
For all the soil profiles studied,landscape information,morphological descriptions,particlesize attributes and chemical attributes were obtained from the abovementioned soil survey (Table 1).Soil attributes were evaluated in horizons A and C of each profile (C horizon was not always present).In addition,each horizon was considered as a whole;in other words,no specific depths were evaluated and interpolation methods were not applied.Subsequently,we classified the profiles according to the WRB (IUSS Working Group WRB,2015).
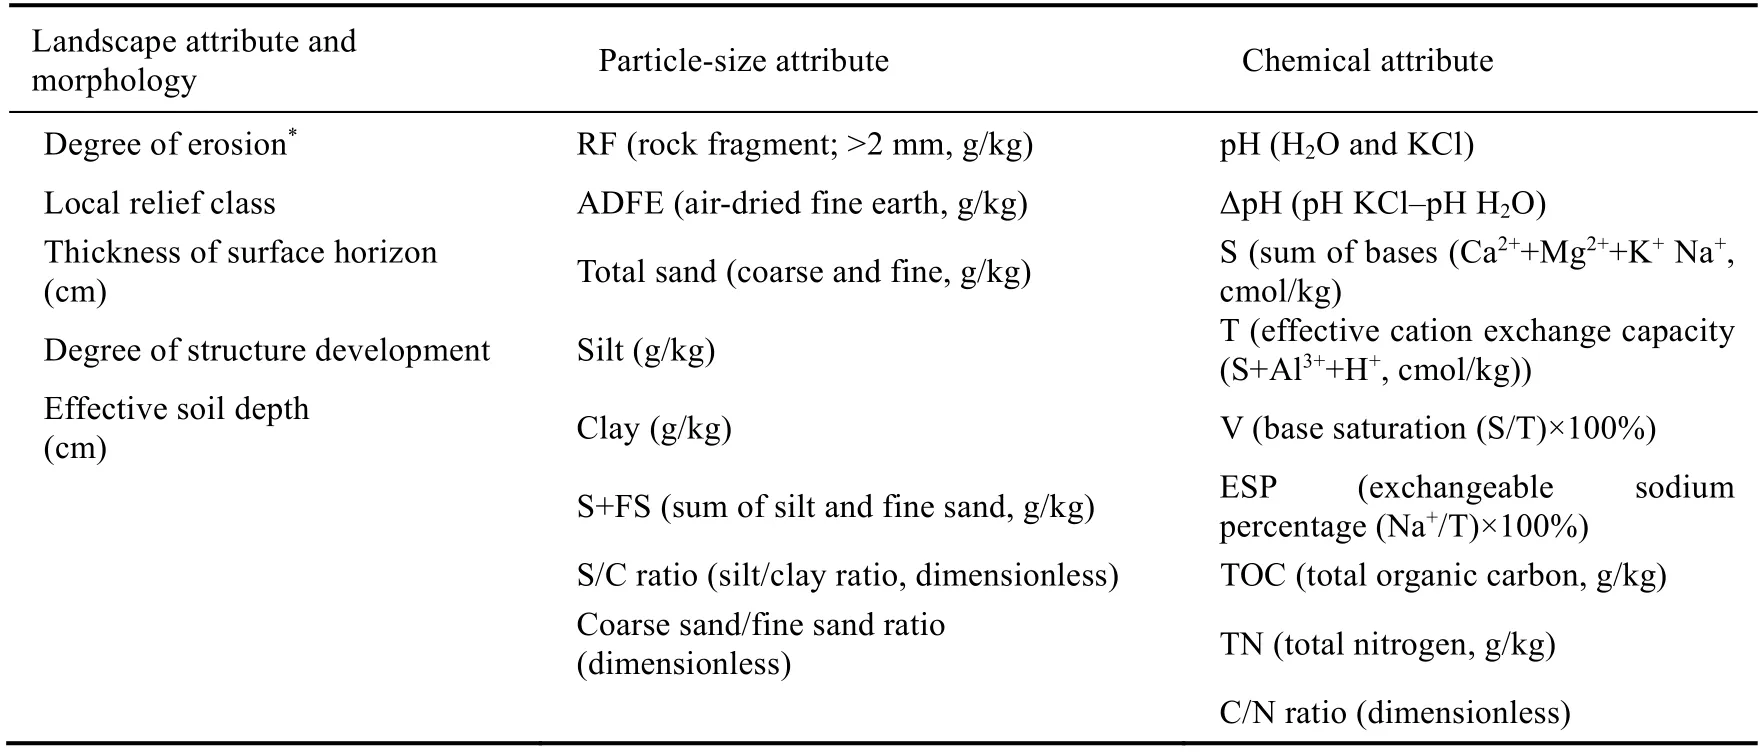
Table 1 Landscape attributes,morphology,particle-size attributes and chemical attributes of the soils
2.2 Spatial distribution of soil attributes
Spatial information on rainfall erosivity in the northeast region of Brazil was compiled from Almagro et al.(2017).These rainfall erosivity data were the most recent and complete estimations available for the Brazilian states.Almagro et al.(2017) used a gridded rainfall dataset with 0.25°×0.25° spatial resolution and 1-month temporal resolution based on observed rainfall data of approximately 4000 rain gauges,provided by different Brazilian databases from 1980 to 2013.This rainfall erosivity estimation achieved a coefficient of determination (R2) and root mean squared error (RMSE) of 0.91 and 2.35 MJ•mm/(hm2•h•a),respectively.Details of the methods are described by Almagro et al.(2017).
Water erosion,local relief,thickness of A horizon,soil depth,soil structure,chemical properties and physical properties of each soil profile were overlaid with the spatial information of rainfall erosivity for descriptive analyses.Physical (rock fragment (RF),S+FS,S/C ratio and coarse sand/fine sand ratio (CS/FS ratio)) and chemical attributes (pH-H2O,base saturation (V),exchangeable sodium percentage (ESP),and total organic carbon (TOC)) of A horizon were also spatialized for further descriptive assessments.
2.3 Statistical analysis
We used box plot to summarize the distribution of particle size and chemical attributes and provided the mean values and standard deviations of these attributes.
We used cluster analysis to identify groups of similar soil physical characteristics.We considered the physical characteristics of A horizon (RF,air-dried fine earth (ADFE),total sand,coarse sand,fine sand,clay,silt,S+FS,S/C ratio and CS/FS ratio) for the analysis.Cluster analysis uses Euclidean distance (Eq.1) as a measure of dissimilarity and Ward′s hierarchical technique (Ward,1963) to form groups.This is a widely used strategy for grouping soil characteristics and attributes (Bhering et al.,2017;Chaves et al.,2017;Arcoverde et al.,2019;Santos et al.,2020).
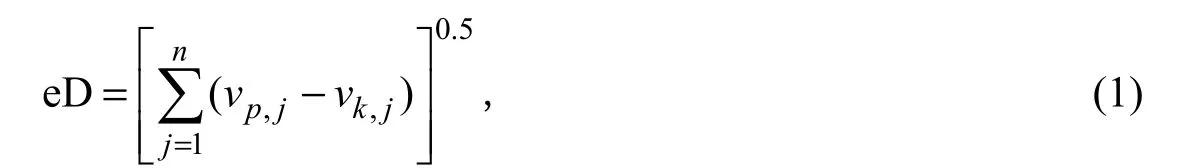
where eD is the Euclidean distance (dimensionless),andvpandvkare the variable quantitative characteristics of the cooperativespandk,respectively,of thejthdata observed.
Ward′s method is based on the sum of squares between the groups and the sum of squares of the elements within each group,with the aim of obtaining the greatest similarity within groups and the greatest dissimilarity between different groups formed in each stage of clustering.Thereafter,cluster analysis was effective in distinguishing four similar groups according to pre-established criteria.
3 Results
3.1 Rainfall erosivity,landscape attributes and soil morphology
Figure 2 shows the spatial distribution of rainfall erosivity within the Caatinga biome and compares it with the landscape attributes and soil morphology of Neossolo Litólicos profiles.In general,there was moderate erosivity with a predominance of values ≤4000 MJ•mm/(hm2•h•a)(bluish-green hues) (Fig.2a).In regions with yellowish-green hues,erosivity varied between moderate and strong (≥8000 MJ•mm/(hm2•h•a)),which highlights the strong classes observed mainly in the coastal region of the northwestern CE and in most of PI.The lowest values of erosivity (≤2000 MJ•mm/(hm2•h•a),represented by stronger blue hues) were observed in the central region of RN,PB and PE.In contrast,in the southwestern region of BA and in the northern region of MG,PI and MA,erosivity was classified as strong or very strong (≥10,000 MJ•mm/(hm2•h•a)).Neossolos Litólicos was studied under several topographic conditions and distributed across different relief classes (Fig.2c).However,in BA,RN,PB,PE and north of the MG,there was a predominance of more rugged reliefs,including the classes of wavy and strong wavy relief.Additionally,the most advanced degrees of water erosion (ranging from moderate to severe) (Fig.2b) were observed in BA,PE,RN,CE and in the central region of BA,which indicates an intense removal of the surface horizon and highly degraded biological function.
But where can his eyes be, said the Prince, that your beauty makes no impression upon him? As for me, since I have possessed71 your portrait I have wandered over the whole world to find you, and, now we have met, I see that you are ten times lovelier than I could have imagined, and I would give all I own to win your love
Regarding morphological attributes,despite the great variability among the classes of the A-horizon thickness,it was possible to verify the predominance of horizons with thicknesses between 10 and 20 cm depths (Fig.2d).Additionally,most of the soil profiles had an effective depth of <34 cm (Fig.2e) and the shallowest soils were observed mainly in PI,RN and BA and to a lower extent in CE,PE and SE.Most surface horizons had structures with weakly developed aggregates (Fig.2f),followed by those without aggregation.
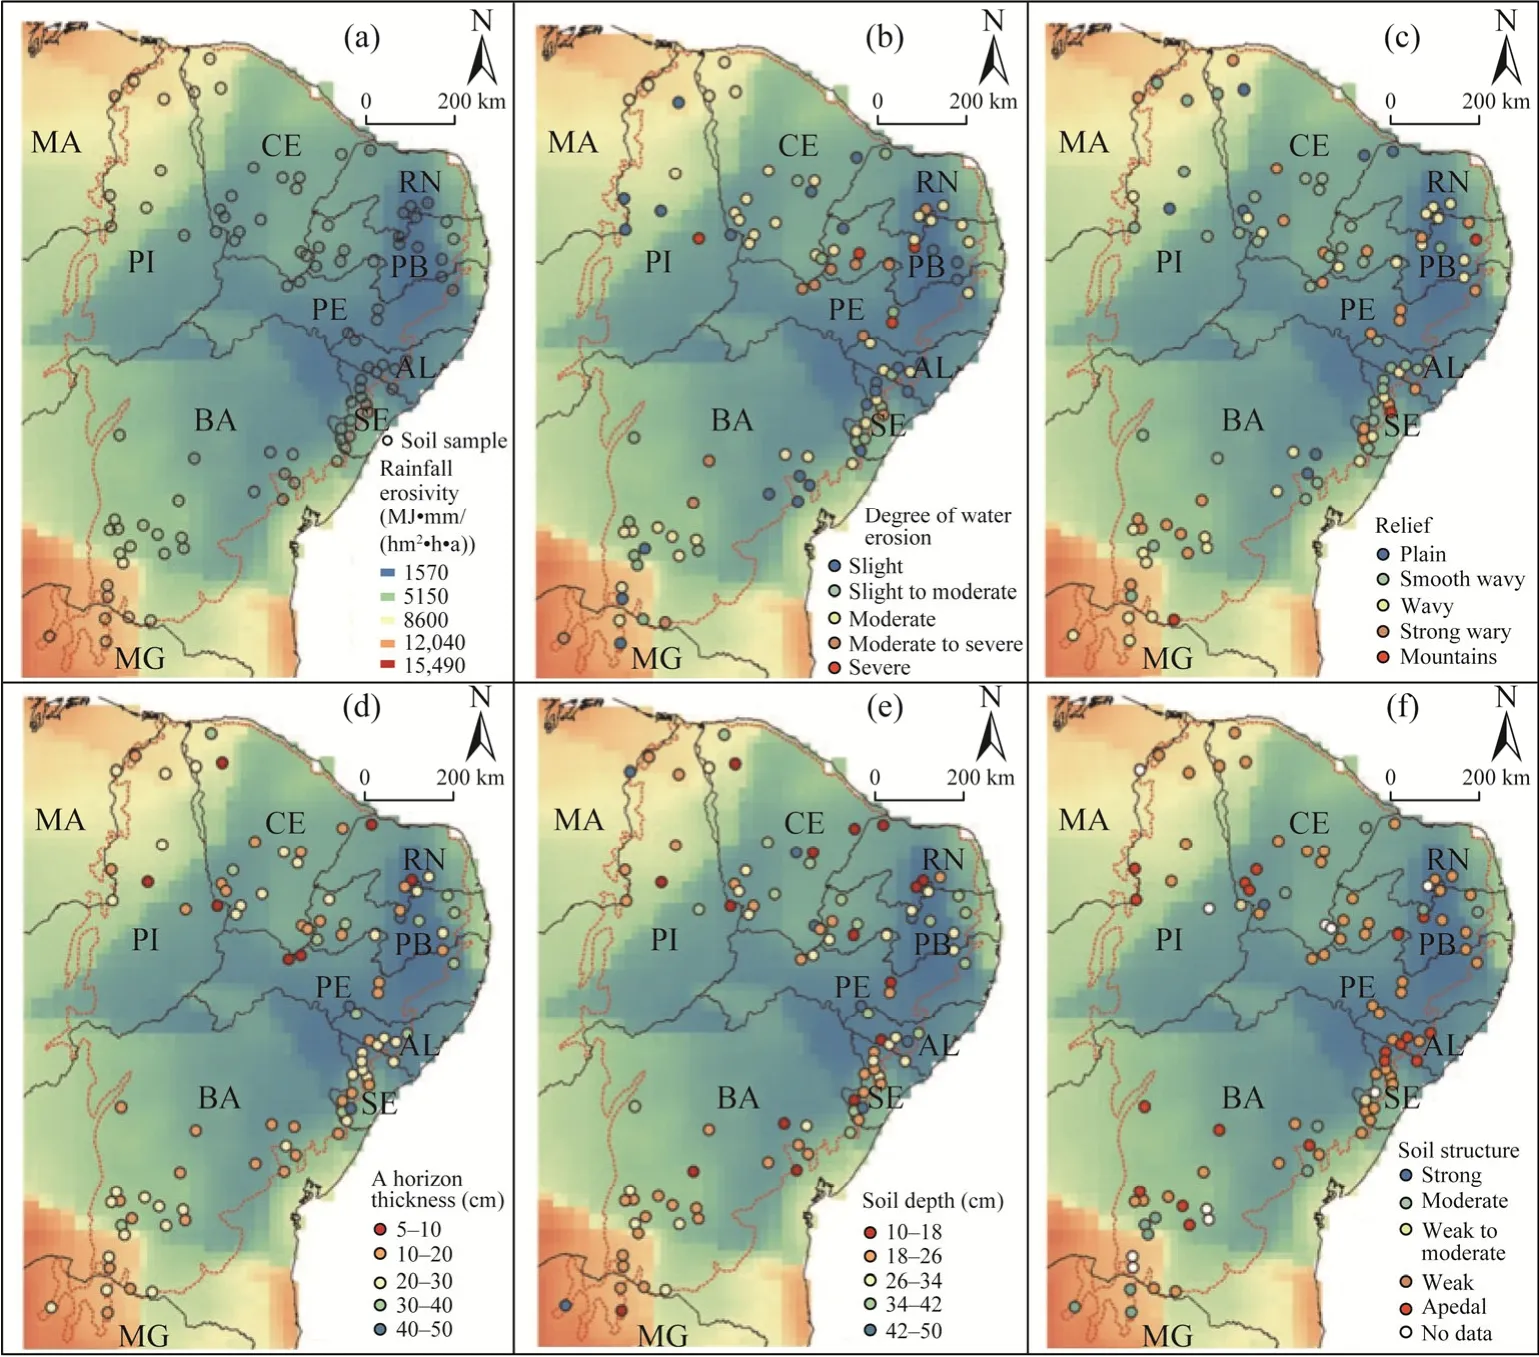
Fig.2 Rainfall erosivity (a),landscape attributes (b and c) and soil morphologies (d-f) of Neossolos Litólicos in the Caatinga biome
3.2 Spatial distribution of particle-size attributes
In general,a similar pattern of particle-size attributes was observed in the surface and subsurface horizons of the studied soil profiles (Figs.3 and 4).The average values of ADFE and RF were close to 750.00 and 250.00 g/kg,respectively.The greatest variability in RF values occurred in the third and fourth quartiles,especially in the surface horizons.Figure 5 showed the spatial distribution of particle-size attributes of A horizon.In these horizons,the highest content of RF value (reaching a maximum of 790.00 g/kg) was observed in the central regions of CE and SE and in some regions of PB,PI and BA (Fig.5a).
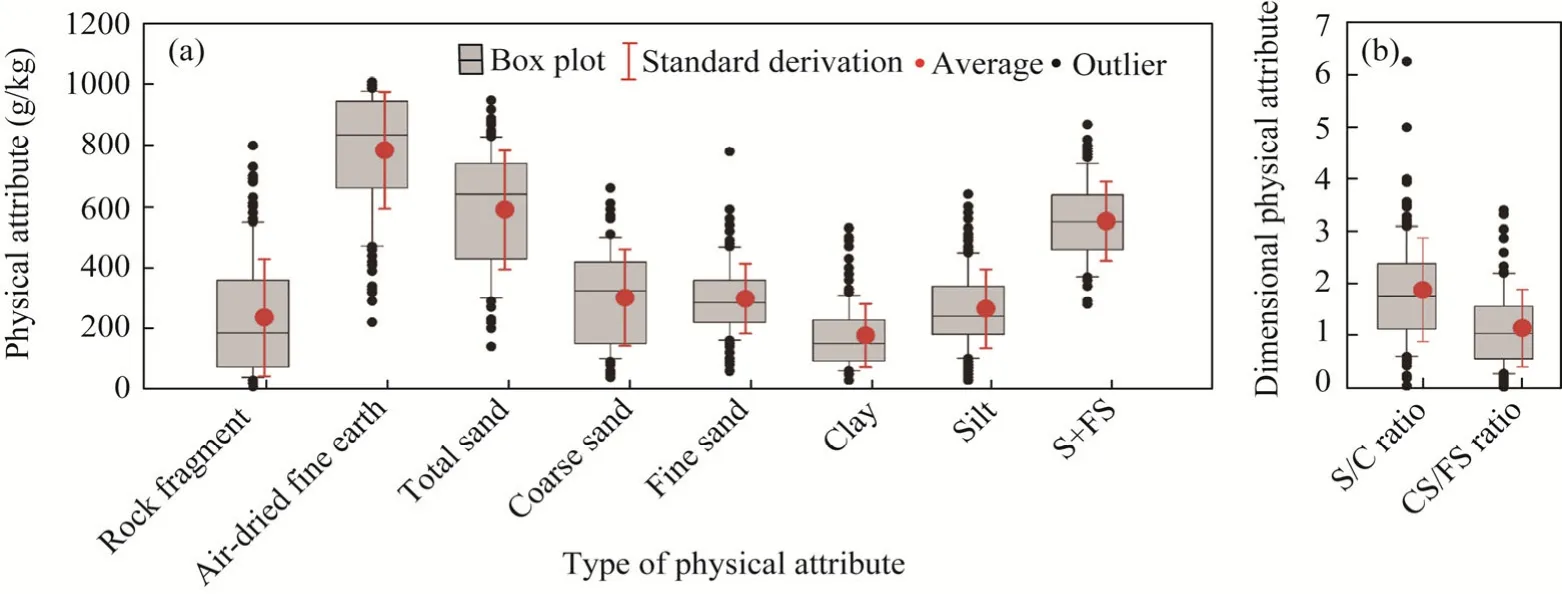
Fig.3 Box plot of particle-size attributes (a and b) of A horizon of Neossolos Litólicos in the Caatinga biome.S,silt;FS,fine sand;S/C,silt/clay;CS/FS,coarse sand/fine sand.
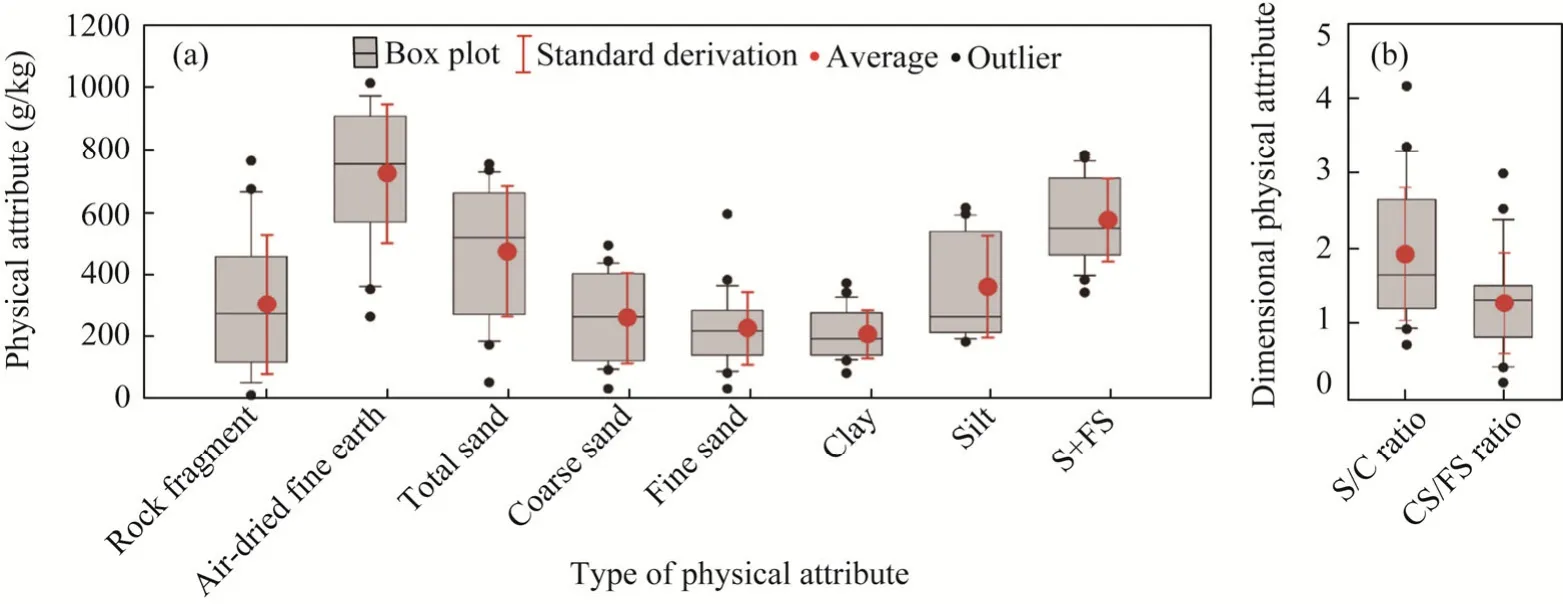
Fig.4 Box plot of particle-size attributes (a and b) of C horizon of Neossolos Litólicos in the Caatinga biome.S,silt;FS,fine sand;S/C,silt/clay;CS/FS,coarse sand/fine sand.
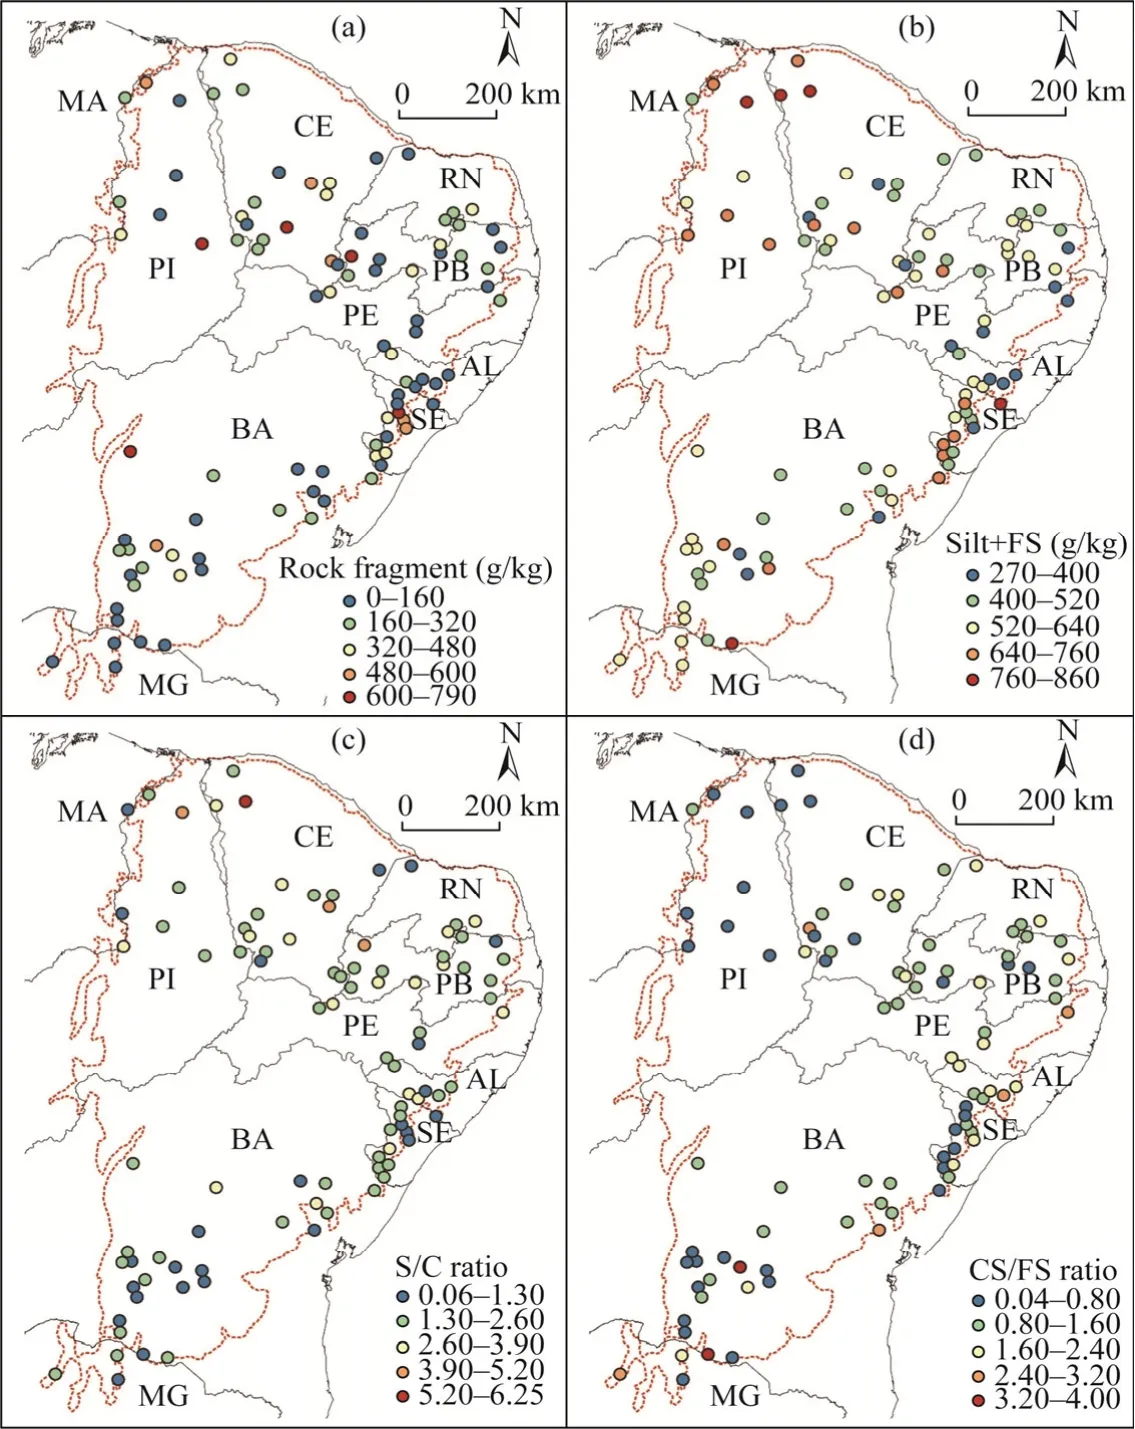
Fig.5 Spatial distribution of particle-size attributes of A horizon of Neossolos Litólicos in the Caatinga biome.(a),rock fragment;(b),silt+fine sand (FS);(c),S/C,silt/clay;(d),CS/FS,coarse sand/fine sand.
The average clay contents were 166.00 and 193.00 g/kg and the average silt contents were 254.00 and 347.00 g/kg in A and C horizons,respectively.These features result in high values of S/C ratio,especially in CE,east of PE and north of PI,where the value can reach 6.25 (Fig.5b).The total sand contents observed in the A and C horizons had high variance and mean values of 579.00 and 460.00 g/kg,respectively (Figs.3 and 4).However,we observed a predominance of sandy loam textural class,followed by the loam class in both horizons (Fig.6).The coarse sand content in the surface horizons was slightly higher than that of fine sand,resulting in a CS/FS ratio of ≤1.2 (Fig.5d).In contrast,two exceptions with values above 3.2 were observed in BA.
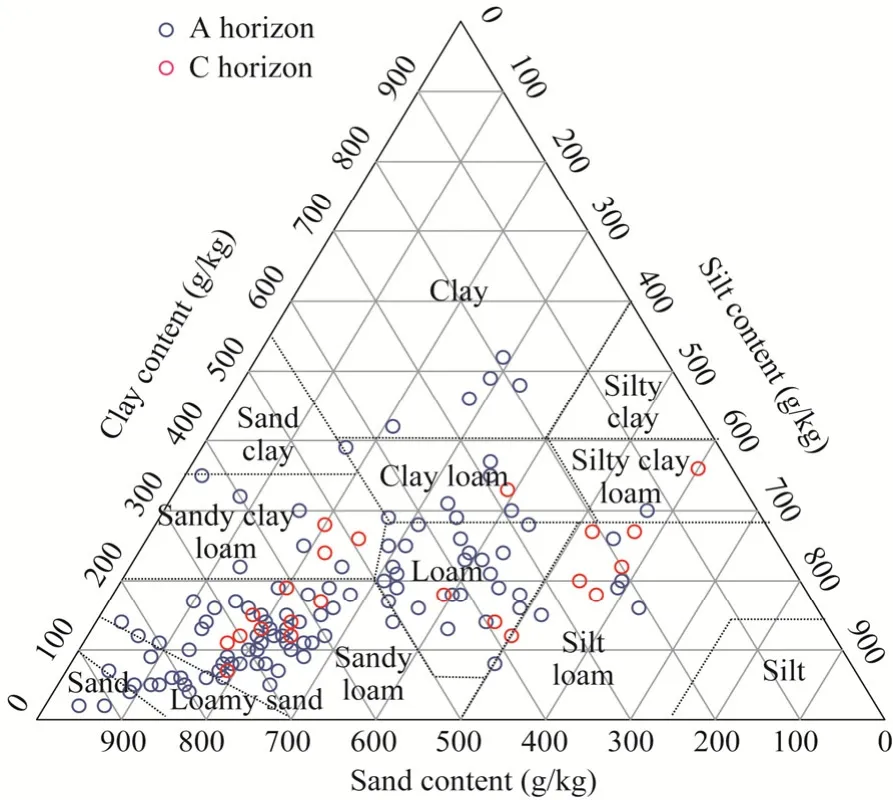
Fig.6 Textural class of A and C horizons of Neossolos Litólicos in the Caatinga biome
S+FS content,an important characteristic evaluated in erosion studies,had an average of 542.00 and 561.00 g/kg in A and C horizons,respectively.However,a large number of horizons with values above 640.00 g/kg were observed,especially in SE,PI and CE (Fig.5b).
Figure 7 shows the dendrogram of Euclidean distances and the four groups based on Ward′s method.Table 2 shows the average and standard deviation of physical attributes of each group.Despite the high standard deviation,important relationships among physical attributes of A horizon can be observed from the mean values of groups.In general,the highest average RF(273.16 g/kg),the highest total sand content (617.37 g/kg),and lower clay content (129.47 g/kg)were observed in group 3.Groups 2 and 4 had the highest silt contents (288.22 and 283.75 g/kg,respectively),the highest S+FS contents (566.47 and 545.63 g/kg,respectively),and the highest S/C ratios (2.42 and 2.23,respectively),while the lowest values of these attributes were observed in group 1.
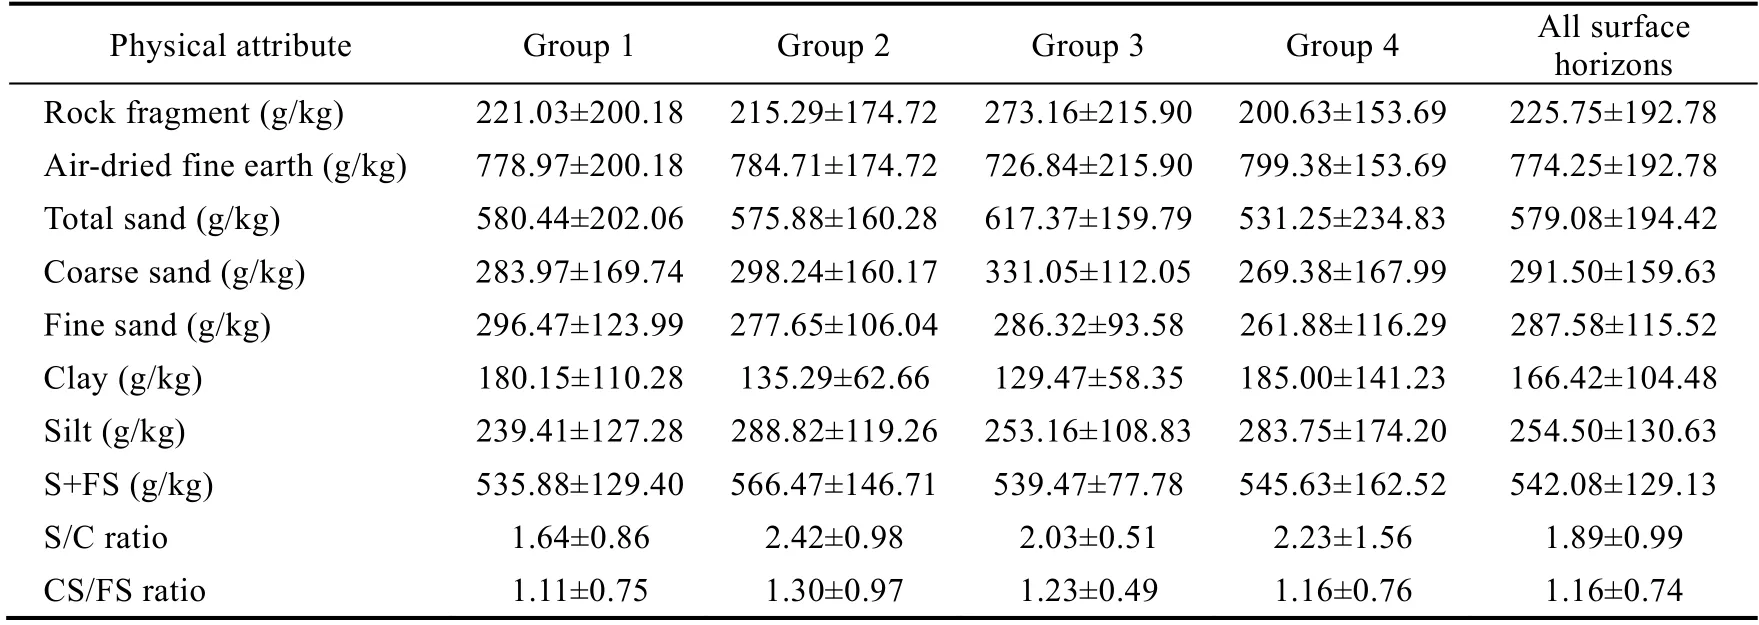
Table 2 Average and standard derivation (SD) of physical attributes of the surface horizons of Neossolos Litólicos for each group formed in the cluster analysis and for all surface horizons
3.3 Spatial distribution of chemical attributes
In general,chemical attributes of studied soils did not cause impediments to plant development and prevailing eutrophic character (V>50%).The mean values of pH were 5.8 and 5.5 in A and C horizons,respectively,and the soils were predominantly eutrophic,despite the great variability of V values (Figs.8 and 9).BA had the lowest value of V (<20%),which can be attributed to its acidic soil character (pH<5.0;Fig.10a and b).In general,the values of Al3+,H+and ESP were low(Figs.8 and 9).Despite the large variance and high values of ESP observed in certain localities(Fig.10c),with the average being only 2%.
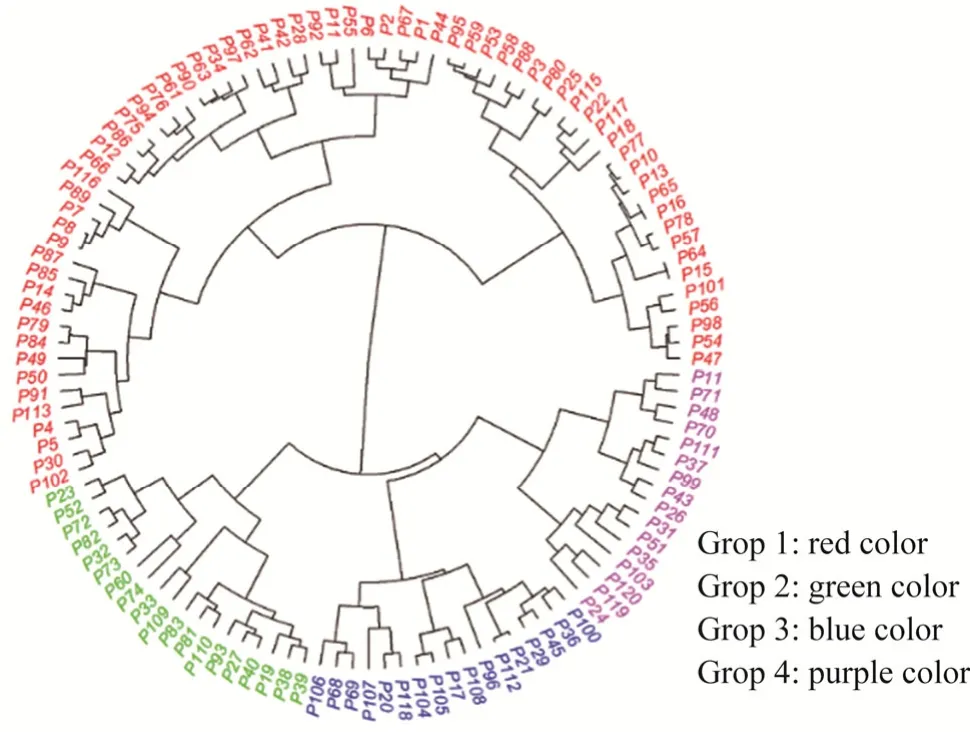
Fig.7 Dendrogram plot by the hierarchical analysis of clusters based on soil physical attributes of A horizon of Neossolos Litólicos in the Caatinga biome
TOC content in A horizon was low (Fig.8c),with an average of 11.20 g/kg.Despite the variability observed in the TOC data,the median was 9.00 g/kg,which explains the predominance of soils with the TOC content lower than 10.00 g/kg,particularly in CE,RN,AL and PB (Fig.10d).
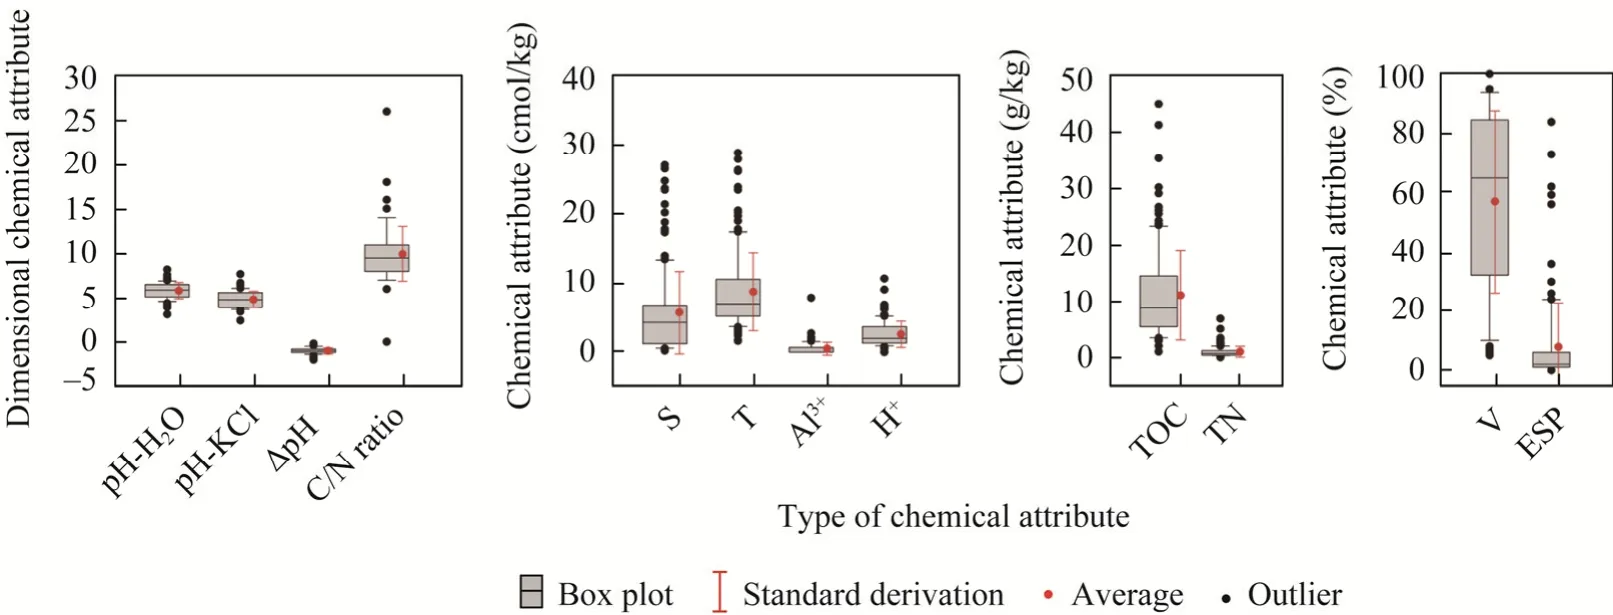
Fig.8 Box plot of chemical attributes of A horizon of Neossolos Litólicos in the Caatinga biome.ΔpH=pH-KCl-pH-H2O;S,sum of bases;T,effective cation exchange capacity;TOC,total organic carbon;TN,total nitrogen;V,base saturation;ESP,exchangeable sodium percentage.
Fig.9 Box plot of chemical attributes of C horizon of Neossolos Litólicos in the Caatinga biome.ΔpH=pH-KCl-pH-H2O;S,sum of bases;T,effective cation exchange capacity;TOC,total organic carbon;TN,total nitrogen;V,base saturation;ESP,exchangeable sodium percentage.
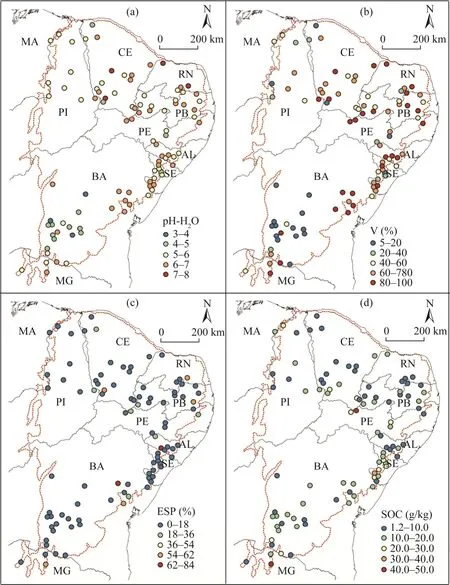
Fig.10 Spatial distribution of chemical attributes of A horizon of Neossolos Litólicos in the Caatinga biome.(a),pH-H2O;(b),V,base saturation;(c),ESP,exchangeable sodium percentage;(d),SOC,soil organic carbon.
3.4 Soil classification
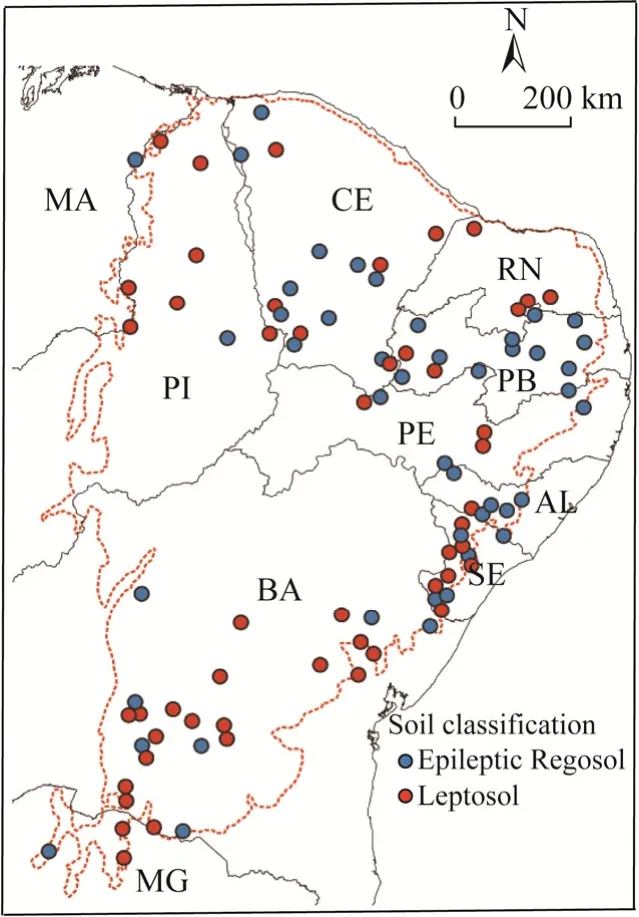
Fig.11 Soil classification result according to World Reference Base for soil resources
4 Discussion
The small effective depth that restricts the circulation of water in the first centimeters of the profile is probably the main factor contributing to erosive processes in Neossolos Litólicos.In addition,our results show that several other factors can intensify the action of erosive processes in these soils of the Caatinga biome.We discuss the development of soil structure,particle-size attributes (RF,S+FS and S/C ratio),topographic attributes,thickness of surface horizon,effective soil depth and rainfall erosivity in different Brazilian states.
The predominance of poorly developed or apedic soil structures (as observed in the present study) makes soils more susceptible to the action of erosive processes because of their low stability (Rabot et al.,2018).Several factors may contribute to this low structural stability.An important factor is the low number of cementing agents,which is reflected in (i) the predominance of sandy loam texture;and (ii) the reduced content of organic carbon (Six et al.,2002;Wachendorf et al.,2014;Vaezi et al.,2018).Factors related to deforestation should also be considered.Pinheiro Junior et al.(2019) studied the effects of deforestation on the morphology of sandy soils in the Caatinga biome and found significant effects of land use change on this attribute.In semi-arid regions,low aggregate stability is considered one of the main factors responsible for the high soil erodibility (Vaezi et al.,2008,2017).
In addition to the greater susceptibility to erosion,the lower structural stability results in a lower water-holding capacity because of the small amount of intra-aggregate pores (Pachepsky and Rawls,2003;Rabot et al.,2018).This characteristic,combined with the sandy texture,small effective depth and climatic conditions of the region itself,intensifies the water deficit,making vegetation establishment even more difficult.In addition,the large amount of RF,observed especially in CE and SE,contributes even more to reducing the water-holding capacity.Cluster analysis showed that soil profiles with the highest amount of RF also had higher total sand content and lower clay content.
S+FS content,which contributes to high erodibility,was high in PI,northwestern CE and some regions of SE.Several studies have indicated that particle-size characteristic is a key factor in the evaluation of soil erodibility (Dimoyiannis et al.,1998;Fraser,1999;Parysow et al.,2003;Pérez-Rodríguez et al.,2007;Vaezi et al.,2016).These studies reported a strong correlation(r>0.90) between erodibility and S+FS content (Duiker et al.,2001).Soils with high values of S+FS have aggregates with a low structural stability (Mbagwu et al.,1993;Miqueloni and Bueno,2011),which contributes to a greater susceptibility to erosion.Additionally,these particles were the first to be eroded during intense rain (Quan et al.,2020).This is particularly relevant in PI and northwestern CE,which have high values of rainfall erosivity and a predominance of shallower soils (Leptosols).In these regions,the high values of S/C ratio,often observed in desertification hotspots in the Caatinga biome (Ribeiro et al.,2009),hinders the formation of stable and larger aggregates (Vaezi et al.,2018).According to the cluster analysis,soils with higher silt contents also have higher S+FS content and S/C ratio (with an average value greater than 2.0),which contributes to the greater susceptibility to erosion.
The higher occurrence of Leptosols (shallower soils) in PE,RN,BA and some regions of SE is associated with a more rugged topography.Ruggedness intensifies the removal of material,conditioning the soil to a constant rejuvenation process (Valtera et al.,2015;Lybrand and Rasmussen,2018).In these states,the advanced degree of erosion seems to be directly related to topographic attributes,as observed in the semi-arid regions of Spain (Cantón et al.,2011) and Iran(Moghadam et al.,2015).In the western PB,despite the predominance of smooth wavy relief,the variation in the degree of erosion from moderate to severe may be associated with changes in land use (Cantón et al.,2011),as well as the smaller thickness of A horizon (Pinheiro Junior et al.,2019) observed in the states of PE and RN.
In BA,despite the predominance of factors that facilitate erosion (wavy,strong wavy relief and Leptosols),there are many sites with a lower degree of erosion (slight to moderate).This is perhaps due to the relative humidity in BA.Although there is a predominance of sparse vegetation cover in the Caatinga biome,some slightly wetter areas favor the formation of dry forests with a denser cover (Moro et al.,2016;Oliveira et al.,2019).In these areas,soil is more protected against the direct impact of rainfall,reducing the degree of erosion,even in areas with steep slopes.Hence,dry forest cover could be responsible for the lower degree of erosion in BA.However,it should be noted that BA and northern MG had the highest rainfall erosivity and high susceptibility to soil erosion.All these factors highlight the significance of environmental risk-mitigation strategies in this region.Because of the high vulnerability of these environments,anthropogenic activities,such as land use changes and soil management,can intensify soil erosion(Wei et al.,2007;Vasquez-Mendez et al.,2011;Moghadam et al.,2015;Oliveira Filho et al.,2019).Nevertheless,the dynamics of erosive processes depend on complex interactions among various factors such as rainfall,soil,vegetation,topography and hydrological processes (Ludwig et al.,2005;Moghadam et al.,2015).
On the other extreme,a lower vulnerability was observed in AL,owing to a combination of factors that reduce susceptibility to erosion,such as (i) predominance of more smoothed relief;(ii)soils with a greater effective depth (Epileptic Regosols);(iii) thicker A horizon (ranging between 20 and 40 cm depths);and (iv) a lower rainfall erosivity.
5 Conclusions
This study helped in the better characterization of soils with lithic contact in the semi-arid regions of Brazil.In addition,we identified regions with a higher susceptibility to erosion and the factors that interfere with this process.
The characteristics that intensify the susceptibility to erosion in the Caatinga biome are soil structure with poor development or without aggregation,low content of organic carbon,high content of silt and fine sand,high silt/clay ratio and rugged relief in some regions.In particular,in PI and the northwestern region of CE,the susceptibility to erosion was intensified by a combination of high values of silt and fine sand,high silt/clay ratio,high rainfall erosivity and a predominance of Leptosols.In PE and PB,an extremely advanced degree of water erosion occurred.
In BA,although many factors contributed to its high susceptibility to erosion,a low degree of water erosion was observed,which could be associated with the denser vegetation cover in this area.Future research evaluating the change in land use and vegetation cover indices in the Caatinga biome is important to broaden our understanding of the erosive processes in Neossolos Litólicos,as well as the management strategies that can mitigate or intensify this process.Finally,this study provides insights that can help different stakeholders (e.g.,consultants,researchers,public and private companies and policymakers) in the region to identify opportunities for developing environmental risk mitigation strategies.
Acknowledgements
This study was funded in part by the Coordination for the Improvement of Higher Education Personnel,Brazil(CAPES;Finance code 001) and by the Carlos Chagas Filho Foundation for Supporting Research in the State of Rio de Janeiro,FAPERJ.Tiago R TAVARES was funded by the São Paulo Research Foundation (FAPESP;2020/16670-9).
- Journal of Arid Land的其它文章
- Spatiotemporal variation of forest land and its driving factors in the agropastoral ecotone of northern China
- Ecological environment quality evaluation of the Sahel region in Africa based on remote sensing ecological index
- Isotope implications of groundwater recharge,residence time and hydrogeochemical evolution of the Longdong Loess Basin,Northwest China
- Spatial variability of leaf wetness under different soil water conditions in rainfed jujube (Ziziphus jujuba Mill.) in the loess hilly region,China
- Neoproterozoic I-type granites in the Central Tianshan Block (NW China): geochronology,geochemistry,and tectonic implications
- Optimal bandwidth selection for retrieving Cu content in rock based on hyperspectral remote sensing