
The deformation characteristics and flow field around knotless polyethylene netting based on fluid structure interaction (FSI)one-way coupling
2022-02-18 09:37BaiqianZouNyatchoubaNsanueBrunoThierryHaoTanLiuxionXuShuchuanDonFuxianHu
Aquaculture and Fisheries 2022年1期
Baiqian Zou , Nyatchouba Nsanue Bruno Thierry, Hao Tan ,Liuxion Xu , Shuchuan Don , Fuxian Hu
a College of Marine Sciences, Shanghai Ocean University, Shanghai, 201306, China
b National Engineering Research Center for Oceanic Fisheries, Shanghai, 201306, China
c Key Laboratory of Oceanic Fisheries Exploration, Ministry of Agriculture and Rural Affairs, Shanghai, 201306, China
d The Key Laboratory of Sustainable Exploitation of Oceanic Fisheries Resources, Shanghai Ocean University, Ministry of Education, Shanghai, 201306, China
e Scientific Observing and Experimental Station of Oceanic Fishery Resources, Ministry of Agriculture and Rural Affairs, Shanghai, 201306, China
f Institute of Industrial Science, The University of Tokyo, 5-1-5 Kashiwanoha, Kashiwa, Chiba, 277-8574, Japan
g Faculty of Marine Science, Tokyo University of Marine Science and Technology, Minato, Tokyo, 108-8477, Japan
Keywords:Knotless netting Fluid structure interaction Deformation characteristics Flow field SST k-omega model
ABSTRACT Knotless polyethylene (PE) netting is widely used in fisheries because of its excellent hydrodynamic performance and low cost. Netting deformation and the surrounding flow field distribution play an important role in determining the hydrodynamic characteristics of netting in moving water. In order to investigate the effect of solidity ratio and attack angle on drag, netting deformation, and flow field distribution through the netting, a fluidstructure interaction (FSI) model based on a one-way coupling combining the shear stress turbulent (SST) komega model and the large deformation nonlinear structural finite element model was evaluated. Our results showed the difference between the parallel and normal drag forces found in the present numerical model and experimental flume tank data were 9.17% and 11.58%, respectively. The mean relative error in the inclined hydrodynamic drag for different flow velocities and attack angles was 8.35%, 6.69%, and 5.37% for the nettings 1, 2, and 3, respectively. These results show that the present numerical simulation based on FSI one-way coupling can be used to examine hydrodynamic forces on netting. The flow simulation results show that there is a noticeable flow velocity decrease through the netting and a rather large velocity reduction region downstream from the netting for different attack angles. These results reveal the existence of turbulent flow due to the netting wake. It was found that the equivalent stress and total deformation increase as the flow velocity increases and solidity ratio decreases.
1. Introduction
Netting is regarded as the most critical component in fishing gear and fish cage, which is characterized as complex, flexible, and porous structure (Zhou and Xu, 2018). Knotless polyethylene (PE) netting is used around the world because of its excellent hydrodynamic performance, corrosion resistance, and low moisture absorption (Tang, Hu,et al., 2017). Under the joint action of various external and internal forces, the netting structure is easily deformed and the deformed or moving netting structure is adversely affected (Yao et al., 2016). Under the current action, the netting shape changes and the hydrodynamic forces acting on it tend to decrease, and the deformed netting then affects the flow field distribution (Bi et al., 2014).
During the last decade year, numerical modeling became one of the most popular methods for evaluating fishing gear designs and assessing their performance (Nyatchouba Nsangue et al., 2019; Tang et al., 2019).One advantage of numerical modeling is that it takes into account the design of the fishing gear and its environment, which makes it possible to solve fluid dynamics equations while accounting for hydrodynamic forces and the velocity distribution in each part of the system (Nguyen et al., 2015; Nguyen and Winger, 2016). Several earlier studies have shown the results obtained with numerical modeling and results from flume tank experiments are similar, and the costs of numerical modeling are always lower than the costs of flume tank experiments. Numerical simulations using fluid-structure interaction (FSI) involves coupling between computational fluid dynamics (CFD) and structural mechanics.FSI considers the interaction between two different physical phenomena. There are different models for fluid-structure coupling modeling,which are one-way and two-way coupling (Khawaja et al., 2017).
Studies on the hydrodynamic behavior of netting and the flow field through a fishing net have been carried out for several decades using theoretical analysis, flume tank experiments, and numerical simulations. Song and Yang (1999) theoretically studied the hydrodynamic performance of hexagonal netting and analyzed the structural characteristics of the hexagon. Zhan et al. (2006) derived expressions for the drag coefficient, which depends on the solidity ratio of the fishing net;the effect of Reynolds number, mesh pattern, and flow direction on the drag force on planar and circular nettings was examined experimentally.Patursson (2008) investigated flow through and around netting panels with CFD simulations and tow tank tests. Their results indicate the CFD simulations can reproduce the hydrodynamic coefficients and the velocity reduction of the netting with satisfactory accuracy. Wan et al.(2002) used a mass-spring model and an energy conservation model to simulate the shape and tension distribution on underwater netting. Zhao et al. (2013a, 2013b) used a porous media model to analyze the hydrodynamic forces on the netting and the surrounding flow field distribution downstream from the netting, and they found that their results obtained with the porous media method were consistent with experimental data. Bi et al. (2015) used the multi-empty medium model combined with the concentrated lumped mass model to derive a coupling model, which was used to calculate the hydrodynamic forces and deformation of flexible netting, and to the analyze surrounding flow field. Chen and Christensen (2016) developed a numerical model in OpenFOAM to study steady current flow through planar netting and circular fish cages. Yao et al. (2016) proposed a novel hybrid volume method to analyze the interaction between the netting mesh and surrounding flow field, which was used to calculate the interaction between the fluid and net cage when the deformation was large. Tang et al.(2017a, 2018) carried out model tests with knotless PE and polyamide(PA) netting, and they investigated changes in the hydrodynamic coefficients of knotless PE and PA netting panels with different solidity ratios under varied current speed and attack angles. Empirical formulas describing the drag and lift coefficients as functions of attack angle,Reynolds number, and solidity ratio. Myrli Odd Einar Lockertsen (2017)used a unidirectional FSI in ANSYS software to simulate nettings, and the effects of netting materials (PA, polyester, and polyurethane) and solidity ratio on deformation and the resulting low field were analyzed.More recently Kebede & Winger, 2020 evaluated the hydrodynamic characteristics of knotted and knotless meshes constructed of braided,twisted, and helical ropes. Few studies have focused on the hydrodynamic characteristic of fishing gear and flow field analysis using 3D numerical simulations based on FSI one-way coupling. However, characterized by netting properties, deformation of the mesh under flowing water and the distribution of the surrounding flow field are rarely studied.
The purpose of this study was to numerically investigate the effect of solidity ratio and attack angle on the hydrodynamic forces, flow field,and structural deformation of PE netting using the FSI one-way coupling in ANSYS. Thek-ωSST model was used to describe the flow field through the netting and examine turbulent flow. A large deformation non-linear finite element model was used to describe the flexibility of the netting structure and capture knot displacement. Results from the numerical model were compared with experimental data obtained by Tang et al.(2017a).
2. Materials and methods
2.1. Description of fluid flow model
Water is an incompressible Newtonian fluid, and the flow was considered as a viscous three-dimensional unsteady boundary layer turbulent flow. Thek-ωSST model is a turbulence model with extensive applicability. This model is typically more accurate in predicting the details of the wall boundary layer due to the enhanced wall treatment as default (Menter, 1994). The three-dimensional incompressible fluid Reynolds averaged Navier-Stokes (RANS) equations were used to solve the governing equations using the classical finite volume method in ANSYS FLUENT. The mass and momentum conservation laws are used to describe changes in fluid motion because the fluid is a single component and does not involve heat exchange. Eqs. (1) and (2) define mass and momentum conservation, respectively.
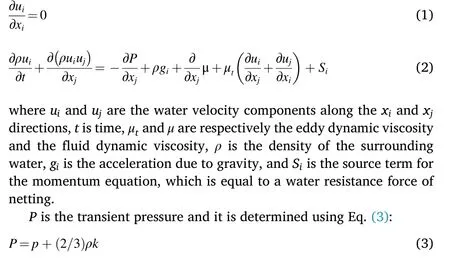
wherepis the time average pressure andkis the turbulent kinetic energy.
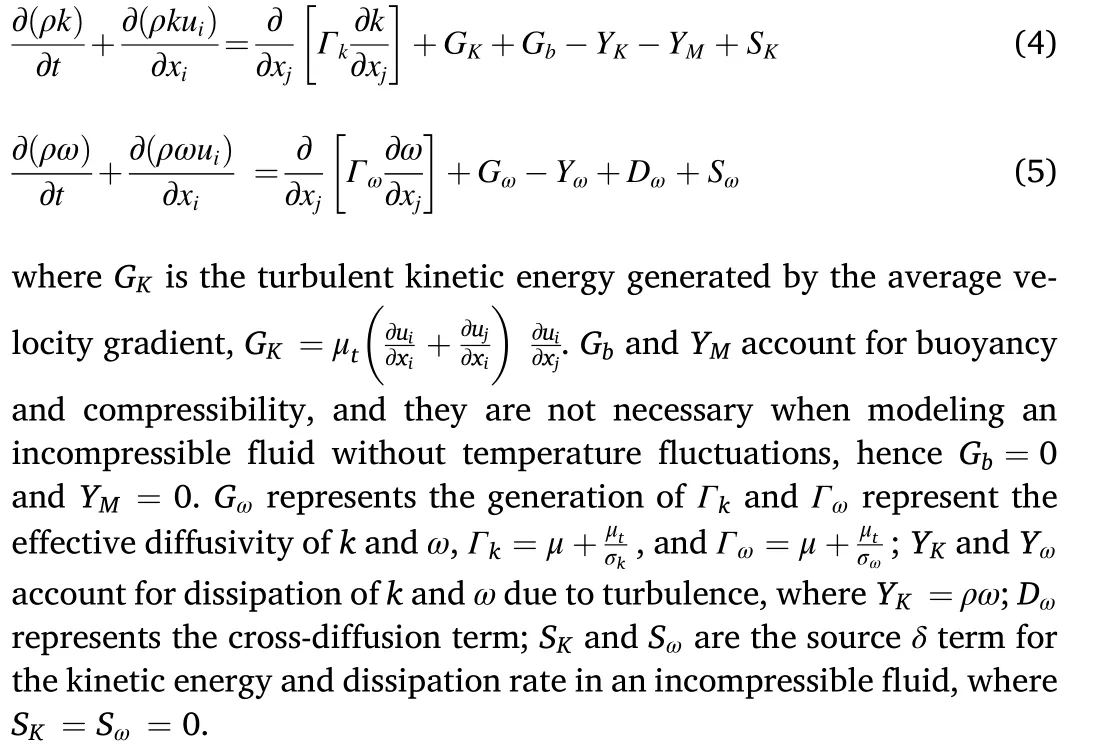
The SST model is a modifiedk-ωturbulent model and is as accurate as any other two-equation model for predicting mean flow. This model is a hybrid of thek-ϵandk-ωturbulence models and can automatically switch between the main flow and near-wall areas (Menter, 1994). The following equations are transport equations forkandω. Thek-ωSST model was empirically derived from the two others and uses several functions.
The governing equations were solved by using a three-dimensional pressure-based Navier-stokes solver. The semi-implicit method for pressure-linked equations consistent (SIMPLEC) algorithms was used to calculate pressure-velocity coupling. The discretization scheme for pressure, momentum, turbulent kinetic energy and turbulent dissipation rate are carried out using a second-order upwind scheme. The solution is assumed to be converged when all residuals is reduced to less than0.001.
2.2. Non-linear finite element structural model
A large deformation nonlinear structural finite element model was used to analyze the structural deformation of the netting in the fluid current. In this study, the six degree of freedom (DoF) beam element was used to simulate the netting, in which the beam element was connected with rotatable joints (i.e., the joint cannot withstand the bending moment). The geometric structure of the netting in the current was assumed to be a non-linear structure with large deformation. Thus, according to the virtual force principle and Newton’s second law, the dynamic equation of the flexible net structure is:
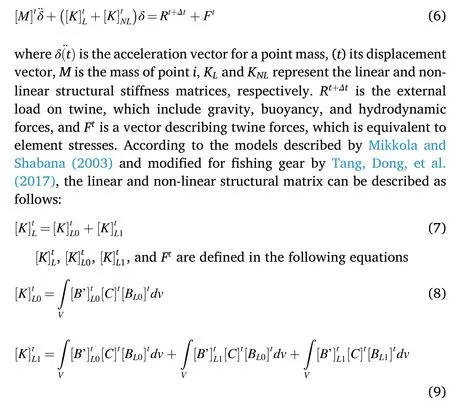

whereBLandBNare the elements of the linear and non-linear straindisplacement transformation matrices, respectively;Cis the material constitutive matrix; [S]tand [̂S]tare a second Piola-Kirchoff stress matrix and vector in the configuration at timet,respectively;Vis the domain of integration in the configuration at timet.
In this numerical model, there are two sets of elements and nodes:one for the flow fluid and another for the netting structure. The pressure(Pn) on the fluid nodes located at the fluid-structure interface can be obtained by solving thek-ωSST model, and the line loads (PL) acting on the netting element can be calculated by integrating the pressure on the fluid-structure interface along the outer perimeter of the netting as follows:
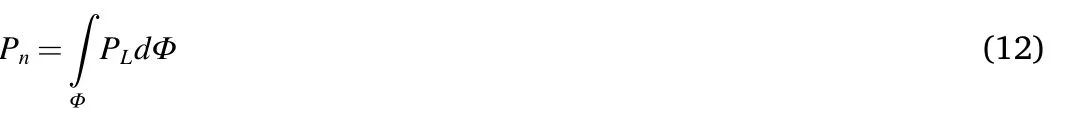
wherePnis the surface pressure on the FSI,PLis the line load on the netting, andΦis the outer perimeter of netting. The line load acts on each netting element as an input hydrodynamic load and is used to calculate the deformation of netting structure using the nonlinear structural model.
Due to the nonlinearity of the netting in the current, the Newton-Raphson method was used to solve the resulting non-linear algebraic problem in Eq. (6).
2.3. Numerical simulation setup

Fig. 2. Mesh distribution of the CFD model used in the numerical simulation of a netting in current.
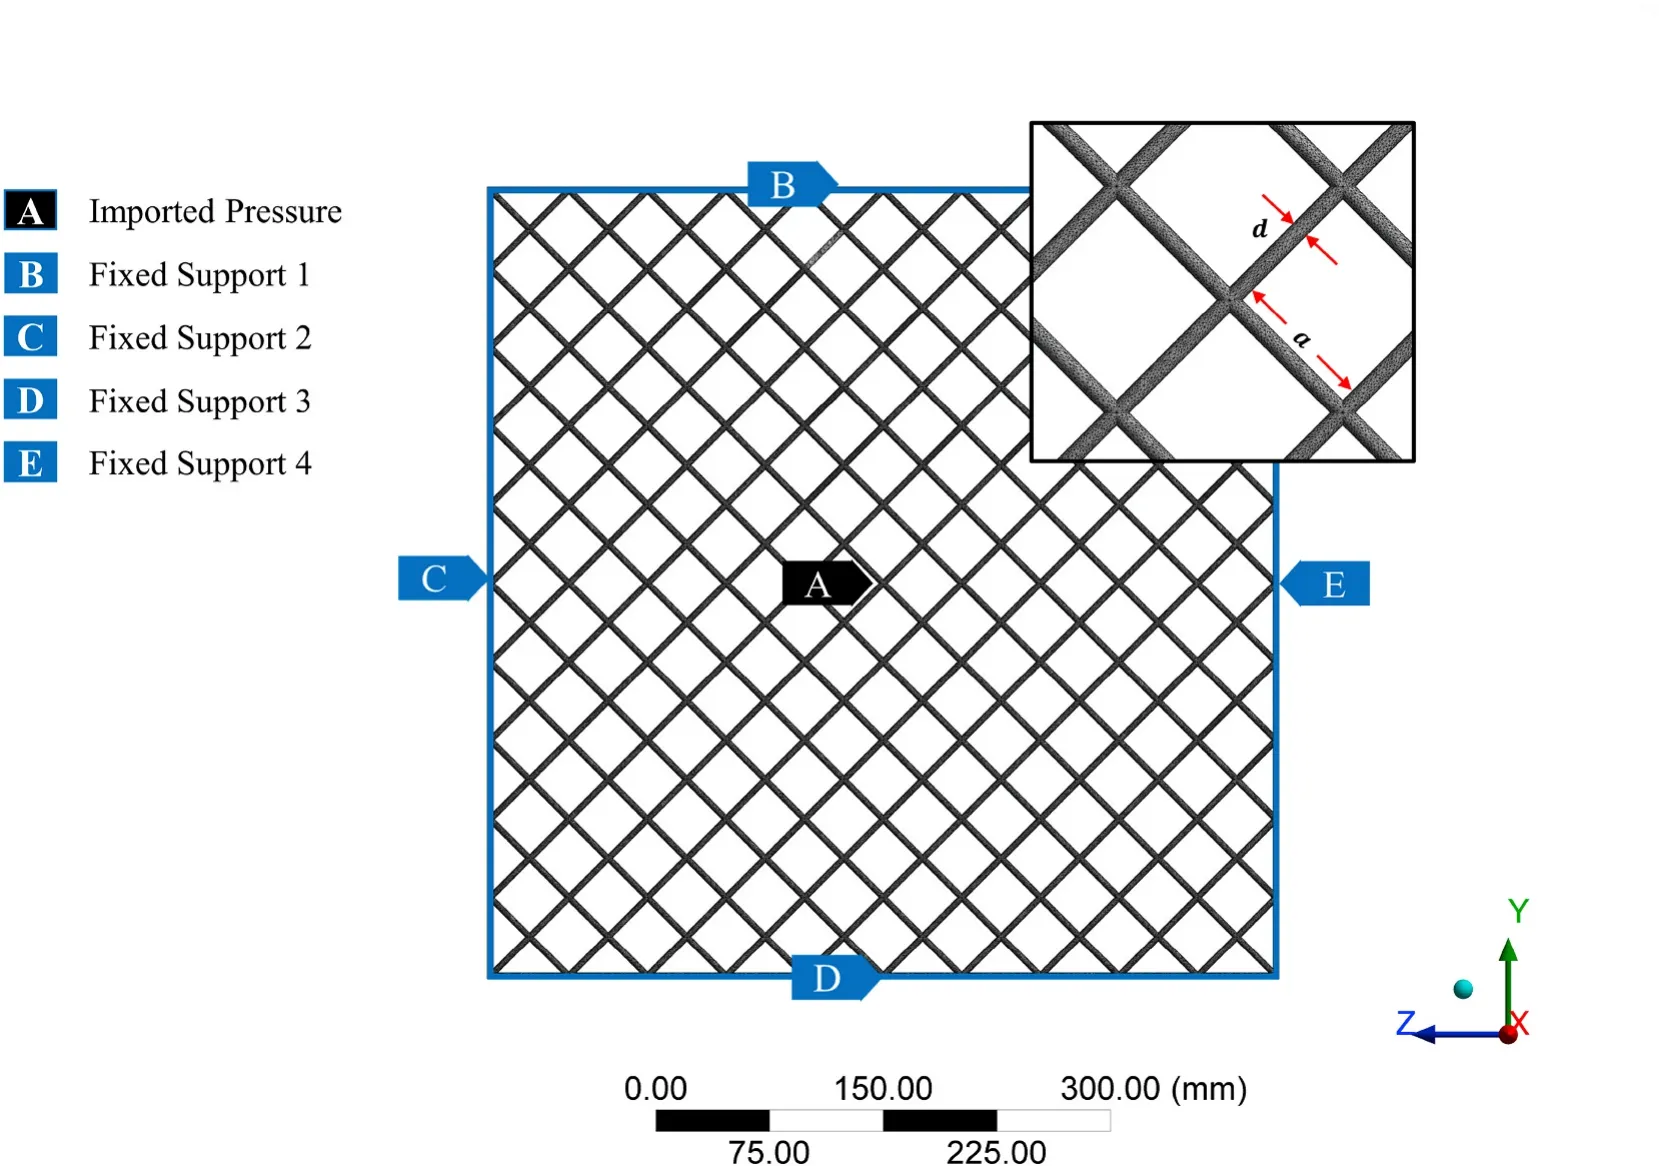
Fig. 3. Mesh distribution of the Finite element model and constraints.
The netting structure used in the numerical model is shown in Fig. 1 with a diamond mesh. The netting structure is represented by numerous cylinders, which are obstacles to fluid flow. The frame is represented in this study using four cylinders (Fig. 1).
2.4. Boundary conditions and computational grids
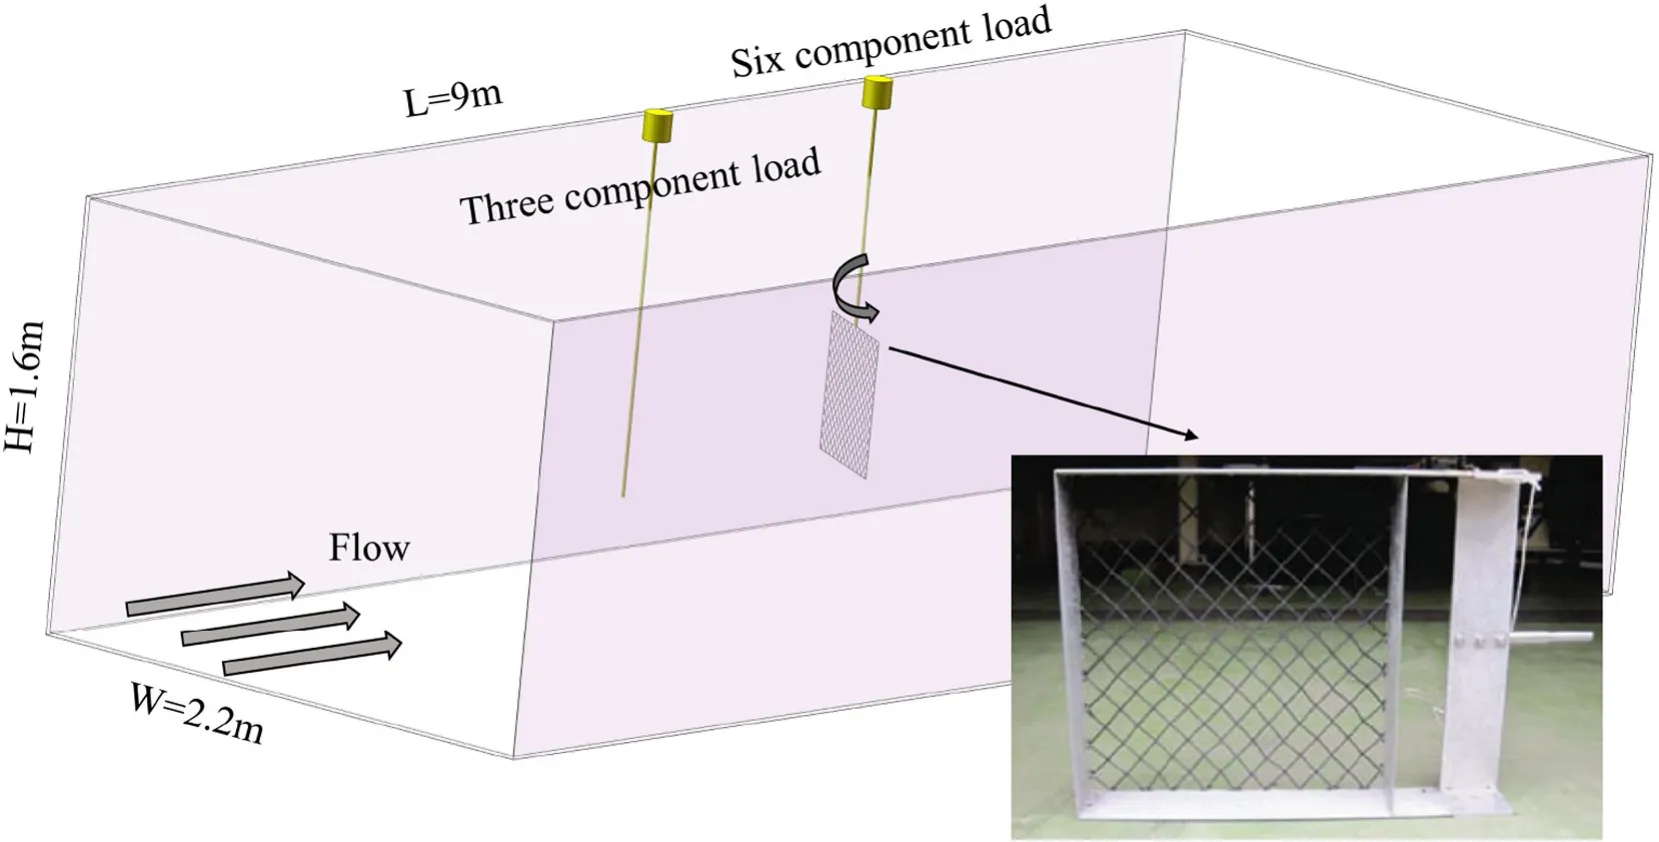
Fig. 4. Schematic diagram of physical model test apparatus for hydrodynamic experiments of netting.

Table 1 Structure parameters of the netting and material properties used in the simulations.
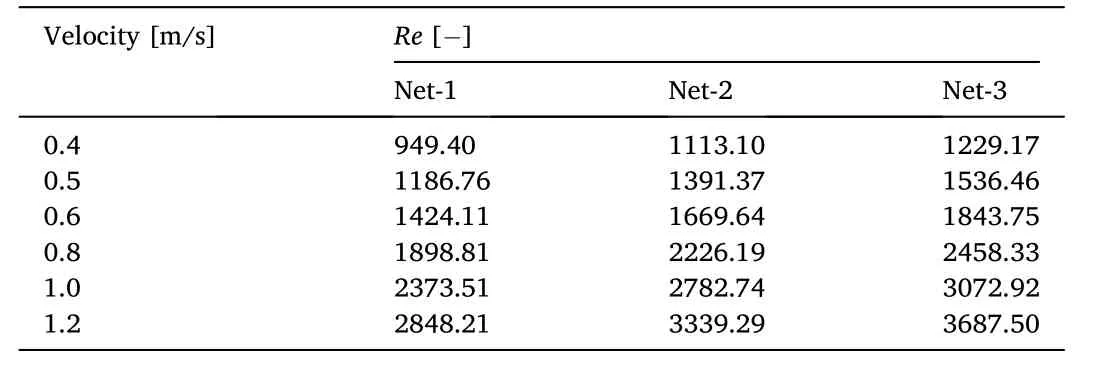
Table 2 Corresponding Reynolds number for each netting.
In order to provide a fair comparison with empirical flume tank data(see below), a similar domain was used (9.0 m length, 2.2 m wide, and 1.6 m deep) in the numerical modeling when calculating the hydrodynamic forces and simulating fluid flow through the netting. The boundary of the numerical water flume is constituted by the fluidnetting interface, flow inlet surface, smooth wall surface, and flow outlet surface. The left face of the computational domain was set as the velocity-inlet boundary representing the inlet surface. At this surface,the flow velocity is set to the incoming flow velocity and the pressure is set to zero. The coordinate system in the numerical model is a righthanded 3D Cartesian coordinate system. The origin of coordinates was set to the center of the plane netting on the free surface. In the coordinate system,xrepresents the flow direction,ypoint upward andzis perpendicular to the flow direction in the horizontal plane. When using ak–ωmodel to calculate turbulent flow, the inlet turbulence quantities(kandω) of the velocity-inlet boundary should be specified. In this study, the inlet turbulence quantities (kandω) are calculated as follows:
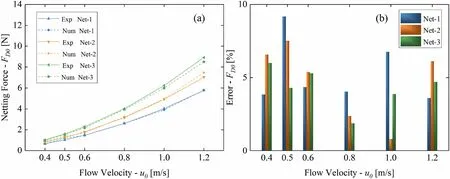
Fig. 5. Comparison of parallel drag between numerical simulation and flume tank experimental study (a), and relative error (b).
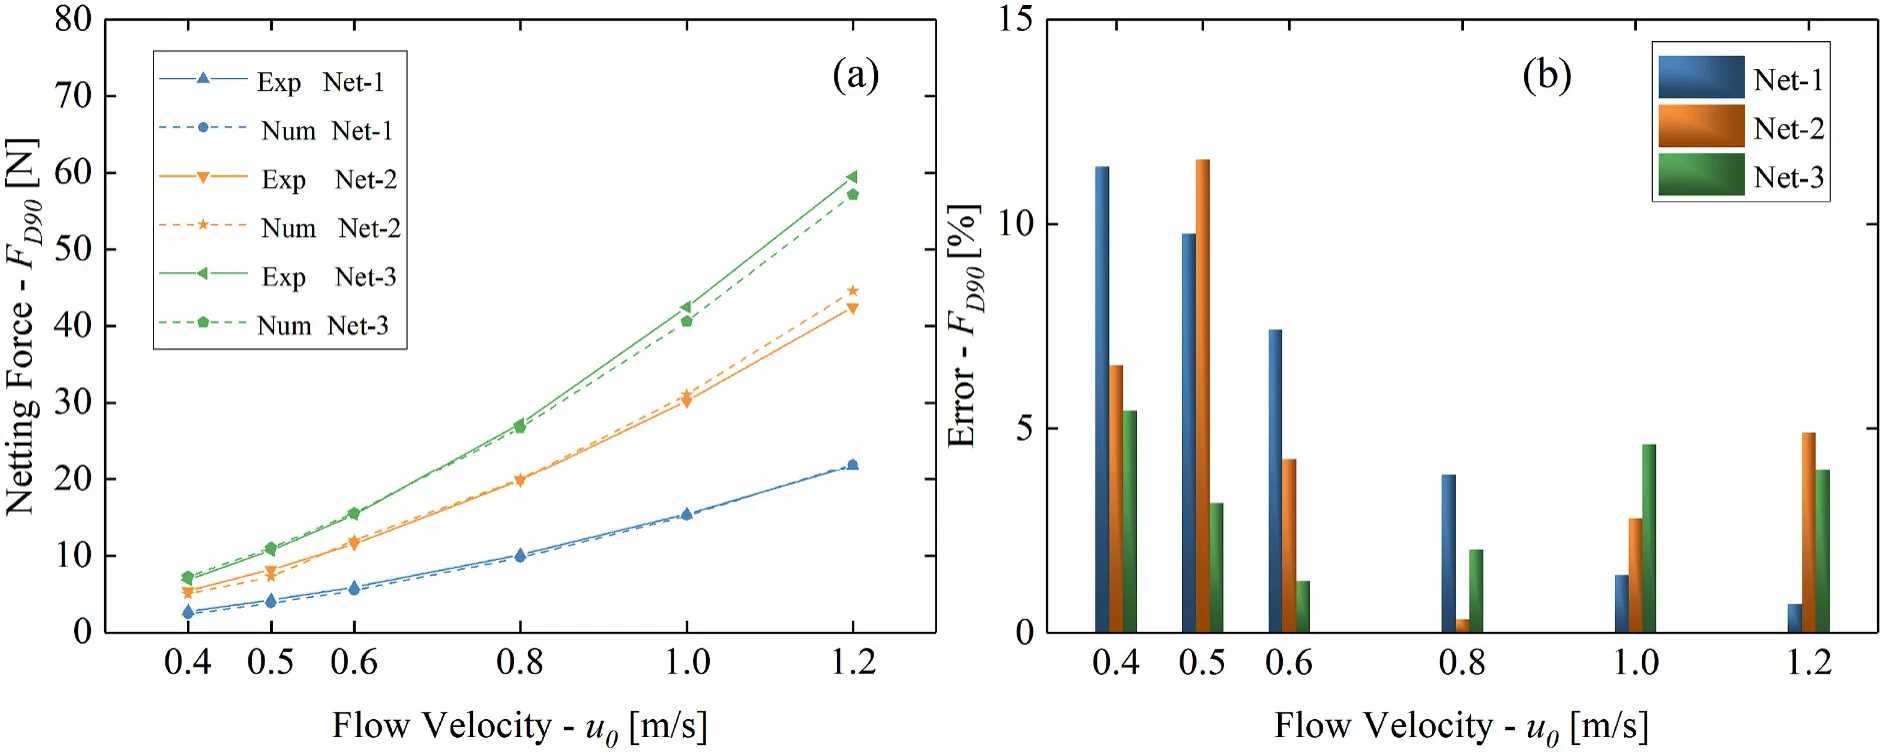
Fig. 6. Comparison of normal drag between numerical simulation and flume tank experimental study (a), and relative error (b).

Fig. 7. Comparison of polyethylene netting drag with different net solidity as a function of the attack angle for each flow velocity between numerical simulation and flume tank experiment data.
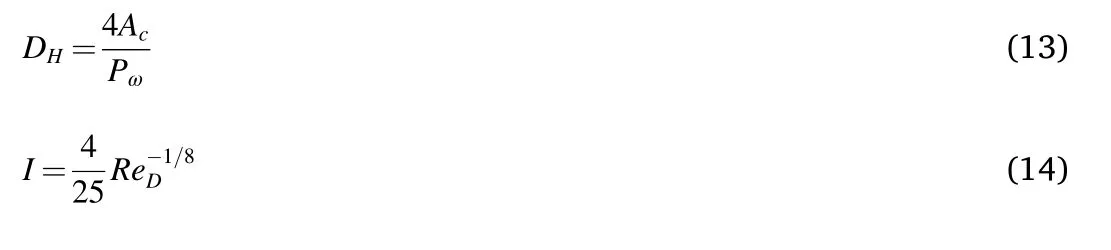
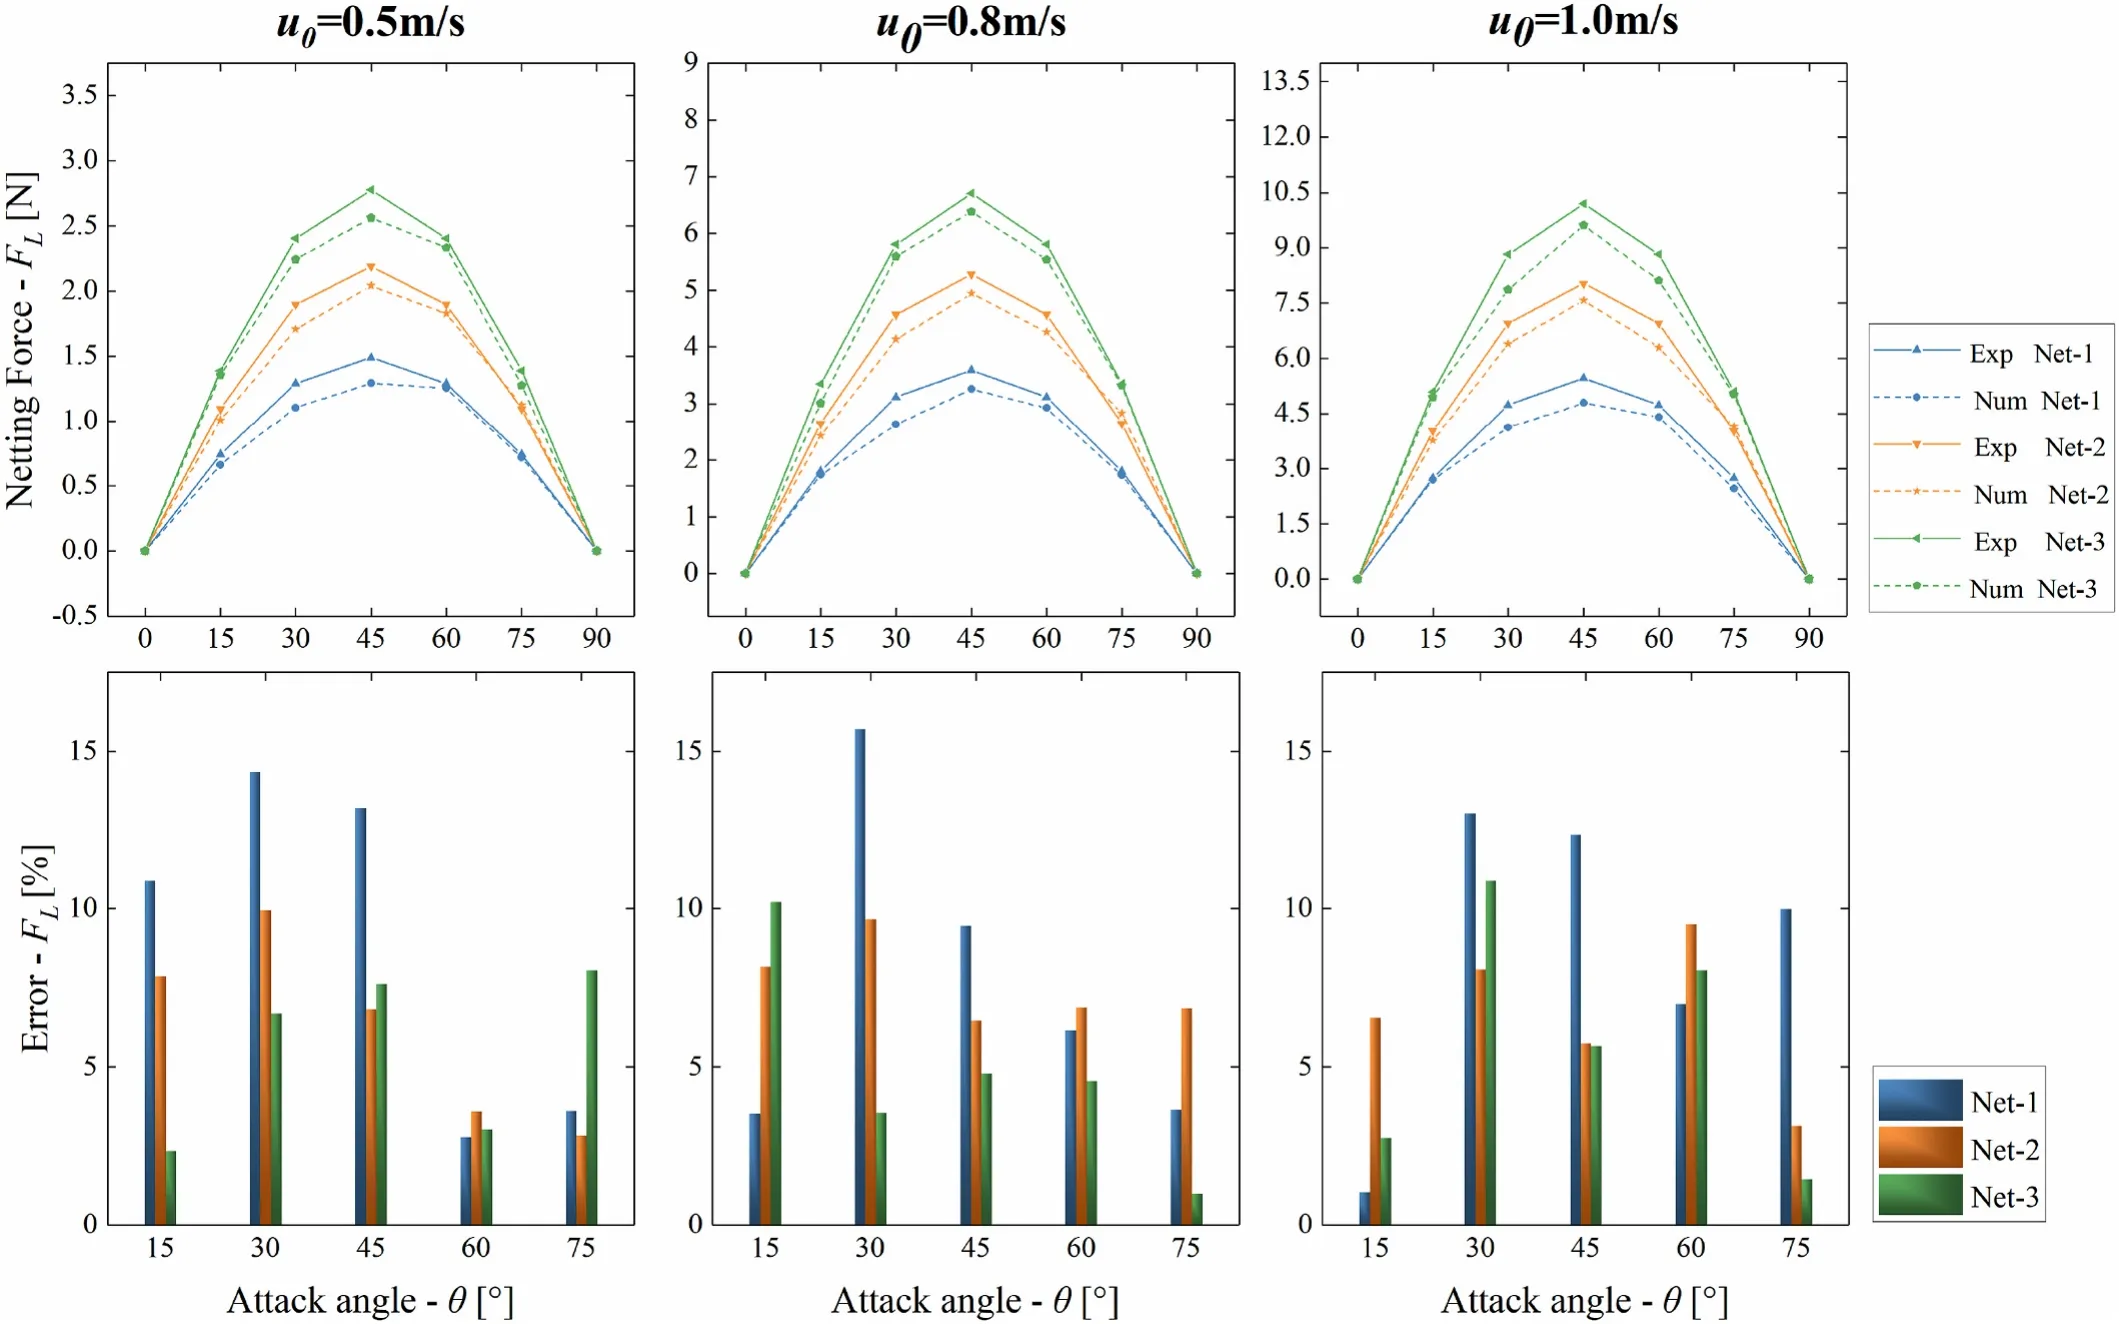
Fig. 8. Comparison of polyethylene netting lift with different net solidity as a function of the attack angle for each flow velocity between numerical simulation and flume tank experiment data.
whereDHis the hydraulic diameter,Iis the turbulence intensity,Acis the cross sectional area of the numerical flume,Pωis the wetted perimeter of the cross-section of the numerical flume andReDis the Reynolds number as a function of the hydraulic diameter of the flume(DH). In order for the numerical and empirical results to be consistent,DHwas assumed to be 1.6 m in the present study in order to match the diameter of the impellers used in the flume tank as described in Tang et al. (2017a). The optimal mesh type and grid size can be determined by using the full-hexahedral mesh in such a way that fine grids are used to describe the netting. At the fluid-netting coupling interface, a growth rate of 1.2 was defined around the netting, and the maximum cell size in the domain was varied from 20 to 40 mm. Compared with other turbulence models, thek–ωSST model can be integrated through the viscous sublayer without the need for a two-layer approach. This feature can be utilized for ay+insensitive wall treatment by mixing the viscous sublayer formulation and the logarithmic layer formulation based ony+.Thus, in consideration of the low Reynolds number. The maximum layers ofy+= 15 were set around the netting structure model. To achieve the optimal mesh type and grid size, unstructured full-tetrahedral grids are applied to generate the mesh of numerical simulation water tank, structured grids are applied for the netting and the curvature size function with the curvature normal angle of 12◦was applied to refine the mesh close to the netting using the grid generation tool meshing solver of Ansys Workbench software 15.0. An example of computational grids for netting 1 at attack angle of 90◦is shown in Fig. 2. The cell mesh number was 15832743. For large deformation non-linear finite element model, bar elements were also divided by unstructured full-tetrahedral grids with cells mesh number of 2189253 (Fig. 3). Fixed support boundaries were defined at the top, sides, and bottom of the netting(Fig. 3).
2.5. Experimental verification of the fluid-netting interaction model
Experimental results from Tang et al. (2017a) were used to validate the numerical model. Their experiment was conducted in a flume tank(9.0 m length, 2.2 m width, and 1.6 m deep) at Tokyo University of Marine Science and Technology (TUMST), as shown in Fig. 4. Drag and lift were measured with a three component load cell (5 kgf capacity),and data was sampled at 20 Hz for 20 s. The freshwater temperature was 9◦C, the water density was 0.9998 g/cm3, and the kinematic viscosity was 0.01341 cm2/s. Three knotless PE nettings with diamond mesh and different net solidity ratios were used in the present numerical simulation, as shown in Table 1.
SOLIDWORKS® was used to build 3D model of the netting. In the experimental flume tank, the netting was fixed on a steel frame with 0.7 m width and 0.7 m height, and the netting was positioned in the center of the flume tank in the center of the flume tank in the manner similar to Lee et al. (2007) and Kebede et al. (2020). The inclined drag and lift forces were calculated when the incoming flow velocities were 50, 80,and 100 cm/s, and normal and parallel drag force were measured when the incoming velocities were 40, 60, and 120 cm/s. The attack angle was varied from 0◦to 90◦in 15◦intervals (Fig. 4).
Solidity ratio (Sn) is defined as the ratio of the projected area (SP) to the outline area (S0) of the netting (Tang et al., 2019). This quantity is typically used to characterize the geometric characteristics of a netting.For a knotless netting, the solidity ratio (α) can be calculated with the following equation:
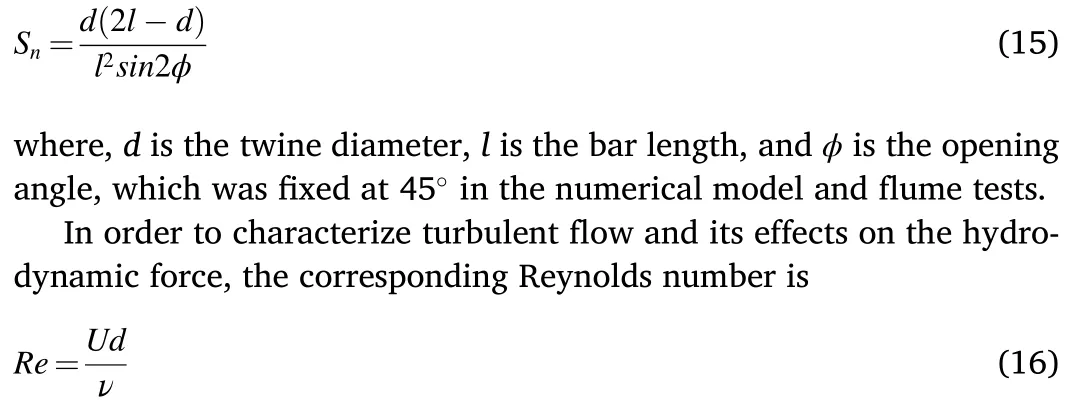
where,dis the twine diameter,νis the dynamic viscosity of water, andUis the flow velocity. The studied Reynolds number is described in Table 2. This table shows that the Reynolds number for the netting varies from 949.40 to 3687.50, which shows that turbulent flow develops through the netting which justifies the use of thek–ωmodel.
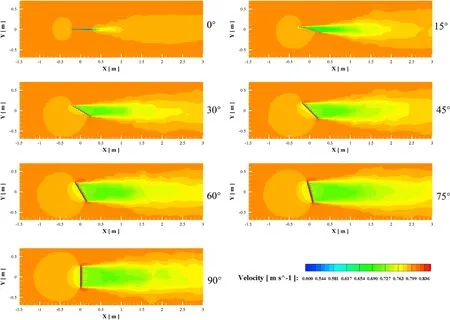
Fig. 9. Velocity distribution through the netting in different attack angle.
3. Results
3.1. Parallel and normal drag on PE knotless netting
The parallel and normal drag forces increased as the solidity ratio increased (Figs. 5 and 6). The results show that the parallel and normal drag increase quadratically as flow velocity increase. The calculated parallel drag on nets 1–3 was found to be 5.29%, 4.79%, and 4.33%lower than the values obtained from the flume tank experiment,respectively (Fig. 5). The normal drag calculated with the numerical model is 5.76%, 5.074%, and 3.4% less than the values obtained from the flume tank experiments for nets 1–3, respectively (Fig. 6). Fig. 5b shows that the maximum relative error is 9.17%, 7.51%, and 5.98% for nettings 1, 2, and 3, respectively. In addition, Fig. 6b shows that the maximum relative error is 11.40%, 11.58%, and 5.43% for nettings 1, 2,and 3, respectively.
3.2. Drag and lift when the netting was inclined to the flow direction
As shown in Figs. 7 and 8, the numerical results are consistent with the flume tank data, and the results obtained during the experimental investigation were greater than the simulation results. Both sets of results indicate drag increases as the attack angle and solidity ratio increases when the knotless PE netting is inclined. The lift increased with as the solidity ratio increased, and it tends to increase as the flow velocity increased; this is seen in the numerical and experimental results.The lift reaches its maximum when the attack angle is 45◦, which subsequently decreased as the attack angle increased.
The relative error between the numerical and experimental results is presented in Figs. 7b and 8b. The relative error in the inclined drag and lift forces varied with flow velocity and attack angle, so the relative error is maximized when the attack angle is less than 30◦and the flow velocity is 0.5 m/s in netting 1, when the attack angle is less than 15◦and the flow velocity is 1 m/s in netting 2, and when the attack angle is less than 30◦and the flow velocity is 0.8 m/s in netting 3. The maximum relative error in inclined drag is ~15.47%, ~11.09%, and ~9.78% for the nettings 1, 2, and 3, respectively. In addition, the maximum relative error in lift is ~15.07%, ~9.94%, and ~10.89% for nettings 1, 2, and 3,respectively.
3.3. Velocity distribution and attenuation
As shown in Fig. 9, there is a small velocity attenuation zone upstream from the netting and a very large velocity attenuation zone downstream from the netting corresponding to the wakes astern from the netting and turbulent flow around the netting. These results also show that increasing the attack angle increases the velocity attenuation zone (wake zone). The velocity reduction in the wake region is maximized when the attack angle is 90◦.
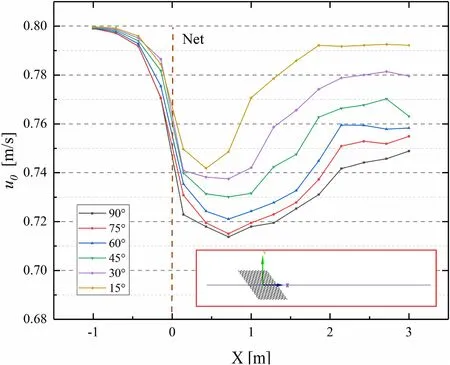
Fig. 10. Flow variation along central line through netting at different attack angle.
An obvious velocity reduction occurs along the centerline of the netting, and this velocity reduction decreases as the inclination angle decreases (Fig. 10). The fluctuations in the magnitude of the velocity variation exist along the centerline of netting atx= −0.2 m upstream and atx= 0.5 m downstream from the netting for all attack angles.These fluctuations are mainly due to the effect of wake from the mesh opening in the netting, which indicates the development of turbulent flow due to wakes around the netting causing the velocity to decrease(Fig. 10). From this point (x=0.5 m downstream from the netting), the velocity field started to increase, and the velocity field increased at a faster rate as the attack angle decreased. When the attack angle is less than 45◦, changing the attack angle does not have a great effect on the velocity reduction, but this effect is very important when the attack angle is greater than 45◦. This is due to the netting mesh opening, which is meant to allow water to pass through the netting.
Fig. 11 shows the vertical distribution of flow field downstream from the netting and it shows that the velocity reduction is largest atz=0 m,which indicates the wake zone and turbulence are very important at this depth. This wake zone is a factor ~1.5 larger than the netting width. One can see that the velocity reduction increases as the attack angle increases.
The velocity reduction ratiouratx= 1 m downstream from the nettingurcan be calculated using Eq. (17):

whereu2Wis the velocity at 1 m downstream from the netting andu0is the incoming velocity.
On average, the velocity reduction ratio is 4.98%, 8.7%, and 10.32%for nettings 1, 2, and 3 (Fig. 12). Increasing the solidity ratio leads to an increase in the velocity ratio. One can also see that the velocity ratio decreases slowly as the incoming velocity increases.
3.4. Effect of solidity ratio on netting deformation
Fig. 13 shows that the netting deformation distribution is too concentrated at the center of the netting. Therefore, the netting experiences greater deformation at its center compared to other part of the netting because the four sides of the netting are fixed. One can see that the deformation distribution increases as the flow velocity increases(Fig. 13). The maximum total deformation of each netting at different flow velocities is presented in Fig. 14. This figure shows that the maximum total deformation increases as the flow velocity increases and solidity ratio decreases. The different curves show that the maximum total deformation increases quadratically as the flow velocity increases.
As shown in Fig. 15b, the maximum stress on each netting increases as the flow velocity increases and as the solidity ratio decreases. On average, the maximum stress on netting 1 is 13.27% and 27.53% greater than that on nettings 2 and 3, respectively.
Fig. 15a shows that the stress distribution is too concentrated on the sides of the net, but the maximum value at these sides is not larger than that at the center. This is because the netting stress distribution on the sides of the netting is ~19.98% greater than that at the center. Note that the netting stress distribution contour is like an ellipse.
4. Discussion
The use of numerical simulations allows a gear designer to analyze several different designs at an early stage and select the best design to be tested experimentally in a flume tank and sea trial. Simulations are effective for interpreting and predicting fishing gear performance (e.g.,Li et al., 2015; Nguyen et al., 2015). Previous studies by Chen and Christensen (2016) and Bi et al. (2014, 2015), as well as the present study, show that the simulated hydrodynamic performance and flow field through the netting are consistent with experimental results from flume tank tests.
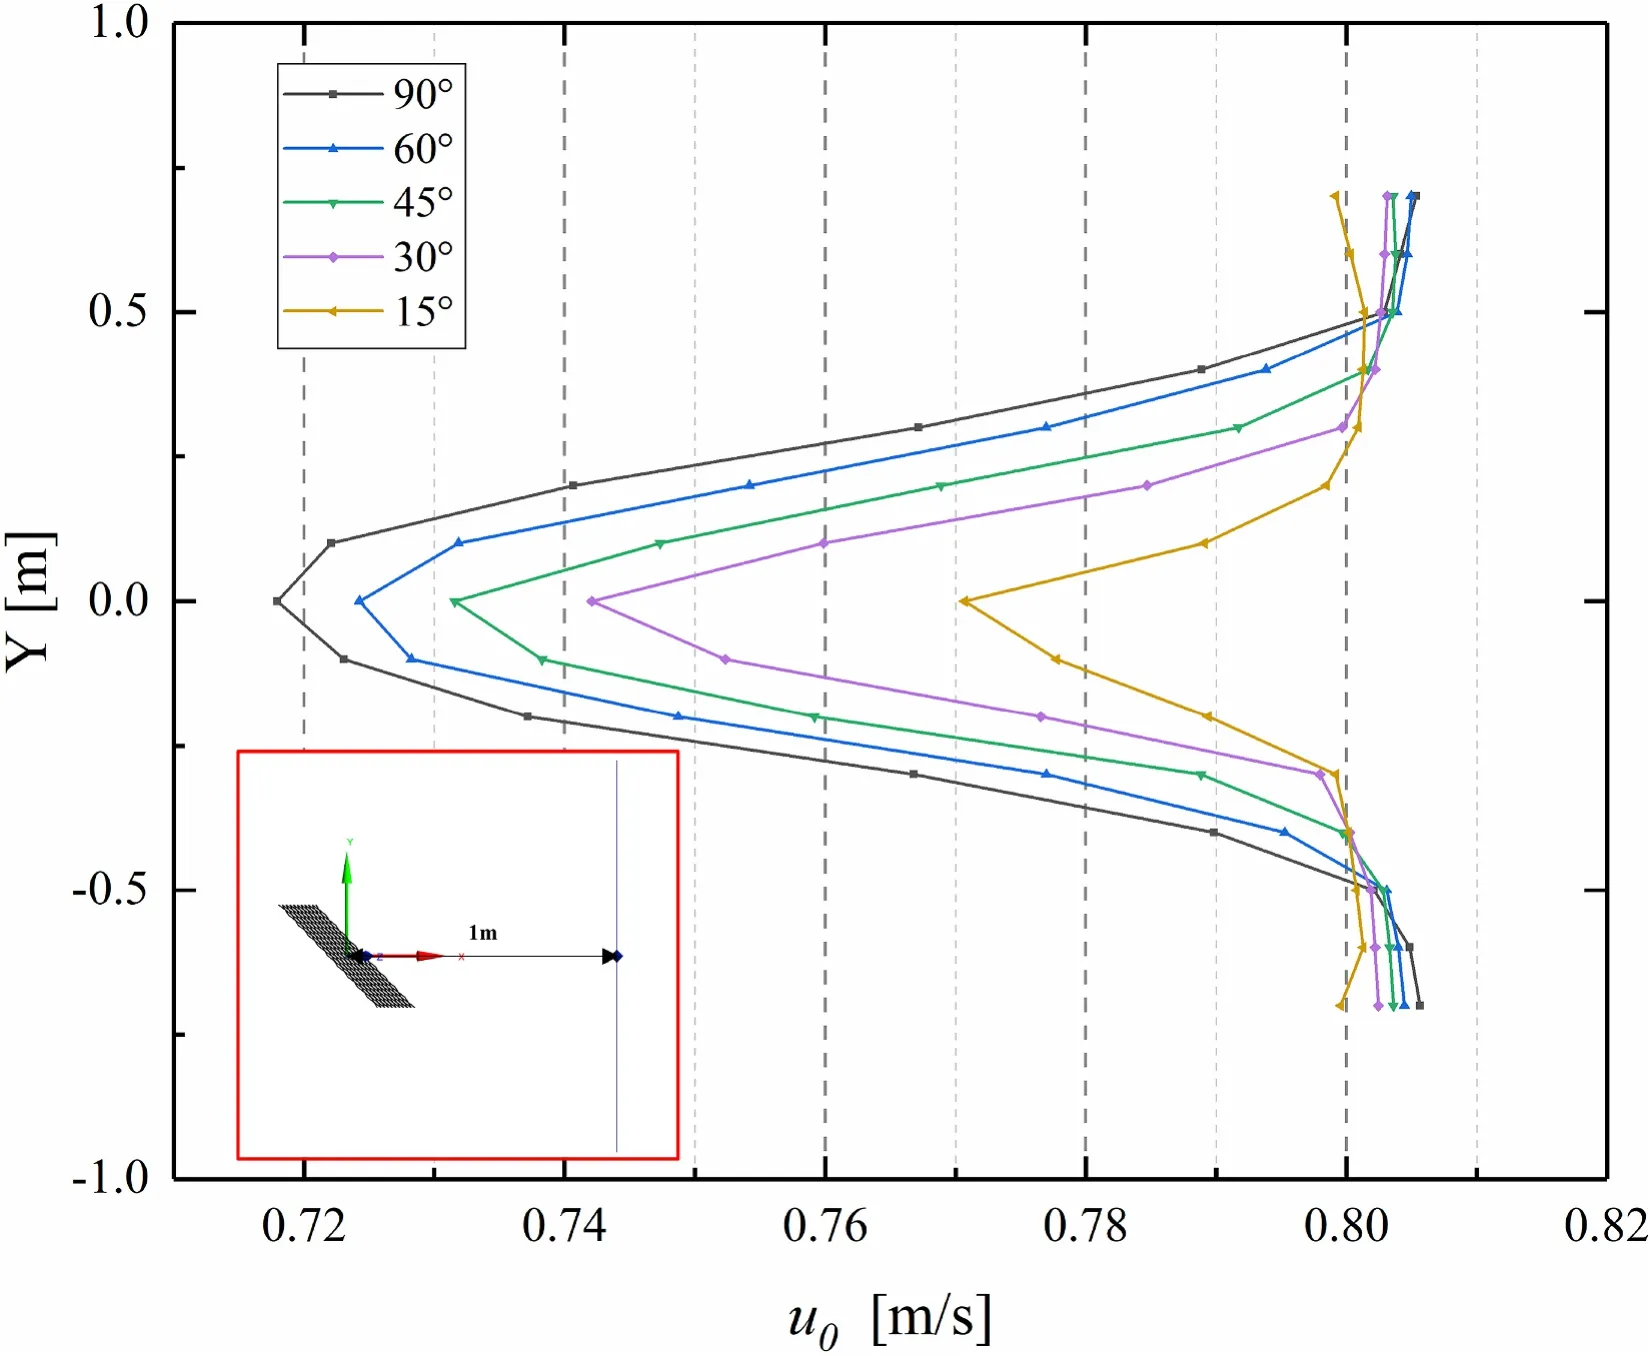
Fig. 11. Depth variation of velocity field downstream the netting in different attack angle at x = 1 m.
In the present study, FSI with one-way coupling is used for simulations. Indeed, only the deformation of the netting due to flowing water was considered, and the mesh for the flow field was not considered(Chen & Christensen, 2017). The simulation results for the three nettings in different directions and attack angles were compared with the physical results. There are the differences between the numerically and experimentally determined data for the hydrodynamic forces. It is possible that changes in the flow field around the netting due to a thicker frame affects the force on the mesh during flume experiment (Tang et al.,2019). However, the netting model is simplified and approximated as a cylinder, unlike the twisted rope netting used in the present numerical model (Kebede & Winger, 2020). It is currently impossible to determine the surface roughness of the knotless PE netting (Tang et al., 2017a).During the calculation, the surface roughness of the mesh was set to 0.1 mm. When the flow velocity is lower, the friction between the water flow and the netting leads to larger drag forces on the netting due to the fact that the average error in the experimental data is greater than that due to a higher flow velocity (Bi et al., 2014). Moreover, Patursson et al.(2010), Zhao et al. (2013a), and Chen and Christensen (2016) used the porous media method to simulate the flow around netting and net cage,and they obtained a relative error in hydrodynamic forces of approximately 4%, 2.3%, and 21.55% greater than that found in the present study, respectively. Also, Yao et al. (2016) used a hybrid volume method to calculate hydrodynamic forces on the netting and to calculate the flow fields through the net; they obtained a relative error in drag forces of approximately 0.5% greater than that of this study. Therefore, it can be inferred that different physical models and numerical methods will cause differences in the results.
In contrast to the investigation of Patursson (2008), Zhao et al.(2013a, 2013b), and Bi et al. (2017), the results presented herein show how changing the solidity ratio and attack angle can strongly affect the hydrodynamic forces on and deformation of knotless netting. Unlike previous studies (Patursson et al., 2010; Zhao et al., 2013a; Chen &Christensen, 2016; Bi & Xu, 2018), the FSI model based on one-way coupling with a large deformation nonlinear structural finite element model has been used in this study. Thus, the current numerical and prior experimental results show that the use of a netting with lower solidity ratio (smaller twine diameter and larger mesh size) experience smaller hydrodynamic forces. This trend was confirmed in the experimental studies conducted by Tsukrov et al. (2003), Kumazawa et al. (2012), and Tang et al. (2017a), who showed the hydrodynamic forces were weaker when a net had lower solidity ratio and lower attack angle. The use of a knotless netting with lower solidity ratio in a trawl net could theoretically increase the net mouth opening of a trawl, allowing vessels to create the same net mouth opening as a conventional trawl, but with reduced door size, flotation on the headline, and weights on the footline(Sala et al., 2008).
The knot type is an important factor that can strongly affect the hydrodynamic forces on a fishing net. Therefore, comparing our results and those obtained by Milne, 1979, Balash et al. (2009), and Hosseini et al. (2011), it can note that the advantage of knotless nettings is that they have a lower hydrodynamic force compared to that knotted nettings. Results from Tang et al. (2018) showed that the drag forces on the knotless netting are 18.70%–26% lower than those on a knotted netting.This large difference can be justified by the fact that the turbulent flow developing in the wake zone downstream from the knotless netting is less important compared to that developing downstream from the knotted netting. Hence, accounting for the formula used to determine the coefficient of velocity reduction proposed by Løland (1993), we found that the coefficient of velocity reduction for a knotless netting is greater than that for a knotted netting. This leads to a velocity decrease in the wake region downstream from the knotted netting that is greater than the velocity reduction seen downstream from a knotless netting in the wake region. Thus, trawl nets and purse seines should be made from knotless netting because the drag force will be considerably lower and will facilitate passage of water through the mesh.
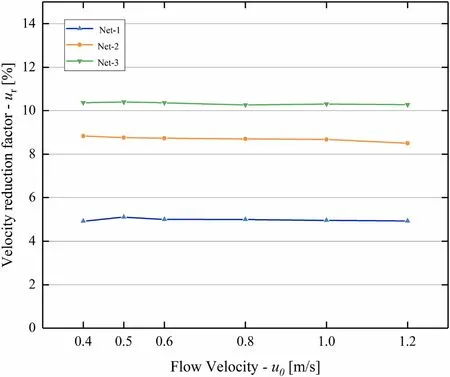
Fig. 12. Velocity ratio of different nettings at different incoming flow velocity.
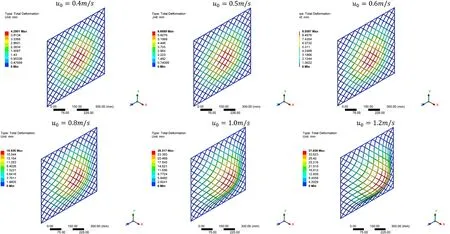
Fig. 13. The deformation distribution of netting at the solidity ratio of 0.213 as function of flow.

Fig. 14. The netting maximum total deformation as function of flow velocity.

Fig. 15. The netting stress distribution (a) and the netting maximum stress as function of flow velocity (b).
The results in the present study reveal a large velocity reduction in the wake zone upstream and downstream from the netting, and this velocity reduction zone varied as a function of attack angle. The flow in this wake zone is turbulent and consists of a laminar boundary layer (Bi et al., 2017). Energy exchange occurs in this turbulent boundary layer because of the transition from laminar flow to the turbulent flow (Chen& Christensen, 2017). This energy exchange occurs because fluid flowing through the mesh and around the netting presented a high incidence due to the attack angle. The velocity reduction in the wake zone occurs due to loss of momentum from drag and the motion of the netting (Chen& Christensen, 2017). The location where the differences in the velocity fields arise can be called a transition zone.
In this transition zone, the flow also has a boundary layer. The velocity distribution presented in Fig. 9 shows the same characteristics as the flow field shown in the previous studies where the porous media method was used (Bi et al., 2015, 2014; Patursson et al., 2010; Zhao et al., 2013b, 2013a). Along the incoming flow direction, the width of the wake is approximately the same as the netting. Meanwhile, along the flow direction, the reduction in flow velocity is first seen a short distance in front of the netting, and the flow velocity finally reaches the steady-state downstream from the netting. However, we also notice some differences which is a slight reduction in the flow field downstream from the netting in the wake region in our study. This difference is related because, in the present numerical simulation, the netting deformation and blockage of the mesh opening as fluid flowed through the netting affect the flow field results, unlike the results in previous studies. The effect of attack angle on the velocity distribution was explored in this study and that of Chen and Christensen (2016), and it was found that the velocity reduction zone increases as the attack angle increases when the Reynolds number was 500 The vertical and horizontal distributions of the flow velocity are shown in Figs. 10 and 11, which are strongly sensitive to changes in depth and flow direction downstream from the netting. In Fig. 10, the velocity ratio reaches its maximum downstream the netting whenxvaried from 0 to 1 m; in this zone, this velocity ratio varied from 0.71 to 0.76. One finds that the attack angle increases as the velocity ratio decreases in this zone. The experimental results presented by Bi et al.(2013) show that the flow velocity ratio downstream from the netting varied from 0.83 to 0.96, and while in the present study it varied from 0.89 to 0.95, which is included in the velocity ratio obtained experimentally. Thus, the flow fields obtained in the present numerical model are consistent with the experimental data. Results from the present study and from Zhao et al. (2013a, 2013b), Bi et al. (2017), and Bi and Xu(2018) show that the attack angle is one of the main factors affecting the flow velocity distribution upstream and downstream from the netting.The flow velocity ratio along the vertical direction downstream from the netting decreased from 0.81 to 0.72 whenz(in the depth direction)varied from 0 to 0.75 m corresponding to the netting zone. The flow velocity ratio increased from 0.72 to 0.81 whenzvaried from 0 to −0.75 m. Unlike the results from Bi et al. (2013), which show that the velocity ratio increased as the solidity ratio decreased, the results presented herein show that the velocity ratio increases as the solidity ratio of the netting increases. This difference is due to the fact that conditions such as inflow, temperature, and the water and flume tank characteristics used in the present simulation and experiments are not the same, and because of the difference in netting structure (solidity ratio and mesh opening), attack angles, and incoming fluid velocity. Therefore, the experimental studies of Bi et al. (2013) and the current numerical results show that the velocity ratio increase as incoming velocity increased.Thus, the other main factors that affect the flow velocity distribution upstream and downstream from the netting are the solidity ratio and incoming velocity. It was found in the present study and in the experimental study of Bi et al. (2013) that the velocity downstream from the netting reduction and the shielding effect increases with the increasing solidity ratio which lead to the increases in hydrodynamic forces. In addition, nettings with larger twine diameter and lower mesh size(higher solidity ratio) generated larger turbulence regions and greater drag (Bi et al., 2017). Concerning deformation of a flexible netting structure, the objective of the present study was to model the PE netting in ANSYS to see if netting deformation can be predicted for given hydrodynamic forces.Fig. 13 shows that the deflection is localized to the middle of the netting in the impact area, and drag on the netting is uniformly distributed along all directions. This is because PE netting is very stiff, while twists in between the meshes produce high flexibility. The results from this study show that deformation netting is an important factor that affects drag.This netting deformation is affected by many factors, such as the elasticity of the twine material, solidity ratio, material density, and Young’s modulus (Gansel et al., 2013). Thus, the netting deformation, strain, and stress increase as the solidity ratio decreases. The netting used by Myrli Odd Einar Lockertsen (2017) had a more solid structure than the netting used in this study because he used netting for a net cage. Therefore, the netting deformation (total deformation, strain, and stress) obtained in the present study is higher than that obtained in Myrli Odd Einar Lockertsen (2017). A numerical model for investigating the hydrodynamic forces on PE knotless netting and the flow field through a netting using FSI based on one-way coupling. Thek-ωSST model was applied to describe the flow field through the netting and calculate hydrodynamic forces on the netting, and the large deformation non-linear structural finite element method was used to describe the deformation of the netting structure.The experimental results from Tang et al. (2017a), which were obtained in a flume tank, were used to validate the numerical model. The results showed that the difference between the numerical simulation and the flume tank data was less than 6.8%, indicating the numerical model could reproduce the experiments adequately. The flow in the wake region is completely turbulent due to the netting wake. The velocity reduction downstream of the netting and in the wake region was varied from 11% near the netting to 4.98% far to the netting. This velocity reduction increase as the solidity ratio and attack angle decrease,resulting in a low drag coefficient. In addition, it was found that the deformation and the stress of netting increase averaged ~42.85% and 22.35%, respectively as the solidity ratio decreases. Acknowledgements This study was financially sponsored by the National Natural Science Foundation of China (Grand No. 31902426, 41806110), Shanghai Sailing Program (19YF1419800), China Postdoctoral Science Foundation funded project (2018M630471), and Special project for the exploitation and utilization of Antarctic biological resources of Ministry of Agriculture and Rural Affairs (D-8002-18-0097).5. Conclusion
 Aquaculture and Fisheries2022年1期
- Aquaculture and Fisheries的其它文章
- A review of gynogenesis manipulation in aquatic animals
- Tilapia Lake Virus (TiLV) disease: Current status of understanding
- Classification and morphology of circulating haemocytes in the razor clam Sinonovacula constricta
- Potential probiotic and health fostering effect of host gut-derived Enterococcus faecalis on freshwater prawn, Macrobrachium rosenbergii
- Utility of gillnets for selectively targeting penaeids off Iran
- Refining tickler chains for penaeid trawls