
Influences of salt and koji contents on chemical properties of fish sauce from tilapia frames
2022-02-18 09:39BootsrinAuttnkPiynnChomnwngKnnikHuisnKewtSootsuwnChnnrongChomnwng
Aquaculture and Fisheries 2022年1期
Bootsrin Auttnk, Piynn Chomnwng, Knnik Huisn, Kewt Sootsuwn,Chnnrong Chomnwng,*
a Department of Food Technology, Faculty of Agricultural Technology, Kalasin University, Kalasin, 46000, Thailand
b Department of Biotechnology, Faculty of Agricultural Technology, Kalasin University, Kalasin, 46000, Thailand
Keywords:Fish sauce Tilapia frames Fermentation Koji
ABSTRACT Influences of salt (5%–20% w/w of digested material) and soybean koji (3%–10% w/w of digested material) on chemical properties of fish sauce from tilapia frame after 4 months’ fermentation using response surface methodology was studied. Results found that the salt content showed quadratic effect on ammonia nitrogen and amino nitrogen while linear effect on formaldehyde nitrogen and NaCl contents of samples were observed (P <0.05). Estimation response surfaces revealed that the formaldehyde nitrogen, ammonia nitrogen and amino nitrogen contents decreased while NaCl content increased as salt content increased. For the effect of koji, the significant effect of koji content on non-enzymatic browning value of fish sauce samples in linear manner was observed (P <0.05). The non-enzymatic browning value of sample increased as koji content increased. The both of salt and koji contents showed the linear effect on total acidity value while two-factor interaction terms on total nitrogen of sample was found (P < 0.05). For the consumer acceptability testing, an acceptance score of the incubated fish sauce sample with a values of 6.50–7.43 (like slightly to like moderately) was obtained. The results showed that it is possible to make a good quality fish sauce from tilapia frame by-product.
1. Introduction
Fish sauce is a clear brown liquid and salting taste. It is an important fermentation product widely consumed as condiment and seasoning for cooking (Xu et al., 2008). Fish sauce contains all essential amino acid and many vitamins and minerals (Jiang et al., 2007). Traditional fish sauce is produced by fermenting fish mixed with salt at the ratio of fish to salt of 2:1 or 3:1 and fermenting at the temperature range of 35–40◦C up to 12–18 months or longer to complete (Klomklao et al., 2006;Lopetcharat & Park, 2002; Tsai et al., 2006). The traditional fermentation process is normally continued for a long time and using the high salt concentration. However, some works have been done on fast fermentation process for fish sauce production by using many fermentation techniques such as increasing the fermenting temperature (Hariono et al., 2005), lowering salt concentration (Klomklao et al., 2006; Yu et al., 2014), using fish viscera or intestines (Gildberg, 2001; Klomklao et al., 2006), adding the commercial proteolytic enzymes (Chaveesuk,1991), using plant proteinases (Hariono et al., 2005), using bacteria starter culture (Yongsawatdigul et al., 2007) or even using soybean koji(Hariono et al., 2005; Xu et al., 2008). In addition, the raw material digestion process before fermentation is one of many techniques that could be used.
In Thailand, tilapia aquaculture production continuously increases with the yield of 200,764 MT in 2016 (Fishery development policy &strategy division, 2018). Tilapia frozen fillet is one of the important products, generating large amounts of fish frames by-product. Usually,major utilization is used in fishmeal, animal feed and organic fertilizer productions in spite of its high protein content. Chomnawang and Yongsawatdigul (2013) reported that protein content of tilapia frames by-product was about 40% dry basis. To convert the fish frames by-product into higher value products form; especially fermented fish products are required.
However, there has no report on the utilization of tilapia frames byproduct as raw materials as well as fast fermentation techniques for the production of fish sauce. Tilapia viscera are generally considered as a waste from tilapia processing, can be used as a source of various proteinase (Bezerra et al., 2005; Khalil, 2012; Mendes et al., 2009).Therefore, to accelerate the fermentation process, raw material digestion using crude proteinases from tilapia viscera before fermentation could be used. In addition, soybean koji was used to accelerate the fermentation process as well as enhance the aroma and nutrition of product. The purpose of this study is to investigate the effect of salt (5%–20% w/w of digested material) and soybean koji (3%–10% w/w of digested material) contents on chemical properties of fish sauce from tilapia frame for 4 months’ fermentation using response surface methodology. It was hope to obtain a fish sauce product from tilapia frame that its quality is able to meet the standard as set by the Thai local fish sauce standard.
2. Materials and methods
2.1. Soybean koji preparation
Dried soybean and wheat flour were purchased local market in Kalasin province, Thailand.Aspergillus oryzaeculture was purchased from the Thai institute of scientific and technological research; TISTR Culture Collection, Pathum Thani province, Thailand. Soybean koji preparation as described by Hariono et al. (2005) with a slight modification. The soybean was washed and soaked in tap water and kept overnight. The soybean was steamed for 30 min. At the same time, the wheat flour was roasted at 150◦C for 1 h. After cooling, the cooked beans and roasted wheat were mixed in the ratio of 1:1 (w/w) and inoculated withAspergillus oryzaeseed culture, added in the ratio of 1:16,000. The mixture was placed in stainless steel trays covered with a wet double sheet cloth (Rewetting of cloth should be done frequently as the cloth would dry up) and incubated for 3 days in a cleaned room at ambient temperature (28–35◦C) or until the surface of koji would be covered by mycelium.
2.2. Crude proteinases from tilapia viscera preparation
Tilapia viscera were purchased from local market in Kalasin province, Thailand. For crude proteinases preparation, the viscera were washed and ground using a blender (Philips, 2115, Japan) for 1 min with a fish viscera: cold distilled water the ratio of 1:1 (w/w). The ground sample was filtered using double sheet cloth. The filtered liquid obtained was used as crude proteinases.
2.3. Preparation of digested tilapia frame
Tilapia frame (head, frame and fin) were purchased from local market in Kalasin province, Thailand. The frames were cut into the pieces about 1.5 cm2, then soaked in cold water and kept at 4◦C overnight to removed fish slime, blood and fat. The pieces’ frames were washed and ground using a grinding machine (Atech Instrument; Khon Kaen, Thailand). The ground sample was mixed with distilled water at the ratio of 1:0.3 (w/w) and then 10% of crude proteinases from tilapia viscera were added. The mixtures were transferred to glass bottles and covered with polyethylene film. The containers were incubated by placed at room temperature (31–35◦C) for 12 h. The digested tilapia frame was used as raw material for fish sauce production.
2.4. Laboratory fish sauce production
To study the effect of salt and soybean koji contents on biochemical properties of fish sauce from tilapia frame. Fish sauce was prepared using response surface methodology. The digested tilapia frames were mixed with different levels of salt (5%–20% w/w of digested material)and soybean koji (3%–10% w/w of digested material), the composition of materials for fish sauce preparation is shown in Table 1. The mixtures were transferred to glass bottles (5 L volume) and covered with a plastic lid. The mixture was allowed to ferment at room temperature (27–36◦C)for 4 months. During fermentation, the mixture needed to be stirred daily for the first five days to dissolve the salt and subsequently, onceevery three days. At the end of fermentation, the whole fermentation mixture was filtered with cheesecloth and the liquid was collected and then filtered with Whatman filter paper No. 5. The fish sauce obtained was used for analysis.
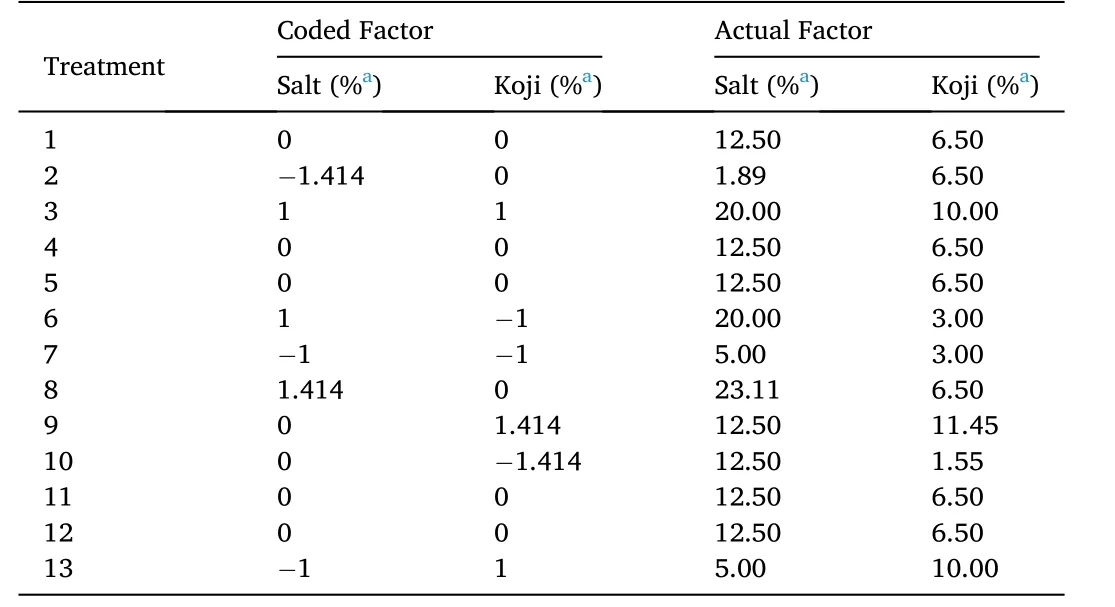
Table 1 Coded and actual levels of factors generated by central composite design for fish sauce from tilapia frame preparation.
2.5. Determination of chemical properties of fish sauce from tilapia frame
2.5.1. Measurements of total acidity and total nitrogen
Total acidity was measured according to the method of Xu et al.(2008) with a slight modification. The sample (1 mL) was mixed with distilled water (9 mL) followed by titration with 0.01 N NaOH to an endpoint of pH 9.2. Total acidity was determined based on the lactic acid content. Measurements were determined in triplicate.
Total nitrogen content of fish sauce samples was measured using Kjeldahl method (AOAC, 2000). Total nitrogen content was expressed as g/L.
2.5.2. Determination of formaldehyde nitrogen, ammonia nitrogen and amino nitrogen
Formaldehyde nitrogen, ammonia nitrogen and amino nitrogen contents were determined as described by Klomklao et al. (2006). To determine formaldehyde nitrogen content, 1 mL of sample was mixed with 9 mL of distilled water and titrated to pH 7.0 with 0.1 N NaOH. To neutralize the samples, 10 mL of formaldehyde solution (38% v/v, pH 9.0) was added. Titration was continued to pH 9.0 with 0.1 N NaOH.Formaldehyde nitrogen content (g/L) was calculated as: ml of NaOH (pH 7—9) ×0.1 ×14.
For ammonia nitrogen determination, Kjeldahl flask containing 100 mL of distilled water and 3 g of MgO was added with 50 mL of 10-fold diluted samples. The mixture was distilled to release volatile nitrogen into 50 mL of 4% boric acid containing methyl red bromocresol green.The distillate was titrated with 0.05 M H2SO4until the end-point was obtained. Ammonia nitrogen content (g/L) was calculated as: 5.6 ×0.05 ×Y where Y is the volume of H2SO4(mL).
Amino nitrogen content was calculated using the following formula:Amino nitrogen content (g/L) = Formaldehyde nitrogen content -Ammonia nitrogen content.
2.5.3. Determination of NaCl content
The salt content (NaCl) was determined according to the method of AOAC (2000). Samples (5 mL) were diluted with 45 mL of distilled water. Diluted sample (1 mL) was mixed with 10 mL of 0.1 N AgNO3and 10 mL of conc. HNO3. The mixture was boiled on a hot plate until all samples except AgCl2were dissolved. The mixture was cooled using running water. Then 50 mL of distilled water and 5 mL of ferric alum indicator were added. The mixture was titrated with 0.1 N KSCN until the solution became permanent light brown. The percentage of salt was calculated.
2.5.4. Evaluation of browning color
Non-enzymatic browning of sample was determined according to the method of Klomklao et al. (2006). Five ml of sample were mixed with 50 mL of 50% (v/v) ethanol and the mixture was stirred for 1 h at 25◦C. The sample was centrifuged for 30 min at 7700×gusing an Avanti ® J-E centrifuge (Beckman Coulter, Inc, CA, USA). The absorbance of supernatant obtained was measured at 420 nm using a spectrophotometer(UV-1800, Shimadzu, Kyoto, Japan).A420was used as an index for browning intensity. The measurements were obtained from the average of 5 readings for each sample.
2.5.5. Acceptability testing
After fermentation, a treatment, which is selected from the consideration of chemical properties according to the Thai local fish sauce standard, was incubated by placing the container outside the building(outdoors at temperatures between 35 and 50◦C) for a period of 28 days.The incubated sample was heated to boiling point, maintained for 10 min. After cooled down, a sample was used for acceptability test. A fish sauce sample was evaluated by an untrained 20-member panel, who had sensorial acquaintance with fish sauce. Panelists were asked to give acceptance scores for five attributes: appearance, color, aroma, taste and overall acceptance using the nine-point hedonic scale (a score of 1 represented extreme dislike, 5 represented neither like nor dislike and 9 represented like extremely).
2.6. Statistical analysis
Response surface methodology (RSM) was employed to study the effect of salt and koji contents on chemical properties of fish sauce from tilapia frame. Fish sauce from tilapia frame were prepared according to a central composite design (CCD), consisting of 22factorial design with two levels (−1, +1), five central points (0) and two levels of axial points(-α, +α). The coded values of the independent variables (−1.414, −1, 0,1, 1.414) were calculated according to a rotatable design (Gacula &Singh, 1984). Data were analyzed by response surface regression to fit the following second-order polynomial to all dependent Y variables.Assessment of error was derived from replication of the central point treatment conditions. The level of significance was defined atP<0.05.The experimental design adopted 2 independent variables being the salt and koji contents. The treatments in this design were set using a statistical program (Design-expert Version 7.0.0; Stat-Ease, Inc. Mineapolis,MN), resulting in 13 treatments as shown in Table 1. The dependent variables (responses) were: total acidity content, total nitrogen content,formaldehyde nitrogen content, ammonia nitrogen content, amino nitrogen content, NaCl content and non-enzymatic browning value of fish sauce from tilapia frame. All data presented were mean values of three determinations. Three-dimensional response surface plots were generated using a statistical program (Design-expert Version 7.0.0).
3. Results and discussions
To find the effect of salt and koji contents, all chemical properties of fish sauce from tilapia frame after 4 months’ fermentation obtained by RSM over a range of salt content (5%–20% w/w of digested material)and soybean koji content (3%–10% w/w of digested material) were collected.
3.1. Total acidity
The correlations of salt and koji contents on total acidity of fish sauce from tilapia frame are shown in Table 2. The results found that the both of salt and koji contents showed the linear effect on total acidity (TA)value (P<0.05). The regression coefficient of salt and koji contents on TA of fish sauce samples is showed in Table 3. The mathematical model in terms of coded factors was developed as follows:
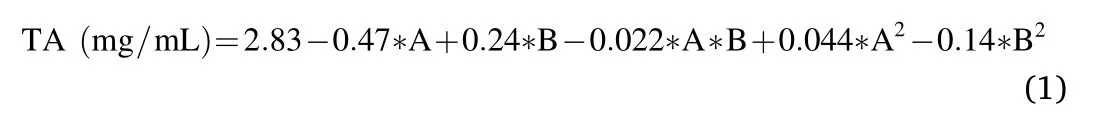

Table 2 Analysis of variance of the effect of salt and koji contents on response parameters of fish sauce from tilapia frame.
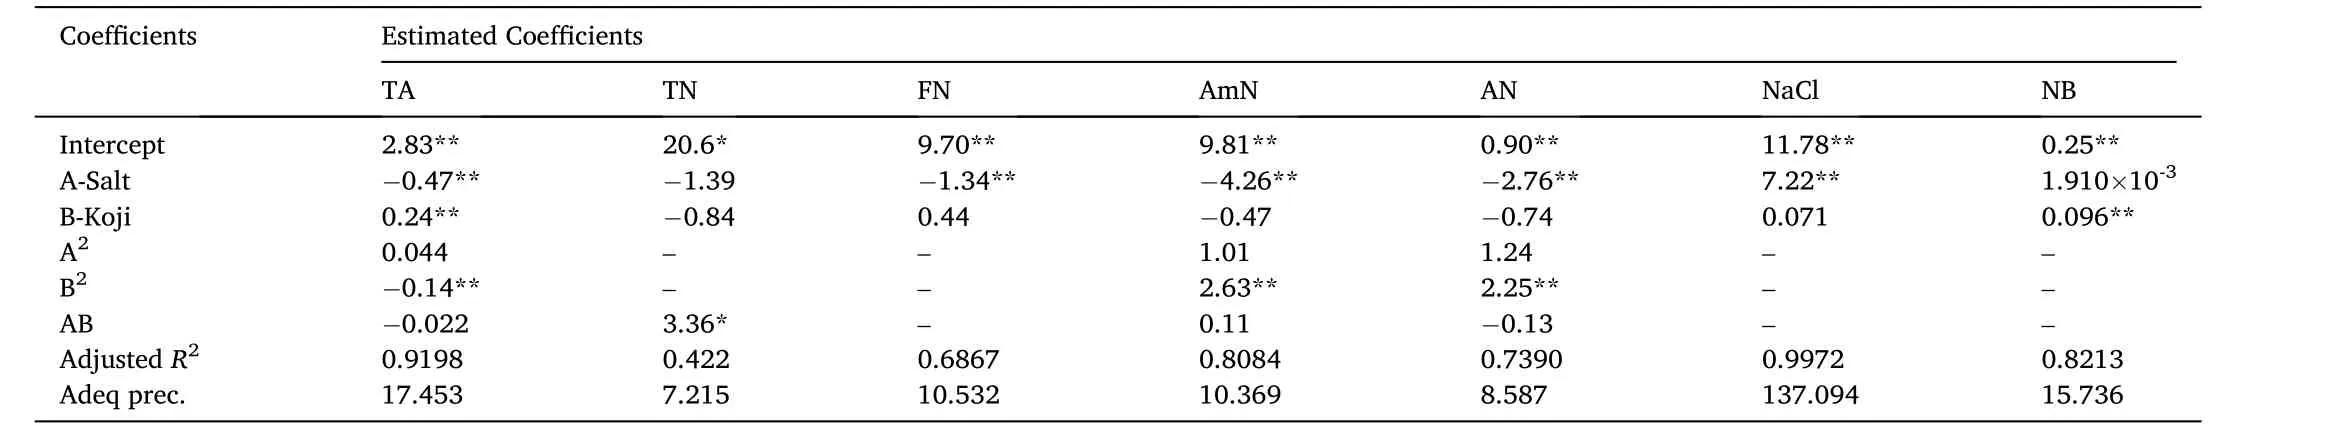
Table 3 Regression coefficient of the effect of salt and koji contents on response parameters of fish sauce from tilapia frame.
where: A is salt content and B is koji content.
The predictive model of TA content showed a non-significant lack of fit (Table 2), indicating that the model was adequate for prediction. The response surface stereogram was plotted for TA content of fish sauce samples is shown in Fig. 1. From the results, Salt and koji concentrations showed the negative and positive effects, respectively on TA content of fish sauce sample. An increasing of salt and koji contents influenced on decreased and increased in TA content of samples, respectively. Lactic acid bacteria (LAB) are found as microorganisms in fermented fish products. The role of LAB is to ferment the available carbohydrates and thereby cause a increase in organic acid, mainly lactic acid (Paludan-Mu¨Oller et al., 2002). The TA content of samples increased as koji content increased, it was probably due to soybean koji is a source of carbohydrates as well as a variety of enzymes which catalyse the degradation of raw materials to fermentable substrates for microorganisms in the fermentation stage (Hariono et al., 2005). While, the salt concentration in different types of fermented fish is a pronounced influence on the growth of microbial and the fermentation rate. An increasing of salt concentration inhibited LAB growth and the fermentation process (Chaveesuk, 1991; Paludan-Mu¨Oller et al., 2002).
3.2. Formaldehyde nitrogen, ammonia nitrogen and amino nitrogen contents
The formaldehyde nitrogen (FN) and ammonia nitrogen (AmN)contents are used as an index of the degree of protein hydrolysis and the breakdown of soluble protein and peptides into free amino acids and volatile nitrogen, respectively. Whereas, the amino nitrogen (AN) content represent the amount of primary amino groups in fermented fish products, especially for fish sauce (Chaveesuk et al., 1993; Klomklao et al., 2006; Jiang et al., 2007). The correlations of salt and koji contents on FN, AmN and AN contents of fish sauce samples are shown in Table 2.The results found that the salt content showed the quadratic effect on AmN and AN contents while the linear effect on FN content of samples were observed (P< 0.05). On regression analysis, the regression coefficients of salt and koji contents on FN, AmN and AN contents of fish sauce samples are showed in Table 3. The mathematical models in terms of coded factors were developed as follows:
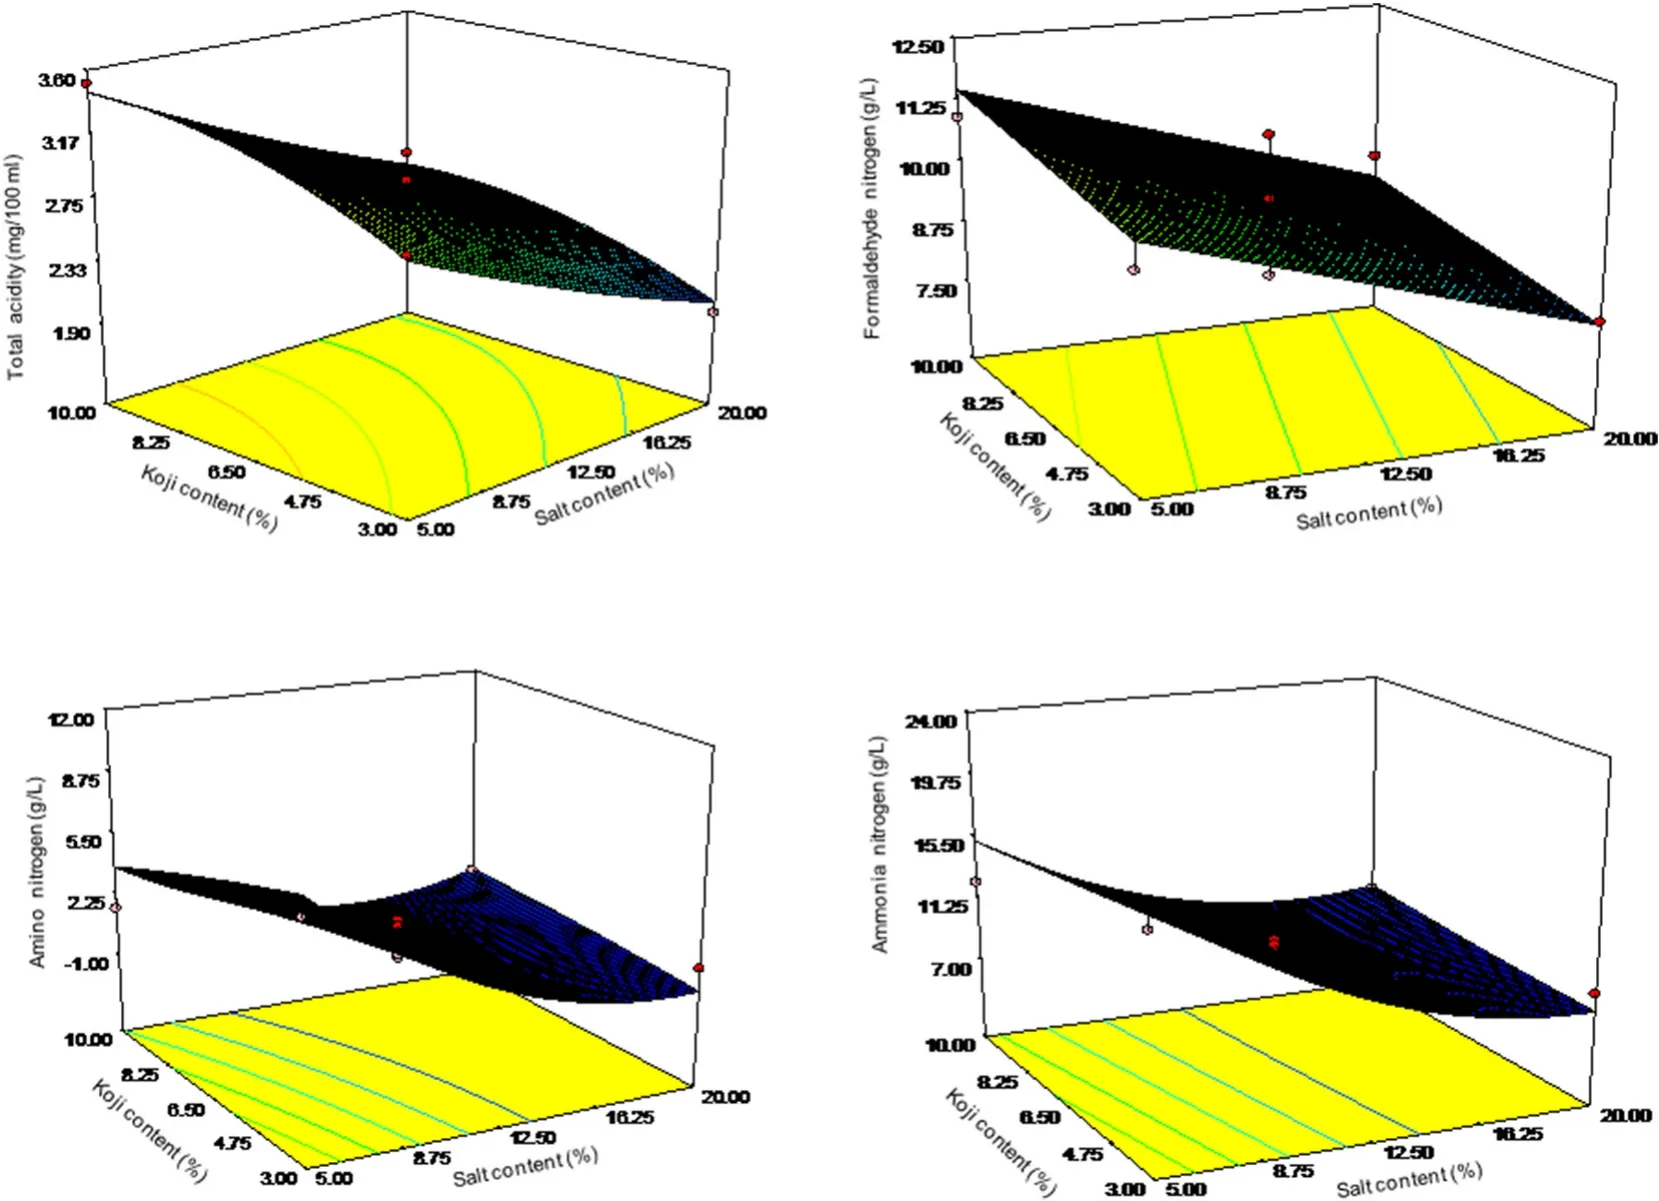
Fig. 1. Response surface plot for total acidity, formaldehyde nitrogen, ammonia nitrogen and amino nitrogen of fish sauce with a different salt and koji contents; %are expressed as % w/w of digested raw material.
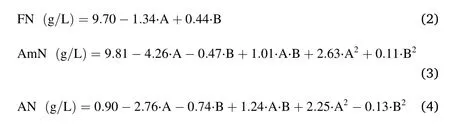
where: A is salt content and B is koji content.
The salt concentration showed the negative quadratic effects on AmN and AN contents, while the negative linear effect on FN content in the fish sauce samples. From Fig. 1, the FA, AmN and AN contents decreased as salt content increased. At high salt concentration, the decrease in FA, AmN and AN contents of samples was due to the salt could inhibited the hydrolysis of proteins or the growth of microorganism (Chaveesuk, 1991; Klomklao et al., 2006; Lopetcharat et al.,2001; Paludan-Mu¨Oller et al., 2002). In addition, the faint odor of samples with low salt content (1.89 and 5% w/w of digested materials)was detected. Klomklao et al. (2006) reported that the formation of ammonia or volatile compounds caused by spoilage microorganism might take place at low salt concentration. Even though, no significant of Koji content on FN content in the sample was obtained, higher content of koji trend to increase in FN content in the samples were found (Fig. 1).Xu et al. (2008) suggested that an increase in FN content during fermentation caused by protein hydrolysis by the endogenous and koji proteinases.
3.3. Non-enzymatic browning
The correlations of salt and koji contents on non-enzymatic browning value of fish sauce samples are shown in Table 2. The significant effect of koji content on non-enzymatic browning values of fish sauce samples in linear manner was observed (P< 0.05). However, no significant effect of salt content on non-enzymatic browning were found (P> 0.05). The regression coefficients of salt and koji contents on nonenzymatic browning of fish sauce samples are shown in Table 3. The mathematical models in terms of coded factors were developed as follows:

where A is salt content and B is koji content.
The predictive model of non-enzymatic browning showed a significant lack of fit, indicating that the model was not adequate for prediction (Table 2). The estimated response surface was plotted for nonenzymatic browning of fish sauce samples is shown in Fig. 2. The positive linear effect of koji content on non-enzymatic browning value of fish sauce sample was obtained. The browning value (A420) increased as the koji content increased was obtained. The increase in absorbance at 420 nm was used as an indicator for brown color development, caused by melanoidin produced by the Maillard reaction (Ajandou et al., 2001;Jiang et al., 2007; Klomklao et al., 2006). The high absorbance at 420 nm of samples with higher koji content were detected, it was probably due to the carbohydrate and protein derivatives from soybean koji degradation, can act as reactants, to initiate the Maillard reaction.Therefore, the addition of koji affected the brown colour development in fish sauce.
3.4. NaCl and total nitrogen contents
The correlations of salt and koji contents on NaCl and total nitrogen(TN) contents of fish sauce samples are shown in Table 2. The results found that the salt content showed the linear effect on NaCl content.While the interaction terms of salt and koji contents showed the twofactor interaction versus linear effect on TN content of samples (P<0.05). The regression coefficients of salt and koji contents on NaCl and TN contents of fish sauce samples are showed in Table 3. The mathematical models in terms of coded factors were developed as follows:
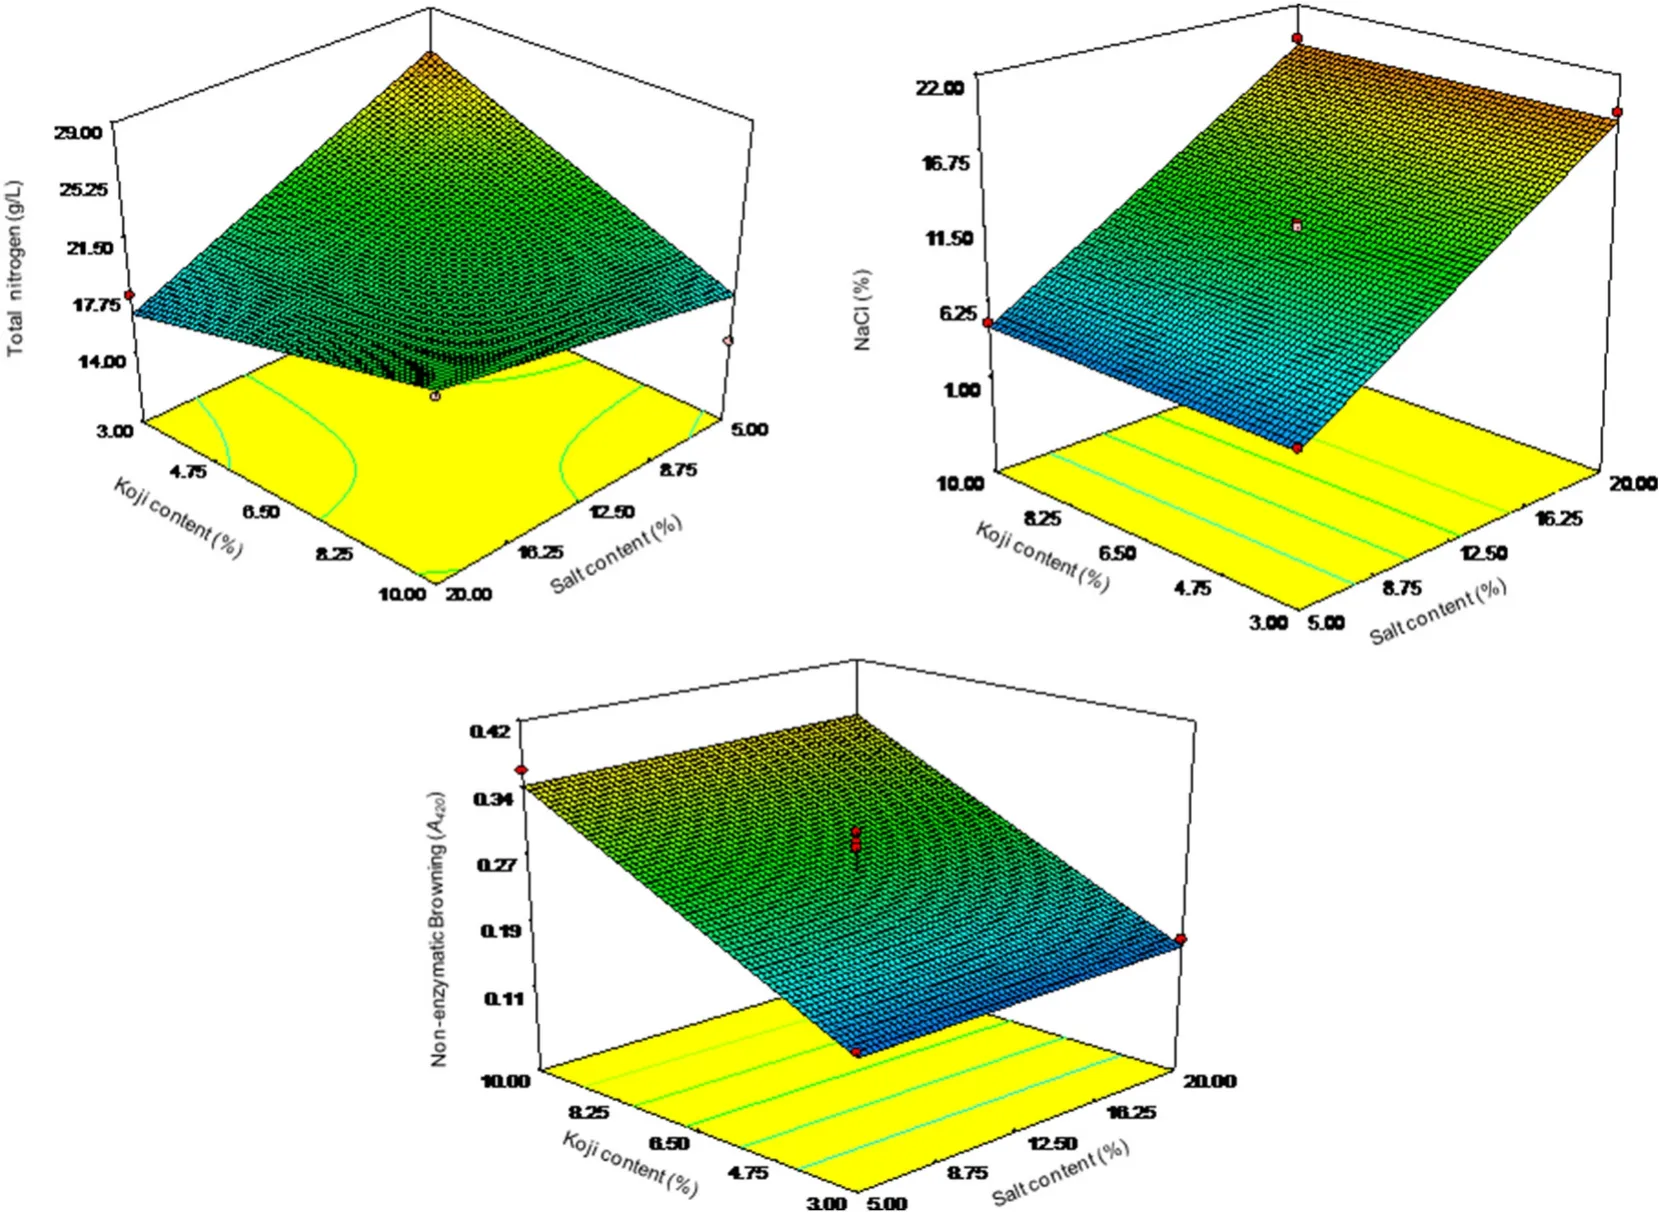
Fig. 2. Response surface plot for total nitrogen, NaCl and non-enzymatic browning of fish sauce with different salt and koji contents; % are expressed as % w/w of digested raw material.
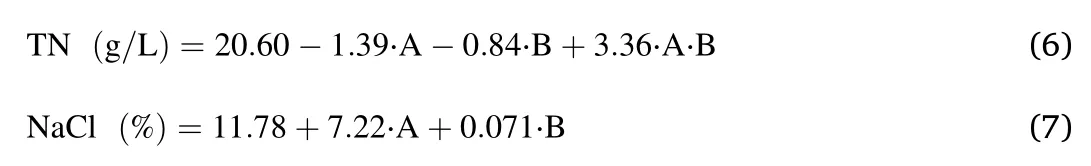
where: A is salt content and B is koji content.
The predictive models of NaCl content showed a non-significant lack of fit, indicating that the model was adequate for prediction. Whereas,the significant lack of fit test of TN predictive model was observed,indicating that the models were not adequate for prediction (Table 2).The response surfaces stereograms were plotted for NaCl and TN contents of fish sauce samples are shown in Fig. 2. Salt concentration showed the positive linear effect on the NaCl content in the fish sauce samples. NaCl concentration increased as the salt content adding increased, but slightly lower than the Thai community product standard for fish sauce (NaCl content is set not less than 200 g/L). For TN content of samples, the interaction of salt and koji showed the negative linear effect on TN content of samples. TN content of samples increased as the salt and koji contents decreased (Fig. 2). This observation could be the combined effects of the salt concentration on proteolytic enzymes activity and a dilution effect. The TN content is one of an important factor,used to classify a quality in fish sauce (Lopetcharat et al., 2001; Xu et al.,2008); it is mainly from protein nitrogen and non-protein nitrogen(Shahidi et al., 1994; Klomklao et al., 2006; Jiang et al., 2007). High quality of fish sauce must have a TN content not less than 9.0 and 4.0 g/L(based on the Kjedahl method) for the naturally processed and blended type of fish sauce, respectively (Thai industrial stand Thai industrial standards institute, 2014). In a previous study (Chomnawang et al.,2014); an experiment observed that the TN content in fish sauces from tilapia frame for 6 months’ fermentation (without the digestion of tilapia frames before fermentation) were 4.0–5.6 g/L. For this experiment, the results showed TN content in fish sauce samples with the values of 17.93–24.66 g/L, higher than 9.0 g/L were obtained from all treatments.In addition, more than 80% of FA, AmN and AN contents as well as about 55% of TN content were detected in all samples before fermentation(data not shown), compared with an amounts at the end of fermentation.These observations indicating that the digestion of tilapia frame procedure before the fermentation were showed to accelerate the fish sauce production with a TN content exceeded the minimum value for fish sauce set by the Thai industrial stand institute. According to the Thai community product standard for fish sauce, the amino nitrogen content must be 40%–60% of total nitrogen (Thai industrial stand Thai industrial standards institute, 2014). From the results, a treatment prepared by adding 20% w/w of salt and 3% w/w of koji obtained the highest amino nitrogen content with a value of 51.4% of the total nitrogen content. Therefore, this treatment was selected for incubation process and consumer acceptability test. After incubation for 28 days, a fish sauce sample was evaluated by an untrained 20-member panel. The scores for appearance, color, aroma, taste and overall acceptance of fish sauce sample were 7.17 ±1.17, 7.10 ±1.27, 6.50 ±1.33, 7.27 ±1.31,7.37 ± 1.16 and 0.43 ± 1.17, respectively, represented like slightly to like moderately. The results showed that it is possible to make a good quality fish sauce from tilapia frame by-product.
4. Conclusion
Response surface methodology was used to investigate the effect of salt and koji contents on physiochemical properties of fish sauce form tilapia frame. The results of this research indicated that the salt and koji contents influenced on physiochemical properties of fish sauce. The addition of koji affected the brown colour development in fish sauce. It is possible to make a good quality fish sauce from tilapia frame by-product.The digestion of tilapia frame procedure before fermentation could be used for accelerates fermentation of fish sauces along with their high TN content. The acceptance score of the selected fish sauce sample was between like slightly to like moderately. According to a TN content, the quality of fish sauce was able to meet the Thai community product standard for fish sauce.
CRediT authorship contribution statement
Bootsarin Auttanak: Conceptualization, Methodology, Investigation. Piyanan Chomnawang: Validation, Visualization. Kannika Huaisan: Methodology, Software, Investigation. Kaewta Sootsuwan:Visualization, Writing - review & editing. Channarong Chomnawang:Conceptualization, Methodology, Formal analysis, Investigation,Writing - original draft, Writing - review & editing, Visualization.
Declaration of competing interest
All the Authors declare no conflict of interest.
Acknowledgements
The authors gratefully acknowledged a partially support of raw materials and chemical reagents from Kalasin University under the research project “Development of fermented fish from tilapia frame” and“Effect of fermentation conditions on fish sauce quality produced from tilapia frame by-product”.
 Aquaculture and Fisheries2022年1期
- Aquaculture and Fisheries的其它文章
- A review of gynogenesis manipulation in aquatic animals
- Tilapia Lake Virus (TiLV) disease: Current status of understanding
- Classification and morphology of circulating haemocytes in the razor clam Sinonovacula constricta
- Potential probiotic and health fostering effect of host gut-derived Enterococcus faecalis on freshwater prawn, Macrobrachium rosenbergii
- Utility of gillnets for selectively targeting penaeids off Iran
- Refining tickler chains for penaeid trawls