
Different metabolomic responses of grass carp (Ctenopharyngodon idellus) to dietary tannin and rapeseed meal
2022-02-18 09:39JingtingYaoNingLiuNingyuLiXiangLiXuemingHua
Aquaculture and Fisheries 2022年1期
Jingting Yao, Ning Liu, Ningyu Li, Xiang Li, Xueming Hua,*
a Centre for Research on Environmental Ecology and Fish Nutrition (CREEFN) of the Ministry of Agriculture, Shanghai Ocean University, Shanghai, 201306, China
b Key Laboratory of Freshwater Aquatic Genetic Resources, Ministry of Agriculture, Shanghai, 201306, China
c National Demonstration Center for Experimental Fisheries Science Education, Shanghai Ocean University, Shanghai, 201306, China
d College of Food Science & Technology, Shanghai Ocean University, Shanghai, 201306, China
Keywords:Ctenopharyngodon idellus Hydrolysable tannin Rapeseed meal Metabolite Metabolic pathway
ABSTRACT In order to study the metabolomic responses of rapeseed meal on grass carp and the role that tannin plays in those responses, grass carp were fed four diets for an eight week trial. Two were practical diets: FM diet contained 10% fishmeal without rapeseed meal, RM diet contained 50% rapeseed meal without fishmeal; the other two were semi-purified diets without (T0) or with 1.25% (T1) of supplemental hydrolysable tannin. The tannin content in the RM diet was close to that of T1. The rate of weight gain for RM was significantly lower than FM,while the feed conversion ratio in the T1 was significantly higher than T0. The muscle lipid and protein content was significantly lower and glycogen higher in the RM and T1 compared to the other treatments. The percent of muscle-saturated fatty acid (SFA) in the RM and T1 groups was significantly lower than FM and T0 groups,respectively, while the mono-unsaturated fatty acid (MUFA) in the RM group was significantly higher than FM.The hepatic activities of alanine aminotransferase and aspartate aminotransferase were lower and the hepatic glycogen and malonaldehyde were higher in the T1 and RM than the other treatments. The total serum protein,globulin, and triglycerides were significantly higher in T1 and RM; the alanine aminotransferase in the T1 was significantly higher than T0; and the aspartate aminotransferase in the RM and T0 groups were significantly higher than the other treatments. In a metabolomic assay, 29 differential metabolites were identified between T0 and T1, 23 metabolites were downregulated, and 6 metabolites were upregulated in T1 compared to T0. Ninetytwo differential metabolites were identified between FM and RM, 31 metabolites were downregulated, and 61 metabolites were upregulated in RM compared to FM. These indicated that lipid utilization and carbohydrate metabolism might be improved, while the protein metabolism was suppressed by rapeseed meal. The abnormal protein and lipid metabolism may be partly caused by tannin in the rapeseed meal, as the tannin contained within the rapeseed meal seemed to bring different effects that the tannin additive.
1. Introduction
Rapeseed meal is a great substitute for dietary fishmeal in some fish species (Cheng Z, Ai Q, Mai K & Xu W, 2010; Yigit N O & Olmez M,2009), but poor growth performance, low digestive ability, and inflammatory reactions have been observed when rapeseed meal was supplied in excess (Ngo D T, Pirozzi I & Glencross B, 2015; Bu X, Wang Y,Chen, F Y, Tang B et al., 2017). Japanese seabass (Lateolabrax japonicus)could tolerate a diet of 17.2% rapeseed meal without influencing the growth performance, but a higher rapeseed level had a negative influence on immunity and the apparent digestibility coefficients of dry matter, protein, lipids, and phosphorus (Cheng Z, Ai Q, Mai K & Xu W,2010). Ussuri catfish (Pseudobagrus ussuriensis) could similarly tolerate a diet of 17% rapeseed meal before experiencing a decrease the apparent digestibility coefficients of dry matter, crude protein, and crude lipids,while also negatively affecting antioxidation (Bu X, Wang Y, Chen, F Y,Tang B et al., 2017). The unbalanced nutritional profile, high fiber level,and antinutrients of the rapeseed meal could be responsible for these adverse reactions (Ngo D T, Pirozzi I & Glencross B, 2015; Sajjadi M,2015).
Tannins are polyphenolic substances with various chemical structures that are generally divided into hydrolysable and condensed tannins (Chung K T, Wei C I & Johnson M G, 1998). Tannins are important antinutrients in rapeseed meal and exist mainly in the husk of rapeseed (Wu M & Zhang Y, 1998). Rapeseed meal includes 1.2–3.7%total tannins and the content of hydrolysable tannin was higher than condensed tannin (Fenwick G R, Pearson A W, Greenwood N M & Butler J E, 1981; Wu M & Zhang Y, 1998; Xiao Z, Wu M & Shen D, 2008).Hydrolysable tannin influence nutrition metabolism and some biological activities (e.g. anticancer and antioxidant properties), but these effects were closely related to dosage and species (Francis G, Makkar H P S & Becker K, 2001; Romani A, Ieri F, Turchetti B, Mulinacci N, Vincieri F F & Buzzini P, 2006). In a study of pigs, a linear decrease in feed conversion ratio and daily body weight gain were observed with increasing dietary hydrolysable tannin levels (Lee S H, Shinde P L & Choi J Y, 2010). However, 5.0 g/kg of dietary hydrolysable tannin benefited the intestinal health of chickens by controlling necrotic enteritis (Tosi G,Massi P, Antongiovanni M, Buccioni A, Minieri S, Marenchino L & Mele M, 2013). Studies of hydrolysable tannin are mainly focused on mammals, such as ruminants, rodents, and poultry (Barszcz M, Taciak M &TuÅnio A, 2018; Diana B ˇS, Kubale V, Martin ˇS, Marjeta ˇC P, Maja P P,Gregor F & Dejan ˇS, 2016) with limited studies on aquatic species. In a study of European seabass (Dicentrarchus labraxL), a diet containing 3%tannins reduced the growth and feed intake (Omnes M H, Goasduff L G J,Delliou L H, Bayon Le N, Quazuguel P & Robin J H, 2017). A diet of 2%hydrolysable tannin did not affect the growth of Indian major carp(Labeo rohita), but the total protein, albumin, and globulin content all decreased (Ashisa K P, Sahu P N, Pal K A, Reddy K A & Shivendra K,2007). The effect on aquatic species caused by tannin additives may be different from the natural tannins in rapeseed meal, and to our knowledge, this has not been investigated via a metabolomics approach.
In recent years, metabolomics has been applied in aquaculture nutrition research to evaluate nutrition requirements and the effect of dietary nutrients on aquatic species by comparing the metabolite profiles from different dietary treatments (Ma Q Q, Chen Q, Shen Z H, Li D L,Han T, Qin J G, Chen L Q & Du Z Y, 2017; Wei Y, Liang M, Mai K, Zheng K & Xu H, 2017). Liquid chromatography coupled to mass spectrometry(LC-MS) and gas chromatography coupled to mass spectrometry(GC-MS) methods are more sensitive than nuclear magnetic resonance(NMR). GC-MS is more sensitive to amino acids and fatty acids, while LC-MS is more sensitive to phospholipids (Putri S P, Yamamoto S, Tsugawa H & Fukusaki E, 2013; Zeng Y X, Svein A M, Araujo P, Grung B,Midtbø L K, Du ZY, 2016). In aquatic animals, serum, liver, and muscle tissue are widely used to detect the metabolites (Ma Q Q, Chen Q, Shen Z H, Li D L, Han T, Qin J G, Chen L Q & Du Z Y, 2017; Rani A, Ali A M, Jan E L & Torbj¨orn L, 2014). Among these organs, the hepatopancreas or liver is the most metabolically active organ, involved in the metabolism of absorbed nutrients, the export of substrates, and biosynthesis of essential macromolecules (Bystriansky J S, Frick N T & Ballantyne J S,2007; Tappaz M L, 2004).
The grass carp (Ctenopharyngodon idellus) is a typical herbivorous euryhaline fish and has a long aquaculture history in East Asia. Its growth, immunity, nutrition, and intestinal microbiota when dietary fishmeal was replaced by plant protein has been widely studied (Jiang J,Shi D, Zhou X Q, Feng L, Liu Y, Jiang W D, Wu P, Tang L, Wang Y & Zhao Y, 2016; Zhang D, Wu Z, Chen X, Wang H & Guo D, 2018). Numerous studies have suggested that the dietary rapeseed meal should be less than 35% in grass carp diets (Ma Q Q, Chen Q, Shen Z H, Li D L, Han T,Qin J G, Chen L Q & Du Z Y, 2017; Suya J, 2011; Tan Q, Liu Q, Chen X,Wang M & Wu Z, 2013).
In the present study, GC-MS was used to detect the metabolites in the hepatopancreas and coupled with growth performance, muscle tissue composition, hepatopancreas, and the biochemical serum parameters of grass carp to study the possible effects on metabolic mechanisms induced by tannin additives and a rapeseed meal diet, respectively. By comparing the effect of a single tannin additive and one induced by rapeseed meal, we can evaluate whether tannins limit the use of rapeseed meal and whether it is necessary to remove tannins by shelling the husk of rapeseed when rapeseed meal is applied to aquatic diets.
2. Materials and methods
2.1. Experimental fish and environmental conditions
The trial was conducted at the Shanghai Ocean University Coastal Aquaculture Base located in Binhai, Huinan Town, Pudong New District,Shanghai, China. Grass carp with an average weight of 8.18 ± 0.81g from Huzhou Nanxun Honghao Fisheries were used. Fish were randomly divided into 16 400L indoor cages with 20 fish per cage(0.7m*0.8m*0.8m; four replicates/group), which were made with soft plastic mesh. Fish were acclimated to commercial feed for a week. The cages were fixed in four cement pools (four cages/pool). The pools were still water systems, supplied with filtered pond freshwater, and kept aerated and exposed to the ambient natural photoperiod. Water was changed every five days and 1/3 of water was replaced by filtered pond water. Water quality was monitored daily and kept within the optimal range for grass carp: dissolved oxygen >5 mg/L, ammonium nitrogen<0.6 mg/L, and water temperature 24◦C–32◦C.
2.2. Diet and feeding
The feeding trial lasted for eight weeks and all fish were fed to apparent satiation three times a day (07:00, 12:00, and 17:00). Uneaten food was collected by siphoning 30 min after feeding, then dried and weighed to correct the feed intake. During the trial, the feed ration was adjusted everyday with changing appetite.
Four isonitrogenous (crude protein 30.6–31.2%) and isoenergetic(gross energy 16.8–17.6 MJ/kg) diets were formulated. Two were practical diets and the further two were semi-purified diets. Practical diets were labeled as fishmeal diet (FM) and rapeseed meal diet (RM).The FM diet contained 10% fishmeal without rapeseed meal and RM diet contained 50% rapeseed meal without fishmeal, with the FM diet regarded as the control group. Semi-purified diets were marked as T0(0% hydrolysable tannin) and T1 (1.25% hydrolysable tannin supplementation), with the T0 diet designated as the control group. Casein and gelatin were used as the main protein sources (Table 1). The amino acid contents of the diets are presented in Table 2. The approximate percentage of tannins in the RM diet was 1.31%, which was close to that ofthe T1 diet, and the approximate percentage of tannins in FM diet was 0.16%, which was close to the level of the T0 diet. All ingredients were ground into a fine powder through a 60-mesh sieve, weighed according to the formula, and thoroughly mixed with soybean oil. Then water was added and it was pelleted with an experimental feed mill and dried in a ventilated oven at 40◦C for about 12 h. Then the diets were broken and sieved into proper pellet size (1.5 mm in diameter), before storage in a cool, dry, well-ventilated place.
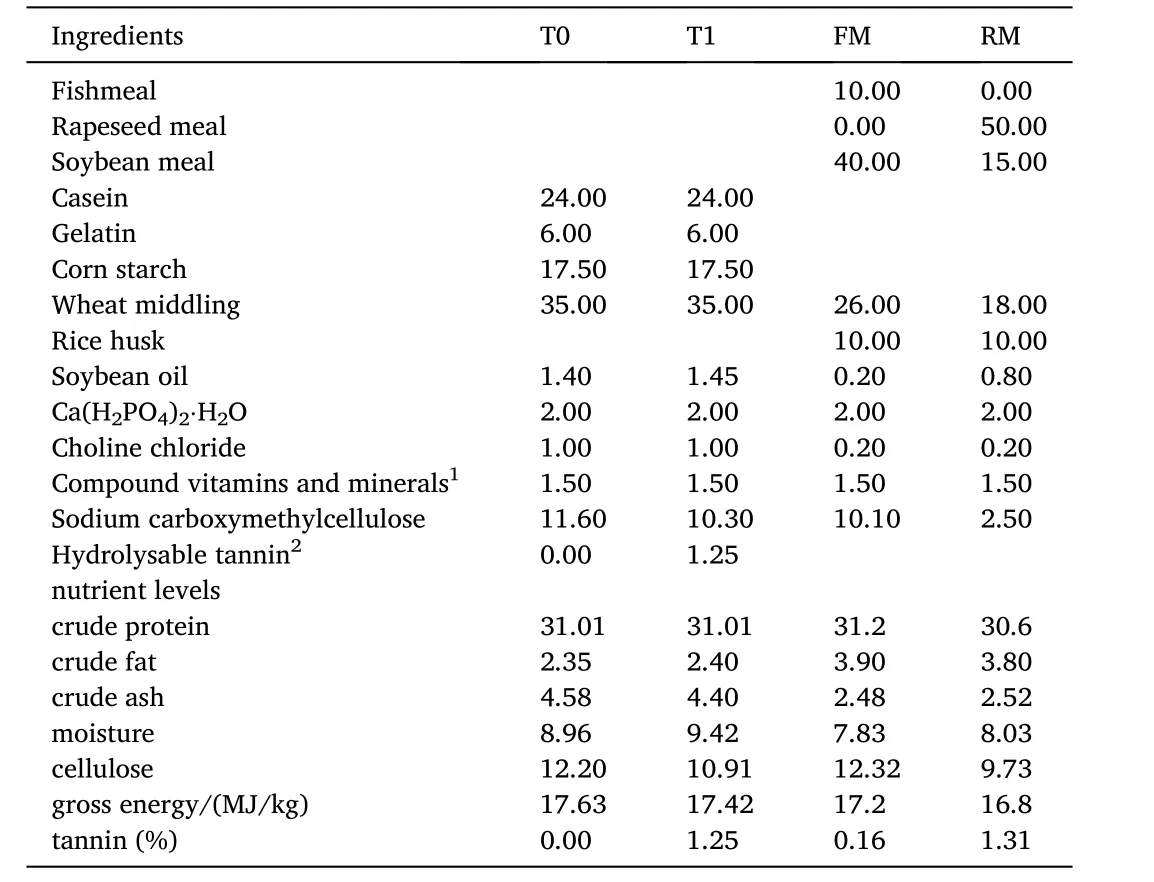
Table 1 Composition and nutrient level of diets (air dry basis) %. Compound vitamins and compound minerals were obtained from Hangzhou Haihuang Feed Development Co., Ltd. hydrolysable tannin were bought from Wuhan Baixing Bio-Technique Co. Ltd, effective substance content is 99%.
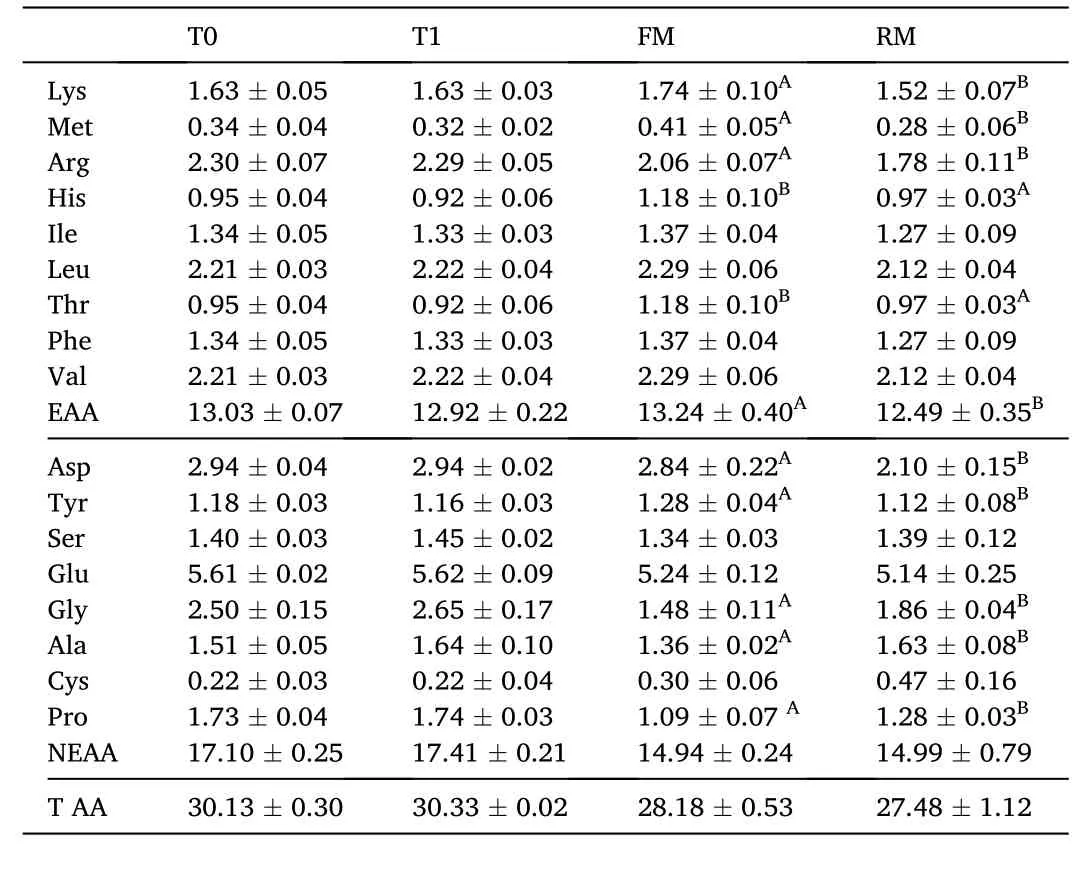
Table 2 Amino acid content in the diets (% dry matter) of grass carp (means ±SD, n =4).Different lower-case letters in the same row indicate significant differences between T0 and T1 (P <0.05) and different uppercase letters indicate significant differences between FM and RM (P <0.05); values with no letter mean no significant difference (P >0.05).
2.3. Sample collection
At the end of the eight-week feeding period, all fish from each cage were counted and weighed. Seven fish were randomly removed from each cage (28 fish/group), anesthetized with eugenol solution (100 ppm) and euthanized via a sharp blow to the cranium prior to dissection.After the body weight and body length were measured, blood samples were collected from the caudal vein and centrifuged at 4000×g for 10 min at 4◦C. The serum was removed from the centrifuge tubes and stored at −20◦C for the analysis of biochemical parameters. The exterior of the individuals was then wiped and the abdomen was opened at the ventral midline to separate and weigh viscera, intestine, and hepatopancreas. The entire intestine, hepatopancreas, and muscle tissues were collected from the selected fish, measured, and frozen on ice prior to storage at −20◦C for the analysis of hepatopancreas biochemical parameters. The weight gain rate (WGR), feed conversion ratio (FCR), feed rate (FR), relative intestine weight, and relative hepatopancreas weight were calculated by the following formulae:
WGR =(final weight - initial weight) ×100/ (initial weight)
FCR = amount of feed intake/ body mass gain
FR =total feeding ×100 / [feeding period ×(final weight +initial weight) / 2]
Survival rate (%) =final number of fish ×100 / initial number of fish
Relative intestine weight (%) =intestine mass ×100 / body mass
Relative hepatopancreas weight (%) =hepatopancreas mass ×100 / body mass
An additional three fish were randomly removed from each cage (12 fish/group), with the hepatopancreas removed aseptically into sterile containers and stored at −80◦C prior to DNA or RNA extraction.
All procedures were carried out according to national and institutional regulations for the care and use of experimental animals in accordance with the regulations made by the Institutional Animal Care and Use Committee (IACUC), Shanghai Ocean University (SHOU),which approved this study.
2.4. Muscle composition analysis
Muscle tissues were dried at 70◦C for 2h and then at 105◦C until reaching a constant weight to determine the moisture content. Protein was determined by measuring nitrogen (N×6.25) using the Kjeldahl method; lipids were measured by ether extraction using chloroformmethanol extraction (Wang S M, Chen S L & Cui Y B, 1993); ash was measured by combustion at 550◦C; muscle tissue glycogen was measured using specific analytical procedures and commercially available kits (Jiancheng Bioengineering Institute, Nanjing, China). For amino acids, the muscle tissue was freeze-dried, then hydrolyzed with 6N HCl at 110◦C for 24 h, and analyzed by the amino acid analyzer(Biochrom Ltd, Cambridge, Science Park, England). The lipids were esterified to fatty acid methyl esters (FAMEs) with 14% BF3 in methanol(Morrison W R, 1964) and extracted with hexane, before the fatty acids profile was analyzed in duplicate on an HP6890 gas chromatograph according to the method of Huang et al. (Huang X, Yin Y, Shi Z, Li W,Zhou H & Lv W, 2010).
2.5. Biochemical parameters
The hepatopancreas samples were homogenized by adding a sterile 0.85% saline solution to prepare 10% (W:V) homogenates and then centrifuged at 4000×g for 10 min at 4◦C. Supernatants were used for an activity analysis of alanine aminotransferase (ALT), aspartate aminotransferase (AST), and the content of hepatic glycogen and malonaldehyde (MDA) in 12h.
From the serum, total protein TP, albumin ALB, triglyceride TG, lowdensity lipoprotein cholesterol LDL-C, high-density lipoprotein cholesterol HDL-C, urea nitrogen UN, and activities of ALT and AST were measured. These parameters were measured using specific analytical procedures and commercially available kits (Jiancheng Bioengineering Institute, Nanjing, China).
2.6. Hepatic metabolomics
2.6.1. Chemicals and sample preparation-
All chemicals and solvents were analytical or HPLC grade. Water,methanol, pyridine, n-hexane, methoxylamine hydrochloride (97%),and BSTFA with 1% TMCS were purchased from CNW Technologies GmbH (Düsseldorf, Germany). Trichloromethane was from Sinopharm Chemical Reagent Co., Ltd. (Shanghai, China). L-2-chlorophenylalanine was from Shanghai Hengchuang Bio-technology Co., Ltd. (Shanghai,China).
Thirty milligrams of hepatopancreas was weighed and transferred to a 1.5-mL Eppendorf tube. Two small steel balls were added to the sample in addition to 20 μL of internal standard (2-chloro-l-phenylalanine in methanol, 0.3 mg/mL) and 600 μL of extraction solvent with methanol/water (4/1, v/v). Samples were stored at −80◦C for 2 min and then ground at 60 Hz for 2 min. After 120 μL of chloroform was added, the samples were vortexed, followed by 10 min of ultrasound-associated extraction at ambient temperature, and then stored at 4◦C for 10 min before being centrifuged at 12000 rpm for 10 min at 4◦C. A quality control (QC) sample was prepared by mixing aliquots of all samples into a pooled sample. An aliquot of the 400 μL supernatant was transferred to a glass vial to vacuum-dry at room temperature. Eighty microliters of methoxylamine hydrochloride (dissolved in pyridine, 15 mg/mL) was subsequently added. The resultant mixture was vortexed for 2 min and incubated at 37◦C for 90 min. Eighty microliters of BSTFA (with 1%TMCS) and 20 μL n-hexane were added into the mixture, which was vortexed for another 2 min and then dried at 70◦C for 60 min. The samples were held at ambient temperature for 30 min before GC-MS analysis.
2.6.2. GC/MS analysis–
The dried samples were analyzed on an Agilent 7890B gas chromatography system coupled to an Agilent 5977A MSD system (Agilent Technologies Inc., CA, USA). A DB-5MS fused-silica capillary column(30 m ×0.25 mm ×0.25 μm, Agilent J & W Scientific, Folsom, CA, USA)was utilized to separate the derivatives. Helium (>99.999%) was used as the transporting gas at a constant flow rate of 1 mL/ min through the column. The injector temperature was maintained at 260◦C. Injection volume was 1 μL in the splitless mode. The initial oven temperature was 60◦C, ramped to 125◦C at a rate of 8◦C/min, to 210◦C at a rate of 5◦C/min, to 270◦C at a rate of 10◦C/min, to 305◦C at a rate of 20◦C/min,and finally held at 305◦C for 5 min. The temperature of the MS quadrupole and ion source (electron impact) was set to 150 and 230◦C,respectively. The collision energy was 70 eV. Mass spectrometric data was acquired from the full-scan mode (m/z 50–500) and the solvent delay time was set to 5 min.
The QCs were injected at regular intervals (every 12 samples)throughout the analytical run to provide a set of data from which repeatability could be assessed.
2.6.3. Data Preprocessing and statistical analysis–
Data on physiological and biochemical indexes were presented as means ±SD. Data were analyzed in practical groups and purified groups via a Student’s t-test. The level of significance was set toP<0.05.
The data of metabolomics were analyzed as follows: ChemStation(version E.02.02.1431, Agilent, USA) was used to convert the file format of raw data (D) from the apparatus to a common data format (CDF).ChromaTOF (version 4.34, LECO, St Joseph, MI) was used to analyze the data. Metabolites were quantitatively presented by NIST and Fiehn database. After alignment with the Statistic Compare component, the“raw data array” (.cvs) was obtained from raw data with threedimensional data sets, including: sample information, peak names,retention timer-m/z, and peak intensities. There were 1039 peaks detected from all samples and quality controls. In the “data array”, all internal standards and any known pseudo positive peaks (caused by background noise, column bleed, or BSTFA derivatization procedure)were removed. The data were normalized to the total peak area of each sample, multiplied by 10,000, and the peaks from the same metabolite were combined. The total detectable metabolites were 379.
Data were transformed using log2 in Excel 2007 (Microsoft, USA)(using 0.000001 to replace 0 before transforming), then imported into the SIMCA software package (14.0, Umetrics, Umea, Sweden). Principle component analysis (PCA) and partial lease-squares-discriminant analysis OPLS-DA were performed to visualize the metabolic difference among experimental groups, after mean centering and unit variance scaling. The models were detected via 7-fold cross-validation and 200 response permutations-testing to avoid over-fitting and for validating the models. The Hotelling’s T2 region, shown as an ellipse in score plots of the models, defined the 95% confidence interval of the modeled variation. Variable importance in the projection (VIP) ranked the overall contribution of each variable to the OPLS-DA model and those variables with VIP >1 were considered relevant for group discrimination. In the present study, the default 7-round cross-validation was applied with 1/7th of samples excluded from the mathematical models in each round to guard against overfitting.
The differential metabolites were selected on the basis of the combination of a statistically significant threshold of VIP values obtained from the OPLS-DA model and p-values from a one-tailed Student’s t-test on the normalized peak area, where metabolites with VIP values >1 and p-values <0.05 were included.
Data for the physical and biochemical analyses were presented as means ± SD. Since there were huge differences between purified diets and practical diets, these two groups were analyzed separately. Data were analyzed via Student’s t-test and the level of significance was set toP<0.05.
3. Results
3.1. Survival and growth performance
No significant differences were observed in the survival rate, relative intestine weight, or relative hepatopancreas weight (P>0.05; Table 3).WGR was significantly higher in the FM group compared to RM (P<0.05), while FCR, FE, and FR were significantly higher in the T1 group compared to T0 (P<0.05).
3.2. Muscle tissue composition
No significant differences were observed in muscle tissue moisture(P> 0.05). The muscle tissue ash of the FM group was significantly lower than the RM group (P<0.05; Table 4). Protein and lipid content of the FM and T0 groups were significantly higher than the other treatments (P<0.05), while the glycogen was lower (P< 0.05).
No significant differences were observed in the percentage of muscle tissue essential amino acids (EAA), nonessential amino acids (NEAA), or total amino acids (TAA) (P>0.05). The methionine in the T1 group was higher than in the T0 group and proline in the RM group was higher than in the FM group (Table 5). Fatty acid percentages are presented in Table 6. The muscle tissue saturated fatty acids (SFA) percentage in the RM and T1 groups were significantly lower than in the FM and T0 groups, respectively (P<0.05), while the mono-unsaturated fatty acids(MUFA) in the RM group was significantly higher than the FM group (P<0.05).
3.3. Hepatopancreas and serum biochemical parameters
Hepatopancreas biochemical parameters are presented in Table 7.The hepatic activities of ALT and AST were higher in the T0 and FM groups compared to the T1 and RM groups, respectively, while the hepatic glycogen and MDA in the T0 and FM groups were significantly lower than the other treatments (P<0.05).
Serum parameters were revealed in Table 8, where the total protein and globulin content were significantly higher in the T1 and RM groups compared to the T0 and FM groups, respectively (P< 0.05). Albumin was significantly higher in the FM group compared to the RM group (P<0.05). Urea nitrogen was significantly higher in the T0 and FM groups compared to the other treatments (P< 0.05). Serum triglyceride wassignificantly higher in the T1 and RM groups compared to the other treatments (P< 0.05). LDL-C was significantly higher in the T0 group compared to T1 and the FM group was significantly lower than RM group (P<0.05), while HDL-C was significantly higher in the T0 group compared to T1 (P<0.05). The ALT activity in the T1 was significantly higher than T0 and the ALT activity in the T0 and RM were significantly higher than the T1 and FM groups, respectively (P< 0.05).
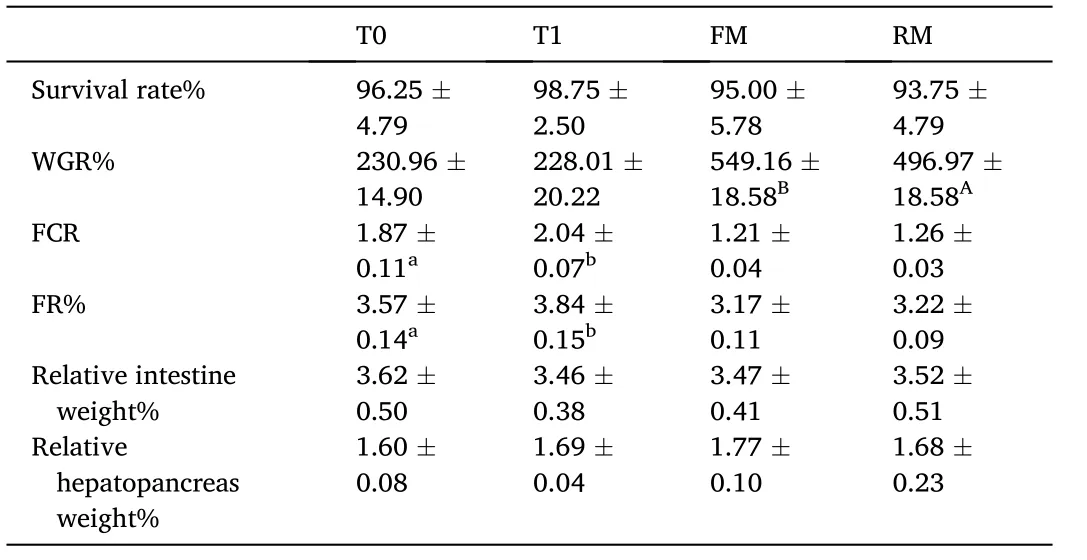
Table 3 Survival and growth performance of grass carp (means ± SD, n = 4). Different lower-case letters in the same row indicate significant differences between T0 and T1 (P <0.05) and different uppercase letters indicate significant differences between FM and RM (P < 0.05); values with no letter mean no significant difference (P >0.05).
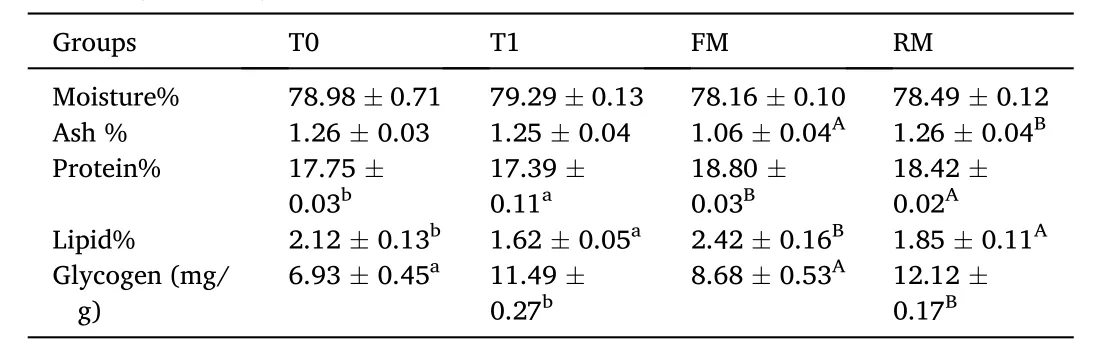
Table 4 Muscle composition (% dry matter) of grass carp (means ±SD, n =4). Different lower-case letters in the same row indicate significant differences between T0 and T1 (P <0.05) and different uppercase letters indicate significant differences between FM and RM (P < 0.05); values with no letter mean no significant difference (P > 0.05).
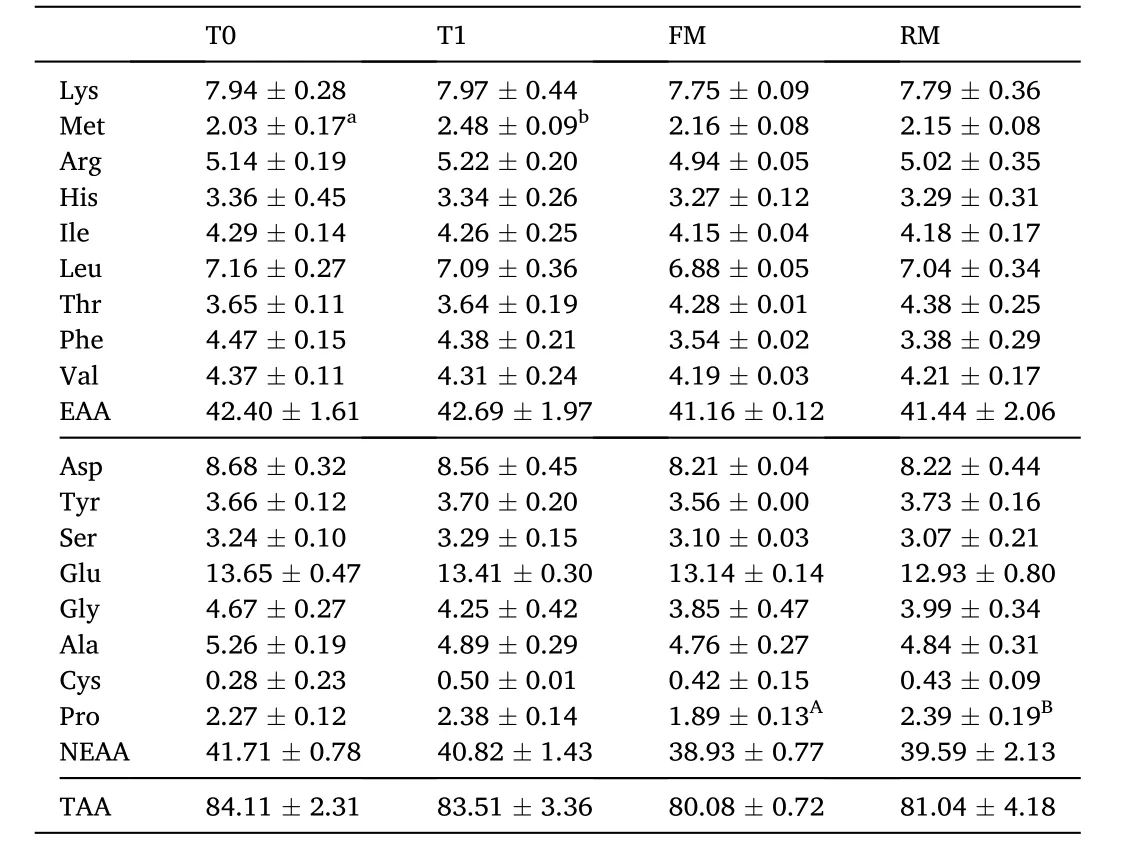
Table 5 Amino acid percentage in the muscle (% dry matter) of grass carp (means ±SD,n = 4). Different lower-case letters in the same row indicate significant differences between T0 and T1 (P < 0.05) and different uppercase letters indicate significant differences between FM and RM (P < 0.05); values with no letter mean no significant difference (P >0.05).
3.4. Metabolite identification and comparison
In total, 1039 valid peaks were identified in the hepatopancreas.After filtering, removing noise, and normalizing, 379 metabolites were detected.
The PCA analysis of hepatopancreas GC- MS metabolic profiles showed clearly separated clusters in each score scatter plot between the FM and RM groups, except for one FM group, indicating that metabolic profiles changed between FM and RM (Fig. 1). The total PCA model explained 0.449 of variation between groups using two principal components (PC; model parameters: R2XPC1=0.216, R2XPC2=0.115). None of the samples from either group fell outside the Hotelling’s T2 tolerance ellipse that denotes a 95% confidence limit, indicating that no outlier was present among the samples analyzed.
Furthermore, an OPLS-DA model including one predictive and one orthogonal component showed better discrimination between dietarygroups. OPLS-DA models were conducted between two groups at a time.The score plots of OPLS-DA model showed that all the samples between the T0 and T1 groups were within the 95% Hotelling T2 ellipse (model parameters: R2X p =0.44, R2Y =0.995, Q2=0.747; Fig. 2A) and FM and RM groups were within the 95% Hotelling T2 ellipse (model parameters:R2X p =0.477, R2Y =0.992, Q2= 0.242; Fig. 2B).
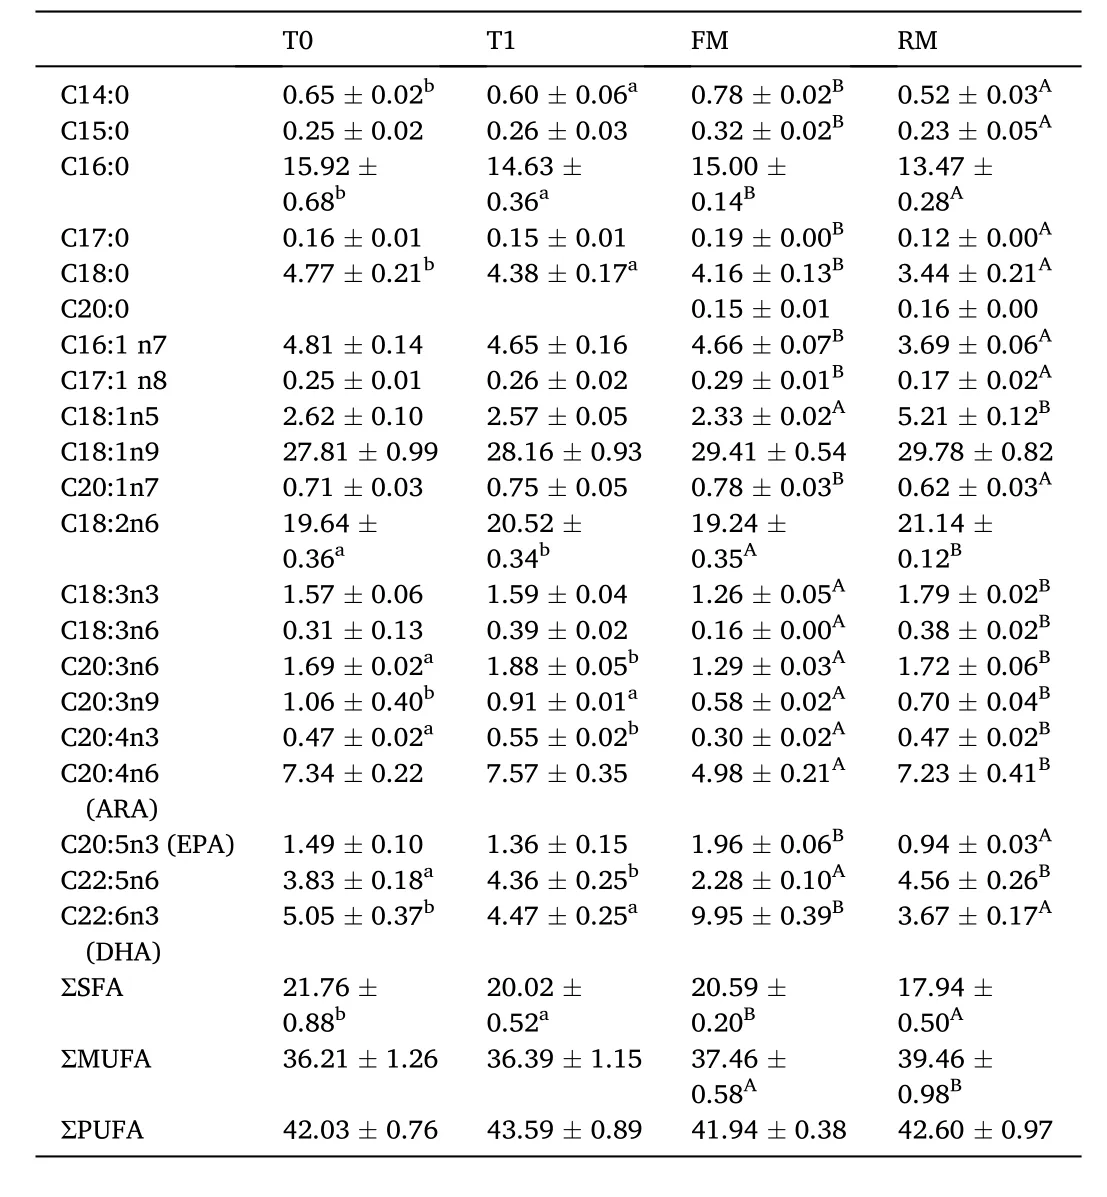
Table 6 Fatty acid percentage in the muscle (%) of grass carp (means ± SD, n = 4).Different lower-case letters in the same row indicate significant differences between T0 and T1 (P <0.05) and different uppercase letters indicate significant differences between FM and RM (P < 0.05); values with no letter mean no significant difference (P > 0.05).
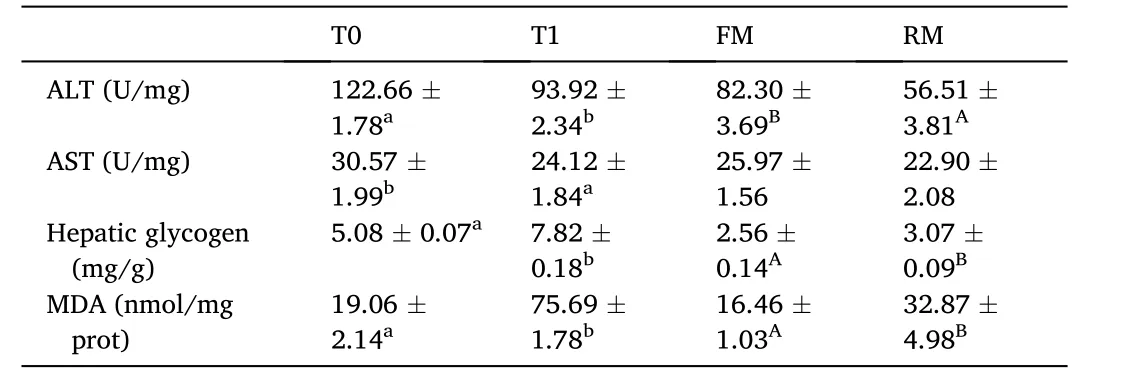
Table 7 Hepatopancreas parameters of grass carp (means ±SD, n =4). Different lowercase letters in the same row indicate significant differences between T0 and T1(P < 0.05) and different uppercase letters indicate significant differences between FM and RM (P < 0.05); values with no letter mean no significant difference (P >0.05).
3.5. Differential metabolites and metabolism pathway analysis
A total of 29 differential metabolites were identified between the T0 and T1 groups according to the OPLS-DA model and Student’s t-test(VIP > 1 andP< 0.05), of which 23 metabolites were downregulated and 6 metabolites were upregulated in the T1group compared to the T0 group (Table 9).
Between the FM and RM groups, 92 differential metabolites were identified, where 31 metabolites were downregulated and 61metabolites were upregulated in the RM group compared to the FM group (Table 10).
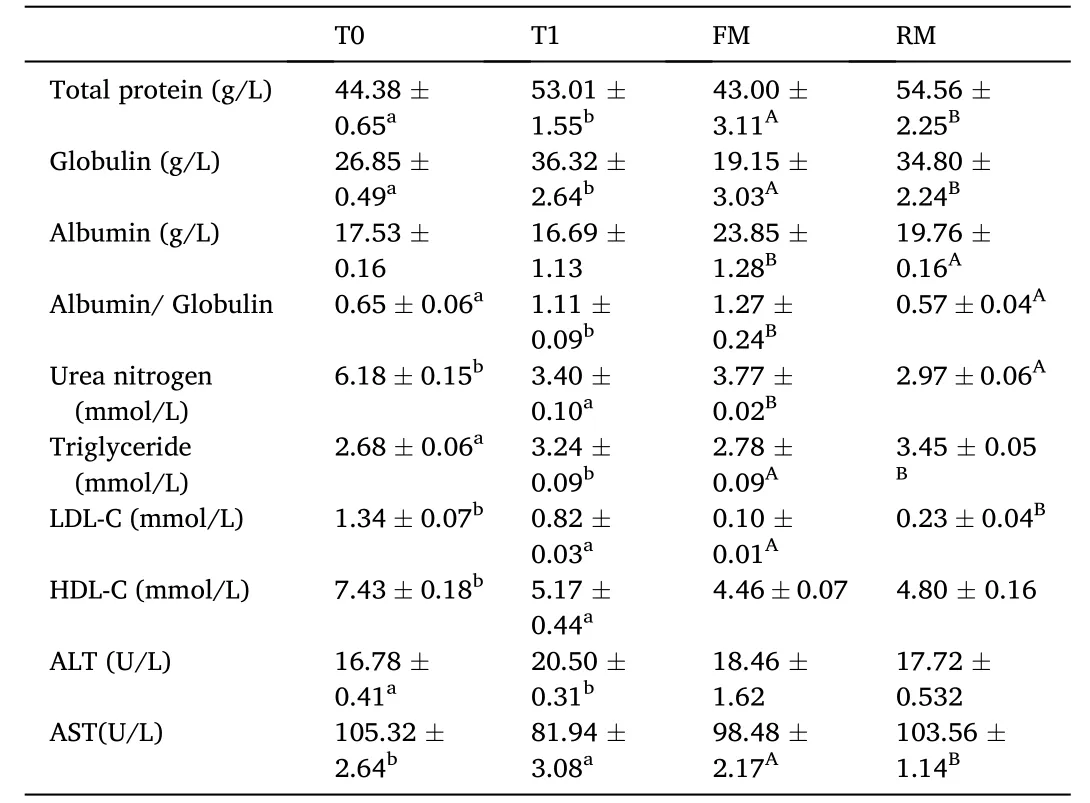
Table 8 Serum parameters of grass carp (means ±SD, n =4). Different lower-case letters in the same row indicate significant differences between T0 and T1 (P < 0.05)and different uppercase letters indicate significant differences between FM and RM (P <0.05); values with no letter mean no significant difference (P >0.05).
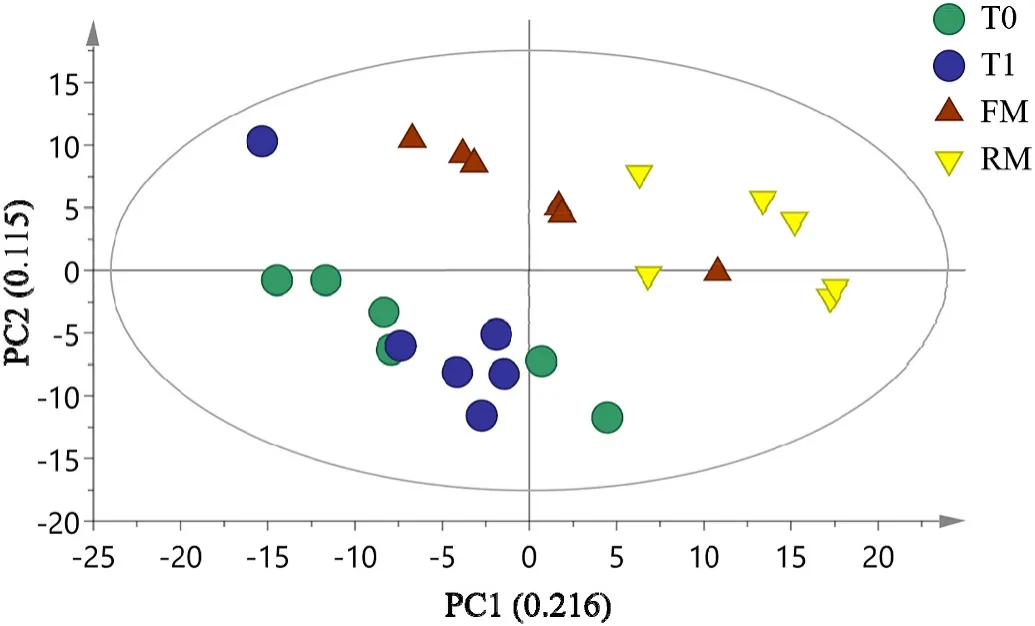
Fig. 1. PCA analysis of GC–MS metabolite profiles. R2X = 0.449, Q2 = 0.161.Ellipse: Hotelling’s T2 (95%).

Fig. 2A. OPLS-DA score plots for pair-wise comparisons between T0 and T1 group. R2X p = 0.44, R2Y = 0.998, Q2 = 0.532. Ellipse: Hotelling’s T2 (95%).
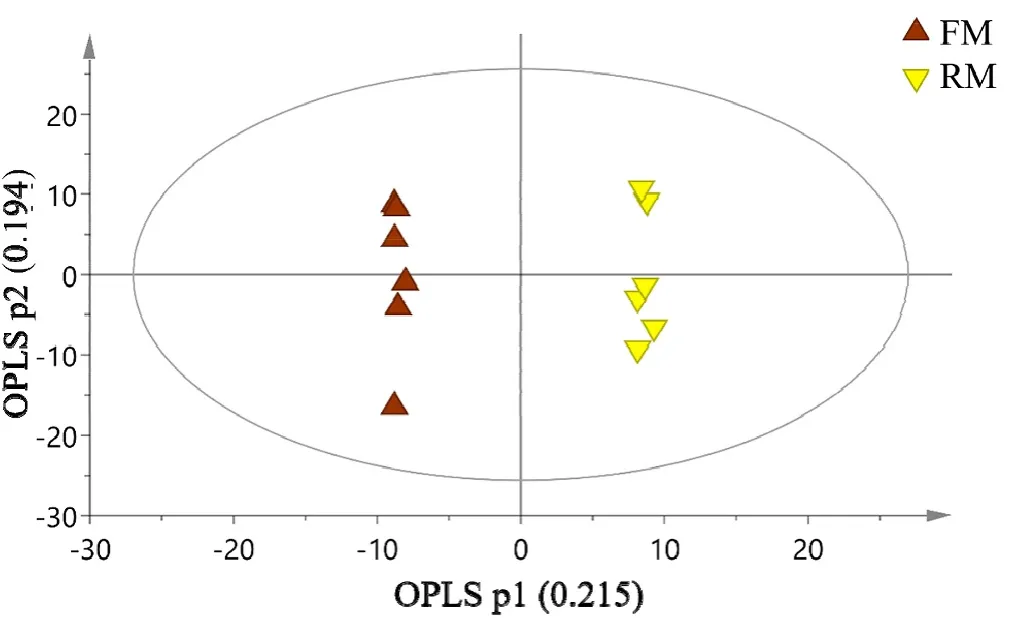
Fig. 2B. OPLS-DA score plots for pair-wise comparisons between FM and RM group. R2Xp = 0.477, R2Y = 0.999, Q2 = 0.763. Ellipse: Hotelling’s T2 (95%).
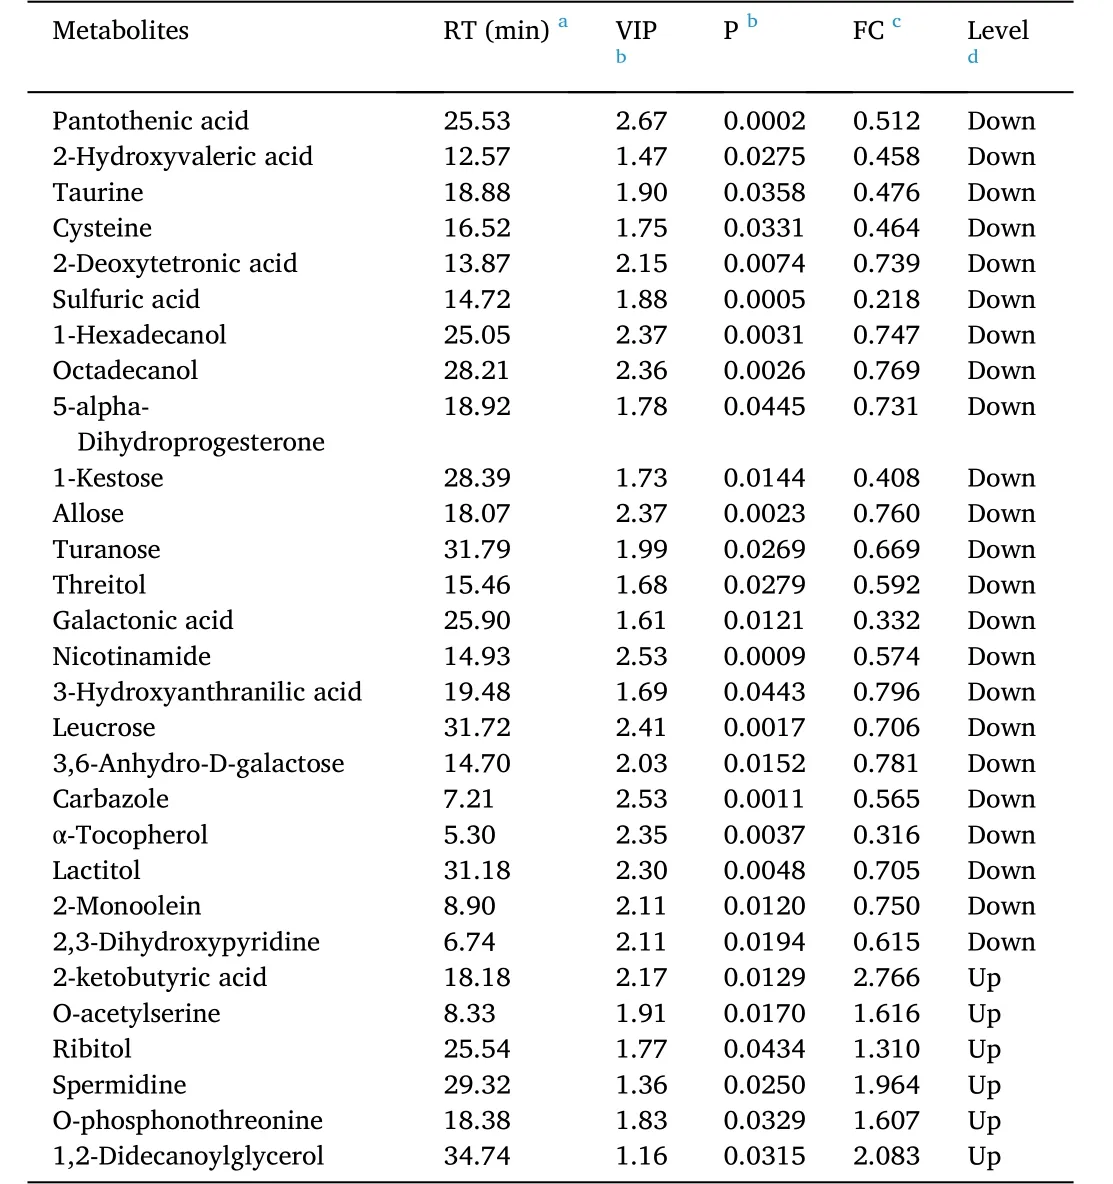
Table 9 Identification of significantly different metabolites in hepatopancreas between T0 and T1 groups.
Furthermore, the KEGG pathway analysis of differential metabolites(SDMs) was performed by MBROLE 2.0 (Tables 11 and 12). In the T1 and T0 groups, 8 metabolic pathways were selected (Table 11) and functional pathway analysis facilitating further biological interpretation revealed the most relevant pathways included: ABC transporters, beta-Alanine metabolism, cysteine and methionine metabolism, glycine,serine and threonine metabolism, tryptophan metabolism, glutathione metabolism, arginine and proline metabolism, valine, leucine, and isoleucine biosynthesis. In the FM and RM groups, 10 metabolic pathways were selected (Table 12), including: ABC transporters, aminoacyl-tRNA biosynthesis, arginine and proline metabolism, beta-Alanine metabolism, biosynthesis of unsaturated fatty acids, glycine, serine and threonine metabolism, phenylalanine, tyrosine and tryptophan biosynthesis, purine metabolism, hedgehog signaling pathway, and pyrimidine metabolism.

Table 10 Identification of significantly different metabolites in hepatopancreas between FM and RM groups.

Table 10 (continued)

Table 11 Identification of different metabolic pathways in hepatopancreas between T0 and T1 groups.
The integrated key metabolic pathways are displayed in Fig. 3. These were manually linked together based on the results of common key different metabolic pathways and the significantly changed pathways from different metabolites in the hepatopancreas, which illustrated the significantly different metabolites in hepatopancreas and key metabolic pathways.
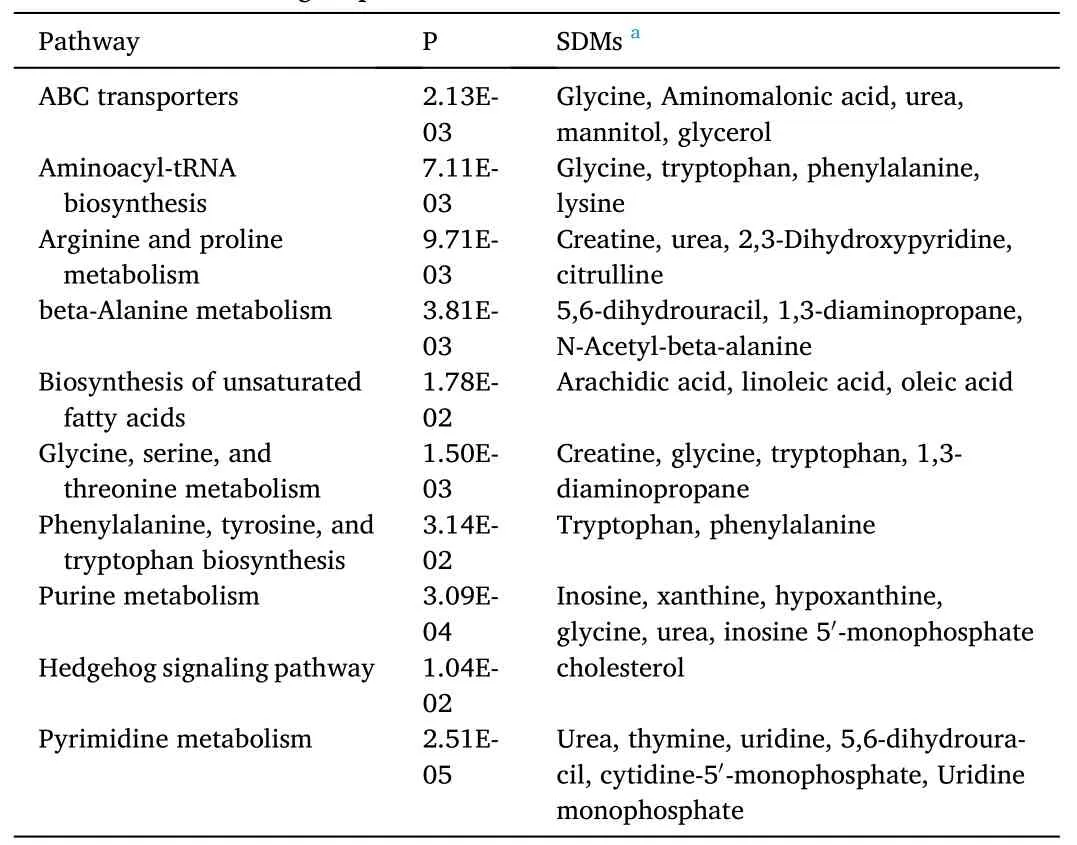
Table 12 Identification of significantly different metabolic pathways in hepatopancreas between FM and RM groups.
4. Discussion
The results showed that grass carp could tolerate a diet of 1.25%hydrolysable tannin without obviously poor growth, but that a 50%rapeseed meal diet would decrease the weight gain rate significantly.This was similar to a previous finding that the growth of grass carp decreased when fed a diet containing 34% canola meal (Jiang J, Shi D,Zhou X Q, Feng L, Liu Y, Jiang W D, Wu P, Tang L, Wang Y & Zhao Y,2016). These results indicated that excessive rapeseed meal in diets could reduce the growth performance of grass carp, but that tannins were not the primary reason for this change. However, when grass carp were fed diets containing 1.25% tannins, the FR increased. This may be because tannins decreased the metabolism of nutrients, so in order to receive adequate nutrition, grass carp increased their feed intake,something supported by a high FCR.
4.1. The effect of tannin and rapeseed meal on protein metabolism in grass carp
Proteins and amino acids are crucial in fish and play important roles in regulating growth, providing energy, regulating immune responses,and synthesizing hormones and enzymes. Protein deposition is the main source of live weight (biomass) gain in fish (Andr´e D, Lange C F M D,France J, Bureau D & 2007). In the present study, the muscle tissue protein content of the RM group was significantly lower than the FM group. This was in line with previous results for cobia (Rachycentron canadum) that were fed a diet containing 13% rapeseed meal, for which the muscle tissue protein content, apparent digestibility coefficients of crude protein, nitrogen retention, and protein efficiency ratio all decreased (Luo Y, Ai Q, Mai K, Zhang W, Xu W & Zhang Y, 2012).Similar results were also found for Ussuri catfish (Pseudobagrus ussuriensis) and rainbow trout (Oncorhynchus mykiss) fed diets containing 17% and 50% rapeseed meal, respectively (Bu X, Wang Y, Chen, F Y,Tang B et al., 2017; Burel C, Boujard T, Escaffre A M, Kaushik J S, Mol A K, Geyten V S & Khn R E, 2000). These results indicate that a high level of rapeseed meal decreases protein deposition and thereby reduces the rate of weight gain.
In the semi-purified groups, the growth performance was not influenced, but the muscle tissue protein content decreased in the T1 group compared to T0. This indicated that the protein metabolism might be affected. The activities of hepatic AST and ALT reveal the transformation of endogenous amino acids from dietary amino acids, which are important in catabolizing amino acids and transferring amino groups to alpha-keto acids (Cheng Z, Ai Q, Mai K & Xu W, 2010). When the available EAA is deficient, the alpha-keto acids decreased and the need for AST and ALT decreased as well. The AST and ALT activities were also lower in T1 compared to T0, indicating that the synthesis of protein was negatively impacted by supplemental tannins, perhaps due to the shortage of EAA resulting from decreased dietary protein digestibility.Ehen 1.25% of hydrolysable tannin supplemented to the diet of grass carp in our previous study, the trypsin activity increased, which was regarded as a protective mechanism to reduce the negative impact on digestion caused by tannins (Yao J, Peng C, Ringo E, Zhang G, Huang Z &Hua X, 2019). McCurdy and March (1992) reported that tannins bind with feed proteins and digestive enzymesin vivoand reduce the digestibility of proteins as well as diet palatability. Omnes et al. (2017)showed that a dietary tannin level of 3% reduced the protein retention and the apparent digestibility coefficient of protein in European seabass.Furthermore, the hepatic MDA increased in the T1 group compared to T0, indicating that the hepatopancreas was injured by tannins,providing another reason for low AST and ALT activities in the hepatopancreas and high ALT activity in the serum. Previous studies demonstrated that tannins inhibit antioxidant enzymes, damage the polyribosomes in liver, and inhibit the incorporation of amino acids into hepatic proteins (Holliman A, 1985). These takeaways are also supported by a study of carp (Cyprinus carpioL) after a 10 mg/kg body tannin injection (Varanka Z, Rojik I, Varanka I, Nemcsk J & Abrahm M,2001). Therefore, tannins may be partly responsible for the abnormal digestion and synthesis of protein resulted from dietary rapeseed meal.
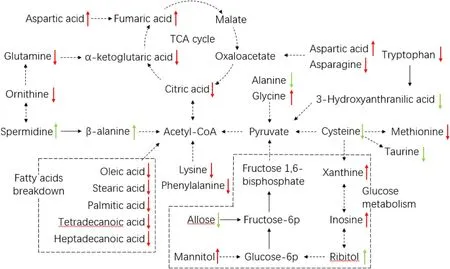
Fig. 3. Pathway map of metabolic changes in grass carp. Green up arrows mean the concentration of this metabolite in group T1 was significantly (P < 0.05) higher than T0, and green down arrows mean it was significantly (P< 0.05) lower in group T1 compared to T0. Red up arrows means the concentration of this metabolite in group RM was significantly (P <0.05) higher than FM, and red down arrows mean it was significantly (P < 0.05) lower in group RM compared to FM. (For interpretation of the references to colour in this figure legend, the reader is referred to the Web version of this article.)
Furthermore, unbalanced amino acids are a reason for depressed protein metabolism in fish that are fed a RM diet (Luo Y, Ai Q, Mai K,Zhang W, Xu W & Zhang Y, 2012; Men K K, Ai Q H & Mai K, 2014).Enami (2011) reported that EAA deficiency was one of the core reasons for poor growth performance in carp fed high rapeseed meal diets. In a study of grass carp where 2% Lys and 1% Met were supplemented in diets (DM), the growth rate, nutrition absorptive ability, and nitrogen utilization increased (Gan L, Liu Y J, Tian L X, Yang H J, Yue Y R, Chen Y J, Liang J J & Liang G Y, 2012). As shown in the RM diet (Table 2), Lys,Met, Arg, and His are necessary and limit amino acids when fishmeal is replaced by rapeseed meal. Met is important in protein synthesis. Wen,Wu, Chen, Wang, and Zhou (2014) reported that a diet of 0.6% Met promoted performance and breast muscle growth via increasing IGF-I and target of rapamycin (TOR) mRNA levels. In aquatic species, dietary Lys deficiency has a negative effect on protein and energy metabolism and impairs feed intake as well as growth performance (Li P, Mai K, Trushenski J & Wu G, 2009). Furthermore, the previous study reported that the energy cost of amino acid absorption would increase when dietary amino acids were unbalanced (Berge G E, Goodman M,Espe M & Lied E, 2004). Therefore, unbalanced amino acids caused by tannin supplements and rapeseed meal may accelerate protein decomposition to provide energy.
In addition, other dietary antinutritional factors in rapeseed meal have been reported to decrease the protein digestibility and amino acid bioavailability (Sarwar G G, Wu X & Cockell K A, 2012). Previous studies indicated that phytic acid would reduce phosphorus digestibility, cation mineral retention, protein utilization, and growth in aquatic animals(Forster I, 1999). An explanation for these findings is that, under neutral or alkaline conditions of the intestine, phytic acid binds with dietary proteins, minerals, and digestive enzymes to form phytate (Nyman M E,Bjorck I M, 1989). Glucosinolate is a main antinutrient in rapeseed meal,which would be hydrolyzed to isothiocyanates that interfere with the thyroid hormone, depress nutrition metabolism, and reduce feed intakes(Bille N, Eggum B O, Jacobsen I, Olsen O & Sørensen H, 1983; Burel C,Boujard T, Kaushik S J, Boeuf G, Mol K A, Van der Geyten S & Darras V M, 2001). The deleterious effect of isolated isothiocyanates on the protein digestive utilization, together with thyroid disturbances, was also reported in carp (Hossain M A & Jauncey K, 1989).
The different metabolic responses in fish fed different diets in this study may be related to nutrient utilization. The liver has the highest protein synthesis rate in fish, while in white muscle tissues, the protein synthesis rates are the lowest and the efficiency of protein deposition is highest (Kaushik S J & Seiliez I, 2010). In the muscle tissue amino acid results, no significant differences were observed between the FM and RM groups, except for Pro, while the metabolomics data showed that the hepatic Lys and Met were significantly lower in the RM group compared to the FM group. These results indicate that protein synthesis was suppressed when a 50% rapeseed meal was used for a grass carp diet. Pro plays an important role in regulating intracellular osmotic pressure in aquatic animals, which regulates the elimination of ammonia that is derived from broken down from amino acids and toxic to fish (Allen J A& Garrett M R, 1971). In the RM group, the percentage of Pro in muscle tissues was higher than FM and the arginine and proline metabolism in hepatopancreas was affected. This may be because the active decomposition of amino acids resulted from unbalanced dietary amino acids and stress status increased ammonia content, and fish increased Pro concentration to maintain osmotic pressure.
In semi-purified groups, no significant differences were observed in muscle tissues, except Met, while the metabolomics data showed that the hepatic Cys and taurine were significantly lower in the T1 group than T0 and the cysteine and methionine metabolism pathway was significantly influenced in the T1 group. Met is an indispensable sulfur amino acid in fish and plays a critical role in protein biosynthesis (Han C X & Miao C, 2013). Met is also a crucial methyl donor for most biological methylation reactions and is a key precursor for the synthesis of Cys and taurine (Riedijk M A, Stoll B, Chacko S, Schierbeek H, Sunehag L A,Goudoever B J & Burrin G D, 2007). We suppose that when dietary tannins were supplemented, the synthesis of protein was impaired,causing a higher dietary Met deposition in muscle tissues, but was not consumed as a functional amino acid, creating consequently low hepatic Cys and taurine. Further, Met is related to inflammation and antioxidation (Grimble R F, Grimble R F & Grimble G K, 1998). Previous studies showed that when aquatic animals were under stress, such as hunger and a changing environment, the Met content in muscle tissues sometimes increased (Liu F, Lv X & Liu Y, 2018). In the present study,the hepatic MDA in T1 was significantly higher than T0, indicating dietary tannins produce oxidation stress, and the deposition of Met may be connected with anti-oxidation.
Alanine (Ala) is a critical amino acid in proteins biosynthesis and glutamine could improve protein synthesis in the intestine (Joaquín S,2008; Ye Y, Wang Y& Cai C, 2007). These two amino acids could be synthesizedin vivoand branched-chain amino acids released from body proteins are the major nitrogen source for the synthesis of glutamine and alanine. Holeˇcek (2002) reported that the use of glutamine and alanine often exceeds their synthesis in tissues when protein breakdown is increased under stress states, which results in the decrease of glutamine and alanine. β-alanine is involved in antioxidant and buffering in fish(Snyder G S, Gaylord T G, Barrows F T, Overturf K, Cain Ke D, Hill R A &Hardy R W, 2012). In a study of Senegalese sole (Solea senegalensis Kaup), the level of β-alanine was elevated when the environment changed and acute stress was increased (Arag˜aO C, Corte-Real J, Costas B, Dinis T M & Conceiç˜ao E C, 2008). In the present study, the metabolomic data showed that the hepatic glutamine in the RM group was lower than FM, the Ala in the T1 group was lower than T0, and the β-alanine in T1 was higher than T0. These indicated that dietary tannins may induce a stress response and increase protein breakdown and does so in fish fed a diet that contained 50% dietary rapeseed. These partly explain the higher content of serum globulin and lower albumin content in the T1 and RM groups compared to the other treatments as well.
In addition, some metabolites of amino acids would participate in the tricarboxylic acid (TCA) cycle, which is involved in energy metabolism(Ming T, Han J, Li Y, Lu C, Qiu D, Zhou J & Su X, 2018). In the present study, fish fed an FM diet showed higher concentrations of Lys, Met, Glu,Asp, Phe, Try, citric acid, and alpha-ketoglutaric acid in hepatopancreas than fish fed an RM diet. Lower concentrations of glycine, cysteine,aspartic acid, succinic acid, L-Malic acid, and fumarate acid were found in the FM group compared to the RM group. In semi-purified diet groups,higher concentrations of Ala, Cys, taurine, pyruvic acid, fumaric acid,succinic acid, and L-Malic acid, as well as lower concentrations of β-alanine and alpha-ketoglutaric acid were observed in T0 group compared to T1. These suggested the perturbation of protein biosynthesis and catabolism, and that energy metabolic pathways leading to the TCA cycle might also be disturbed (Ming T, Han J, Li Y, Lu C, Qiu D,Zhou J & Su X, 2018). However, no significant effect was observed on the TCA cycle for a 0.75% tannin-supplemented diet.
4.2. The effect of tannins and rapeseed meal on lipid metabolism in grass carp
Dietary lipids provide the most stable and economical store for energy (Dias J, Alvarez M J, Diez A, Arzel J, Corraze G, Bautista J M &Kaushik S J, 1998). However, excessive lipid accumulation in fish strongly affects the quality of nutritional value and injures the fish via lipid oxidation and peroxidation (Chaiyapechara S, Casten M T & Hardy R W, 2003; Dias J, Alvarez M J, Diez A, Arzel J, Corraze G, Bautista J M& Kaushik S J, 1998).
The muscle tissue lipid content of the RM group was significantly lower than the FM group. A similar result of suppressed lipid retention was observed in yellow catfish (Tachysurus fulvidraco) when a diet of 30% rapeseed meal was used. Phytic acid presence in rapeseed meal is an important reason for these results, inhibiting lipid absorption by decreasing lipase activity (Liu N, Ru Y, Wang J & Xu T, 2010).Furthermore, previous studies supposed that dietary canola meal reduced lipogenesis by modulating a range of downstream targets, such as the element-binding protein 1C (SREP1C) and fatty acid synthase in the lipogenic pathway (Ngo D T, Wade N M, Pirozzi I & Glencross, B,2016; Calkin A C & Tontonoz P, 2012).
In semi-purified diet groups, the muscle tissue lipid content of T1 was significantly lower than T0. A study of rats showed that a diet of 2.5%tannins decreased the digestibility of protein and lipids (Nyman M E &Bjorck I M, 1989). The lipase structure was the cause, as the binding strength between the tannin and lipase is large and hard to modifyinvivo, partly suppressing the lipid digestion (Bell J G, Tocher D R &Sargent J R, 1994; Nyman M E & Bjorck I M, 1989). The activity of lipase in grass carp decreased with a 1.25% tannin diet (Yao J, Peng C, Ringo E,Zhang G, Huang Z & Hua X, 2019). Furthermore, another study on rats reported that hydrolysable tannin could reduce serum cholesterol in a high-fat diet by reducing the intestinal absorption of cholesterol(Yugarani T, Tan B K H & Das N P, 1993). The lower content of LDL-C in the T1 group compared to T0 could be explained by this result. Therefore, a rapeseed meal diet could reduce the accumulation of lipids in grass carp and tannins would be an important reason for that result.
Arachidonic acid (ARA) is the main fatty acid precursor of eicosanoids in fish, which regulate the physical stability of the cell membrane,interfere with the cytokine release, and alter immune functions (Bell J G,Tocher D R & Sargent J R, 1994). Qi, Zhu, and Reddy (2000) suggested that ARA and their metabolites were important regulators of PPARγ,which affects the transcription of genes in lipid metabolism and regulating fatty acid synthesis and storage (Dulce A M, Filipa R, Gonzalo M R,Gordon B, Sofia M et al., 2012). In a study of grass carp, when a 0.15%ARA diet was supplied, intraperitoneal fat index and adipocyte sizes decreased; the expression levels of adipogenic genes, such as LPL and FAS decreased; and the expression levels of lipid catabolic genes, such as PPAR α and ATGL increased (Tian J, Lei C & Ji H, 2017). Similar results also occurred in gilthead seabream (Sparus aurata) when a diet of 0.4%ARA was supplied (Dulce A M, Filipa R, Gonzalo M R, Gordon B, Sofia M et al., 2012). These results indicated that ARA is effective in improving lipolysis and inhibiting adipogenesis. In the present study, the content of hepatic and muscle ARA increased in both the T1 and RM groups compared to the other treatments. This may decrease the lipid content to some extent.
PUFA, especially highly unsaturated fatty acids (HUFA), play a crucial role in regulating growth performance, lipid metabolism, cell membrane fluidity, and immune function in fish (Kiron V, Thawonsuwan J & Panigrahi A, 2015). Several studies have suggested that fish have a preference for SFA and MUFA over PUFA in β-oxidation (Henderson R J, 1996; Stubhaug I, Frøyland L & Torstensen B E, 2005). In a study of pseudosciaena crocea (Larimichthys crocea), the percentage of SFA in the body decreased with the prolongation of starvation, while PUFA increased (Liu F, Lv X & Liu Y, 2018). In the present study, the decreased SFA levels in muscle tissues and the hepatopancreas indicated that the energy supplied by lipids may be improved in the T1 and RM groups.
Taurine can be synthesized partly by Cys in fish and is significant in eliminating free radicals, resisting lipid peroxidation, and participating in lipid digestion via forming bile acids (Goto T, Ui T, Une M, Kuramoto T, Kihira K & Hoshita T, 1996; Wright E C, Tallan H H & Lin Y Y, 1986).In the T1 and RM groups, hepatic MDA significantly increased compared to the other treatments, and hepatic taurine and Cys in the T1 group were significantly lower than the T0 group. These results suggested that although tannins and rapeseed meal could improve lipid metabolism,greater lipid peroxidation occurred as well. Previous studies reported that a high level of tannins could act as pro-oxidants (Sahu S C & Gray G C, 1997). In a study of the freshwater mussel (Unio tumidus), 10 μM of tannins induced lipid peroxidation through the generation of free radical species and contributed to the alterations of cellular functions and genotoxic damage (Labieniec M, Gabryelak T & Falcioni G, 2003).Therefore, 50% rapeseed meal diets induce lipid peroxidation and stress response in grass carp and tannins are an important reason for that reaction.
4.3. The effect of tannins and rapeseed meal on carbohydrate metabolism in grass carp
Glucose- 1-phosphate, glucose-6- phosphate, fructose-6-phosphate,D-fructose 1,6-bisphosphate, 3-phosphoglycerate, and pyruvic acid are important metabolic intermediates in glycolysis (Berghe G V D, 1986;Rocha C M, Carrola J, Barros A S & Antonio S, 2011), and Ala is a preferred substrate for gluconeogenesis in fish (French C J, Hochachka P W & Mommsen T P, 1983). In the present study, the metabolomic data of all these glycolysis-related metabolites and Ala were lower in T1 compared to T0, which indicated that dietary tannins enhance glucose metabolism. High levels of T1 glycogen in both muscle tissues and the hepatopancreas provided additional biochemical evidence for this(Kullgren A, Samuelsson L M, Larsson D G J, Bjrnsson T B & Bergman L E,2010). In the RM group, however, the hepatic glucose- 1-phosphate,glucose-6- phosphate, fructose-6-phosphate, and 3-phosphoglycerate were higher than FM, but the glycogen content increased. Therefore,tannins are likely to have a positive effect on carbohydrate metabolism,but were not the leading factor when a 50% rapeseed meal diet was used for grass carp. Furthermore, the muscle tissue glycogen content in the T1 and RM groups were higher than the other treatments, while the muscle lipid content decreased. This may be because the transformation to lipid from carbohydrate decreased, but the underlying mechanism is still unknown.
4.4. The effect of tannins and rapeseed meal on the metabolic pathways of grass carp
In order to clearly demonstrate the metabolic responses of grass carp to different diets, some metabolic pathways that were identified from the significantly different metabolites were drawn to display the interactions among the differential metabolites and pathways (Fig. 3).These pathways were mainly involved in lipid utilization, carbohydrate metabolism, amino acid metabolism, and the TCA cycle. According to metabolic pathway analysis, fatty acid metabolism in the energy supply was promoted in RM group compared to FM, and the effect on carbohydrate metabolism was unclear. In protein metabolism, most amino acid concentrations decreased in T1 and RM groups compared to the other treatments and the breakdown of amino acids might have been accelerated.
In conclusion, lipid utilization, carbohydrate metabolism, protein metabolism, and the TCA cycle were affected by rapeseed meal diets,which may cause poor growth performance and antioxidant response,and abnormal protein and lipid metabolism may be partly caused by tannins. As a result, when a high percentage of rapeseed meal is used in aquatic diets, especially in grass carp, tannins should be removed by hulling the rapeseed. More intensive investigations about these pathways should be performed in future research, especially for protein and lipid metabolism.
Ethics statement
All procedures were carried out according to national and institutional regulations on the care and use of experimental animals.The experimental handling and treatment of experimental fish were conducted in accordance with the regulations made by the Institutional Animal Care and Use Committee (IACUC), Shanghai Ocean University(SHOU), and this study was approved by the IACUC of SHOU, Shanghai,China.
Several data (Tables 3, 7 and 8) have been used in an author’s previous study (Yao J, Peng C, Ringo E et al. Effect of diet supplemented with rapeseed meal or hydrolysable tannin on the growth, nutrition and intestinal microbiota in grass carp (Ctenopharyngodon idellus).Frontiers in nutrition, 2019, 6: 00154); the data in Tables 3, 6–8 have been partly used in an author’s previous study (Yao J, Peng C, Apraku A et al.Hydrolysable tannin supplementation alters digestibility and utilization of dietary protein, lipid, and carbohydrate in grass carp (Ctenopharyngodon idellus).Frontiers in nutrition, 2019, 6: 00183).
Funding
This study was supported by the Key Laboratory of Freshwater Aquatic Genetic Resources, the Ministry of Agriculture, the Shanghai Ocean University, Shanghai, China.
Author contributions statement
Five authors are justifiably credited with authorship. Xueming Hua and Jingting Yao took part in the conceived the conceptualization;Jingting Yao, Ningyu Li and Xiang Li contributed to perform the experiment; Jingting Yao did the data curation, formal analysis, and wrote the original draft; Xueming Hua and Ning Liu revised the manuscript.
Declaration of competing interest
We declare that we do not have any commercial or associative interest that represents a conflict of interest in connection with the work submitted.
 Aquaculture and Fisheries2022年1期
- Aquaculture and Fisheries的其它文章
- A review of gynogenesis manipulation in aquatic animals
- Tilapia Lake Virus (TiLV) disease: Current status of understanding
- Classification and morphology of circulating haemocytes in the razor clam Sinonovacula constricta
- Potential probiotic and health fostering effect of host gut-derived Enterococcus faecalis on freshwater prawn, Macrobrachium rosenbergii
- Utility of gillnets for selectively targeting penaeids off Iran
- Refining tickler chains for penaeid trawls