
Survivin-positive circulating tumor cells as a marker for metastasis of hepatocellular carcinoma
2021-12-05 06:24:26JingYuZhanWangHuaZhangYiWangDongQingLi
World Journal of Gastroenterology 2021年43期
Jing Yu, Zhan Wang, Hua Zhang, Yi Wang, Dong-Qing Li
Abstract
Key Words: Survivin; Circulating tumor cells; Hepatocellular carcinoma; Prognosis;Metastasis
INTRODUCTION
According to 2020 statistics, hepatic cancer ranked sixth among malignant cancers in terms of incidence, and it ranked fourth globally as the main reason for cancer-related death[1]. Further, the 5 -year overall survival of this cancer is quite abysmal, as it is less than 12 %[1]. The prognosis of this disease continues to remain poor, even though there have been advances in the diagnostic and therapeutic strategies[2]. Hence,understanding the mechanisms underlying the metastasis of this cancer and assessing the status of disease progression are necessary.
The number of circulating tumor cells (CTCs) is an effective marker for solid tumors associated with metastasis[2]. CTC analysis is considered as real-time “liquid biopsy”for cancer patients, as it provides real-time monitoring of tumor progression and recurrence[3]. As a non-invasive biomarker, the CTC level can be used for comprehensive surveillance of cancer progression, in the case of both hepatocellular carcinoma (HCC) and cholangiocarcinoma[4]; in particular, it has been shown to be a good prognostic marker for HCC[5 -7]. Currently, the most commonly used technique for CTC isolation is the cell search system, which is the only FDA-approved detection method; this method is based on positive immunoselection of epithelial cell adhesion molecule (EpCAM) and negative immunoselection of leukocytes (for which the general target is CD45 ). By using this technique, CTCs are divided into epithelial CTCs, mesenchymal CTCs (mCTCs), and hybrid CTCs[8]. According to this classification, CTCs have been reported to be useful as a marker for epithelial-mesenchymal transition (EMT) in HCC[9], and EMT is a known marker for the diagnosis and prognosis of cancer progression. Accordingly, previous studies have revealed that CTCs undergoing EMT are useful as indicators for diagnosing HCC and for predicting its prognosis[10]. The prognostic value of CTCs has also been demonstrated after surgery or during chemotherapy and recurrence[11 ,12].
Survivin is an anti-apoptotic protein (molecular weight, 16 .5 kDa)[13] that plays an important role in inhibiting apoptosis in multicellular organisms and is overexpressed in many tumors, including HCC[14]. Studies have also shown that overexpression of survivin is associated with protection against apoptosis and propensity for metastasis in tumor cells, but this effect was not observed in normal cells[15]. Wurmbach et al[16]and Roessleret al[17] showed gene overexpression of survivin in HCC samples compared to normal liver samples, and the difference between the two groups was significant, as shown in Figure 1 . Additionally, recent research has shown that insulinlike growth factor-1 induced EMT via activation of survivin in HCC cells[18].Accordingly, overexpression of survivin mRNA and protein has been shown to stimulate EMT in HCC cells; this has been shown to increase their ability for invasion and migration and their cell proliferation rate, and decrease their apoptosis rate[15].Thus, there is evidence for the potential of survivin as a marker for cancer cell proliferation and metastasis.
As discussed above, the research so far has indicated that both CTCs and survivin are markers for EMT and, therefore, cancer progression in HCC. However, the serum survivin levels of HCC patients are not different from those of healthy controls and patients with nonmalignant chronic liver diseases[19]. And no study so far has analyzed the prognostic value of survivin-expressing CTCs in HCC. Therefore, in the present study, we explored whether survivin-positive CTC levels are associated with cancer stage and clinicopathological characteristics in HCC, and whether survivin expression in CTCs has potential as a predictor of metastasis in HCC patients.
MATERIALS AND METHODS
Genome data
Cancer genome atlas data were retrieved from GEO database (http://www.ncbi.nlm.nih.gov/geo) and TCGA database (http://www.ualcan.path.uab.edu). The GSE6467 and GSE14520 datasets were downloaded for this study. Data was analyzed using software packages including ClusterProfiler, GSEquery, and pheatmap.
Patient cohort
A study cohort (n= 179 ) included HCC patients who were enrolled at Hubei Cancer Hospital, China between May 2018 and December 2018 . Only patients for whom HCC was confirmed based on pathological evidence, according to the World Health Organization criteria, and patients who had not undergone prior anticancer treatment were included. The tumors were staged as 0 -A or B-C according to the Barcelona Clinic Liver Cancer (BCLC) staging system. Further, based on TNM classification, the tumors were staged as I, II, III, or IV. A control group comprised 70 healthy persons and 54 patients who tested positive for hepatitis B/C virus. The study was approved by the ethics committee of Hubei Cancer Hospital. (Ethical approval number:LLHBCH2019 LW-002 )
Collection of blood samples and isolation of CTCs
Samples of peripheral blood (a volume of 5 mL mixed with EDTA as an anticoagulant)were obtainedviavenipuncture. The CanPatrol CTC enrichment technique (SurExam,Guangzhou, China) was used to isolate CTCs from the blood samples and classify them. The samples were filtered through a membrane (pore diameter, 8 μm; Millipore,Billerica, United States), a vacuum plate that provided various valve settings(SurExam, Guangzhou, China), an E-Z 96 vacuum that also had various settings(Omega, Norcross, United States), and a vacuum pump (Auto Science, Tianjin, China).A cell lysis buffer that comprised 154 mmol/L NH4 Cl, 10 mmol/L KHCO3 , and 0 .1 mmol/L EDTA (all the reagents were from Sigma, St. Louis, United States) was used to induce lysis of erythrocytes. The cell suspension was then resuspended for 5 min in phosphate-buffered saline (Sigma, St. Louis, United States) that contained 4 % formaldehyde (Sigma, St. Louis, United States), and transferred to the specialized filtration system described earlier. The vacuum pump was turned on and set at a pressure of 0 .08 MPa. The CTCs were separated using the membrane as mentioned above.
Classification of CTCs by RNA in situ hybridization
CTC phenotypes were detected by RNAin situhybridization (ISH) with CD45 (a leukocyte marker), EpCAM and CK8 /18 /19 (epithelial cell markers), and vimentin and Twist (mesenchymal cell markers) as markers (Figure 1 ). A protease (Qiagen,Hilden, Germany) was used to pretreat the blood cells on the membrane. Following this, the cells were hybridized with a capture probe that targeted the genes for the markers mentioned above. Next, the cells were stained by 5 -min incubation with 4 ,6 -diamidino-2 -phenylindole (Sigma, St. Louis, United States), and viewed under an automated imaging fluorescence microscope (Keyence, United States). Red fluorescence signals were considered to indicate epithelial cell markers, while green fluorescence signals were considered to indicate mesenchymal cell markers. Further,bright white fluorescence signals were considered to indicate CD45 expression.
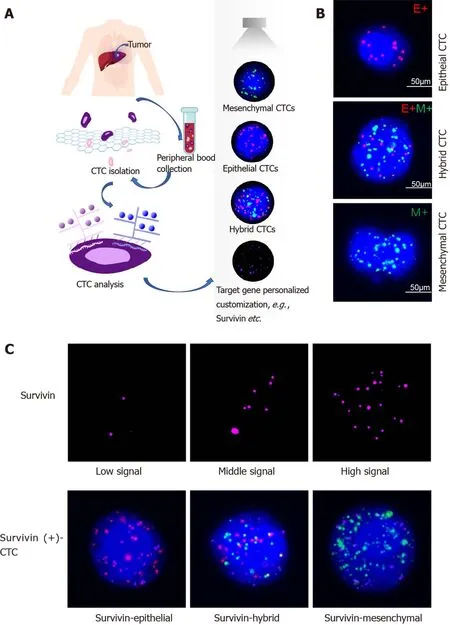
Figure 1 Circulating tumor cell classification and survivin expression in circulating tumor cells by RNA-in situ hybridization. A: Circulating tumor cell (CTC) isolation and RNA in situ hybridization analysis of blood samples from patients and healthy controls; B: Detection and classification of CTCs using epithelial-mesenchymal transition markers. CD45 was used as a leukocyte marker, and it is indicated by white fluorescence. Epithelial biomarkers (EpCAM and CK8 /18 /19 ) were used for epithelial CTCs, which are represented by red fluorescence, and mesenchymal biomarkers (vimentin and Twist) were used for mCTCs,which are represented by green fluorescence; C: Survivin expression in CTCs is indicated by purple fluorescence (Alexa Fluor 647 ), with the intensity scored as low,moderate, and high (left to right images). CTC: Circulating tumor cell. CTC: Circulating tumor cell.
Survivin expression in CTCs
Survivin expression in CTCs was assessed using the RNA-ISH method (Figure 1 C).Survivin expression is indicated by purple fluorescence emitted by the CTCs (Alexa Fluor 647 ). According to the signal intensity score, survivin expression was classified as absent (0 ), low (1 -2 ), moderate (3 -9 ), and high (signal > 9 ), as shown in Figure 1 C.
In vitro silencing and overexpression of survivin
The HCC cell line HepG2 was obtained from the cell bank of the Chinese Academy of Science and cultured in Dulbecco’s modified Eagle medium with 10 % fetal bovine serum and 1 % penicillin/streptomycin at 37 °C in a 5 % CO2 incubator.
Short hairpin RNAs against the survivin sequence (5 '-CTTACCAGGTGAGAAGTGAGGT-3 ') were designed to knockdown survivin in HepG2 cells, by transfec-tion with the vector pGPU6 harboring siRNAs against survivin. The lentivirus vector pCDH-CMV-MCS-EF1 -CopGFP-T2 A-Puro was used to induce overexpression of survivin in HepG2 cells. The vector and siRNA were obtained from Hualian Biotechnology Company (Wuhan, China). HepG2 cells were stably transfected with the survivin siRNA and lentivirus-siRNA plasmid using Lipofectamine2000 (Invitrogen).The transfected cells were incubated in selection medium containing 2 mg/mL puromycin for 2 wk (Bioswamp), and Western blot analysis was used to assess survivin expression.
Cell proliferation and apoptosis analysis
The CCK-8 kit (Bioswamp Company, China) was used to analyze cell proliferation according to the manufacturer’s protocol. The staining reagent used was CCK-8 (at a volume of 10 mL); the cells were incubated with the reagent for 2 h at 37 °C for 12 h, 24 h, 36 h, 48 h, 60 h, and 72 h after transfection (with the survivin siRNA or lentivirus).Following this, the absorbance of the cells was detected at 450 nm. Flow cytometry(Beckman, United States) was used to analyze cell apoptosis with the Annexin V-PE and 7 AAD assay kit (Becton, Dickinson Company, United States). Apoptotic cells were defined as PE-positive and 7 AAD-negative, while necrotic or dead cells were defined as 7 AAD-positive and PE-negative.
Cell invasion analysis
For the invasion experiment, cells were seeded at a density of 5 × 10⁴ cells/well in Transwell inserts (pore diameter, 8 µm) coated with Matrigel and containing cold serum-free medium. After an incubation period of 48 h, non-invasive cells that were present in the upper compartment were removed with a cotton swab, and the cells that had successfully adhered to the lower compartment were subjected to fixation with 10 % paraformaldehyde and staining with 0 .1 % hexamethylpararosaniline for 30 min.The number of cells was counted under a microscope (Olympus BX53 ) in five selected fields. The average number of adherent cells was calculated.
Western blot and immunohistochemistry analysis of survivin protein expression in HCC tissue
Formalin-fixed paraffin-embedded specimens of HCC tissues from Hubei Cancer Hospital were prepared for immunohistochemical staining. The tissue slides were washed in phosphate-buffered saline (Bioswamp, China) after dewaxing and dehydration. The slides were placed in plastic tubes and incubated with boiling citric acid for antigen retrieval. In the next step, endogenous peroxidase activity was inhibitedvia10 -min incubation in methanol containing 3 % H2 O2 . Next, the slides were blocked by 15 -min incubation in 1 % goat serum at 37 °C. Following this, they underwent incubation with anti-survivin rabbit polyclonal antibody (1 :100 dilution;Abcam, United Kingdom) at 4 °C overnight in a moist chamber. After treatment with the secondary antibodies for 30 min, the slides were colored with diaminobenzidine and counterstained with hematoxylin. All the images were captured using an Olympus BX53 microscope. The protocol for Western blot assay of survivin protein expression in the tissue specimens was the same as that described for Western blot analysis of the HepG2 cells.
Statistical analysis
All analyses were conducted using SPSS version 20 .0 (IBM Corp., Armonk, NY, United States). The Kolmogorov-Smirnov method was used to determine the normality of the CTC and survivin-positive CTC counts, which were found to be non-normally distributed. The phenotypic CTC counts and survivin expression in different groups were examined by the Fisher exact probability test. Correlations between variables were evaluated with the Spearman rank correlation test.P< 0 .05 was considered to indicate statistical significance.
RESULTS
Analysis of genome data
Based on the GSE6467 and GSE14520 datasets, gene expression was found to differ between tumor tissue and normal tissue, as evident from the survivin gene expression data shown in Figure 2 A and 2 C. Next, we found that DNA replication and cell cycle pathways were downregulated in HCC samples, based on the Ingenuity pathway analysis (Z-score < 0 ; Figure 2 B).
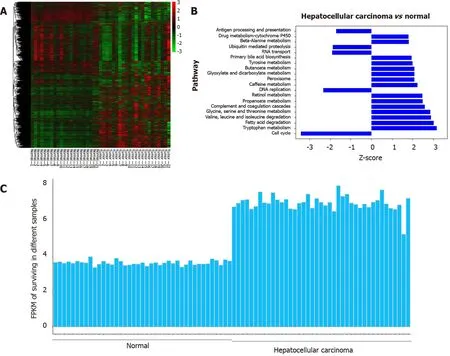
Figure 2 Analysis of survivin gene expression in normal liver tissue and hepatocellular cancer tissue from previously reported genome data. A: The expression patterns in 21 normal tissue samples and 22 hepatocellular carcinoma samples were analyzed by hierarchical clustering; B: Ingenuity pathway analysis was used to identify the upregulated pathways (Z-score > 0 ) and the downregulated pathways (Z-score < 0 ) in the normal tissue samples and hepatocellular cancer (HCC) samples; C: The FPKM (fragments per kilobase of transcript per million fragments mapped) of survivin was determined for different samples. Compared with normal liver tissue samples, the expression of the survivin gene was upregulated in HCC samples.
Based on the TCGA data analysis, the expression of survivin in HCC tissue was significantly associated with stage and tumor grade. Survivin expression (fragments per kilobase of transcript per million fragments mapped) in patients with stages III and IV HCC was significantly higher than that in patients with stages I and II HCC (P< 0 .05 ). And survivin expression (fragments per kilobase of transcript per million fragments mapped) in patients with grades 3 and 4 HCC was significantly higher than that in patients with grades 1 and 2 HCC (P < 0 .05 ) (Supplementary Figure 1 ).
Survivin expression in HCC specimens and normal hepatic tissues
The survivin expression level in tissue samples from HCC patients (n= 8 ) was significantly higher than that in normal hepatic tissues (n= 4 ), as indicated in the Western blot in Figure 3 A and the immunohistochemical staining images in Figure 3 B.
Association between survivin expression and cell proliferation, apoptosis, and invasion abilities in HepG2 cells
Silencing of survivin expression and overexpression of survivin were successfully induced by siRNA and lentivirus transfection, respectively (Figure 4 A). At 12 h, 24 h,48 h, 60 h, and 72 h post-transfection, the cell proliferation rate was significantly higher in the survivin-overexpression cells than in the control cells and survivin-silenced cells, while it was significantly lower in the survivin-silenced cells than in the control cells and survivin-overexpressing cells (Figure 5 A). Accordingly, the apoptosis rate of survivin-silenced HepG2 cells was significantly higher than that of survivin-overexpressing and normal control cells (Figure 4 B). Finally, the results for cell invasion rates obtained from the Transwell migration assays indicated that the survivin-overexpressing HepG2 cells had significantly higher invasive ability than the survivinsilenced and normal control cells (Figure 5 B).
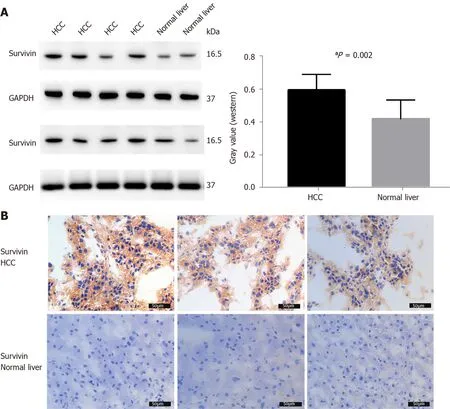
Figure 3 Survivin expression in hepatocellular cancer and normal adjacent tissue samples. A: Western blot analysis showing the protein expression of survivin in hepatocellular cancer (HCC) (n = 8 ) and normal liver tissue (n = 4 ); B: Immunohistochemical staining for survivin in HCC (n = 8 ) and normal liver tissue (n = 4 ). Survivin expression was higher in HCC than in normal liver tissue. aP < 0 .05 . HCC: Hepatocellular cancer.
Isolation and classification of CTCs
The observations of RNA-ISH analysis of CTCs based on EMT markers are shown in Figure 1 B. The expression of survivin in these subtypes of CTCs is also indicated. The proportion of mCTCs is shown in Figure 6 C. The number of mCTCs seemed to be higher in advanced-stage HCC (stage B-C) than in metastatic HCC.
CTC count and its association with clinicopathological characteristics of HCC patients
Table 1 shows the clinicopathological characteristics of the study cohort. A CTC count of > 5 /5 mL was detected in 168 out of 179 blood samples (93 .85 %), and the median CTC count was 16 /5 mL (range, 1 -193 CTCs/5 mL). Further, survivin-positive CTCs were detected in 94 .41 % (169 of 179 ) of the patients. As shown in Figure 6 , the median CTC count (Figure 6 A) and survivin-positive CTC count (Figure 6 B) in HCC patients were significantly higher than those in the HBV/HCV patients and healthy controls (P< 0 .05 ). Patients with stage B/C HCC (or advanced HCC) had a significantly greater median CTC count than those with stage 0 /A HCC (or early-stage HCC) (P = 0 .024 )(Table 1 ), and the median CTC count in patients with poorly differentiated tumors was significantly higher than that in patients with well-differentiated tumors (P= 0 .002 )(Table 1 ).
Correlation between mCTC counts and clinicopathological features
Out of the 179 patients, 138 had an mCTC count of > 2 /5 mL. The mCTC count was not significantly associated with AFP level, tumor stage, or degree of differentiation(Table 1 ). However, the proportion and count of mCTC were associated with BCLC stage and metastasis (Figure 6 C).
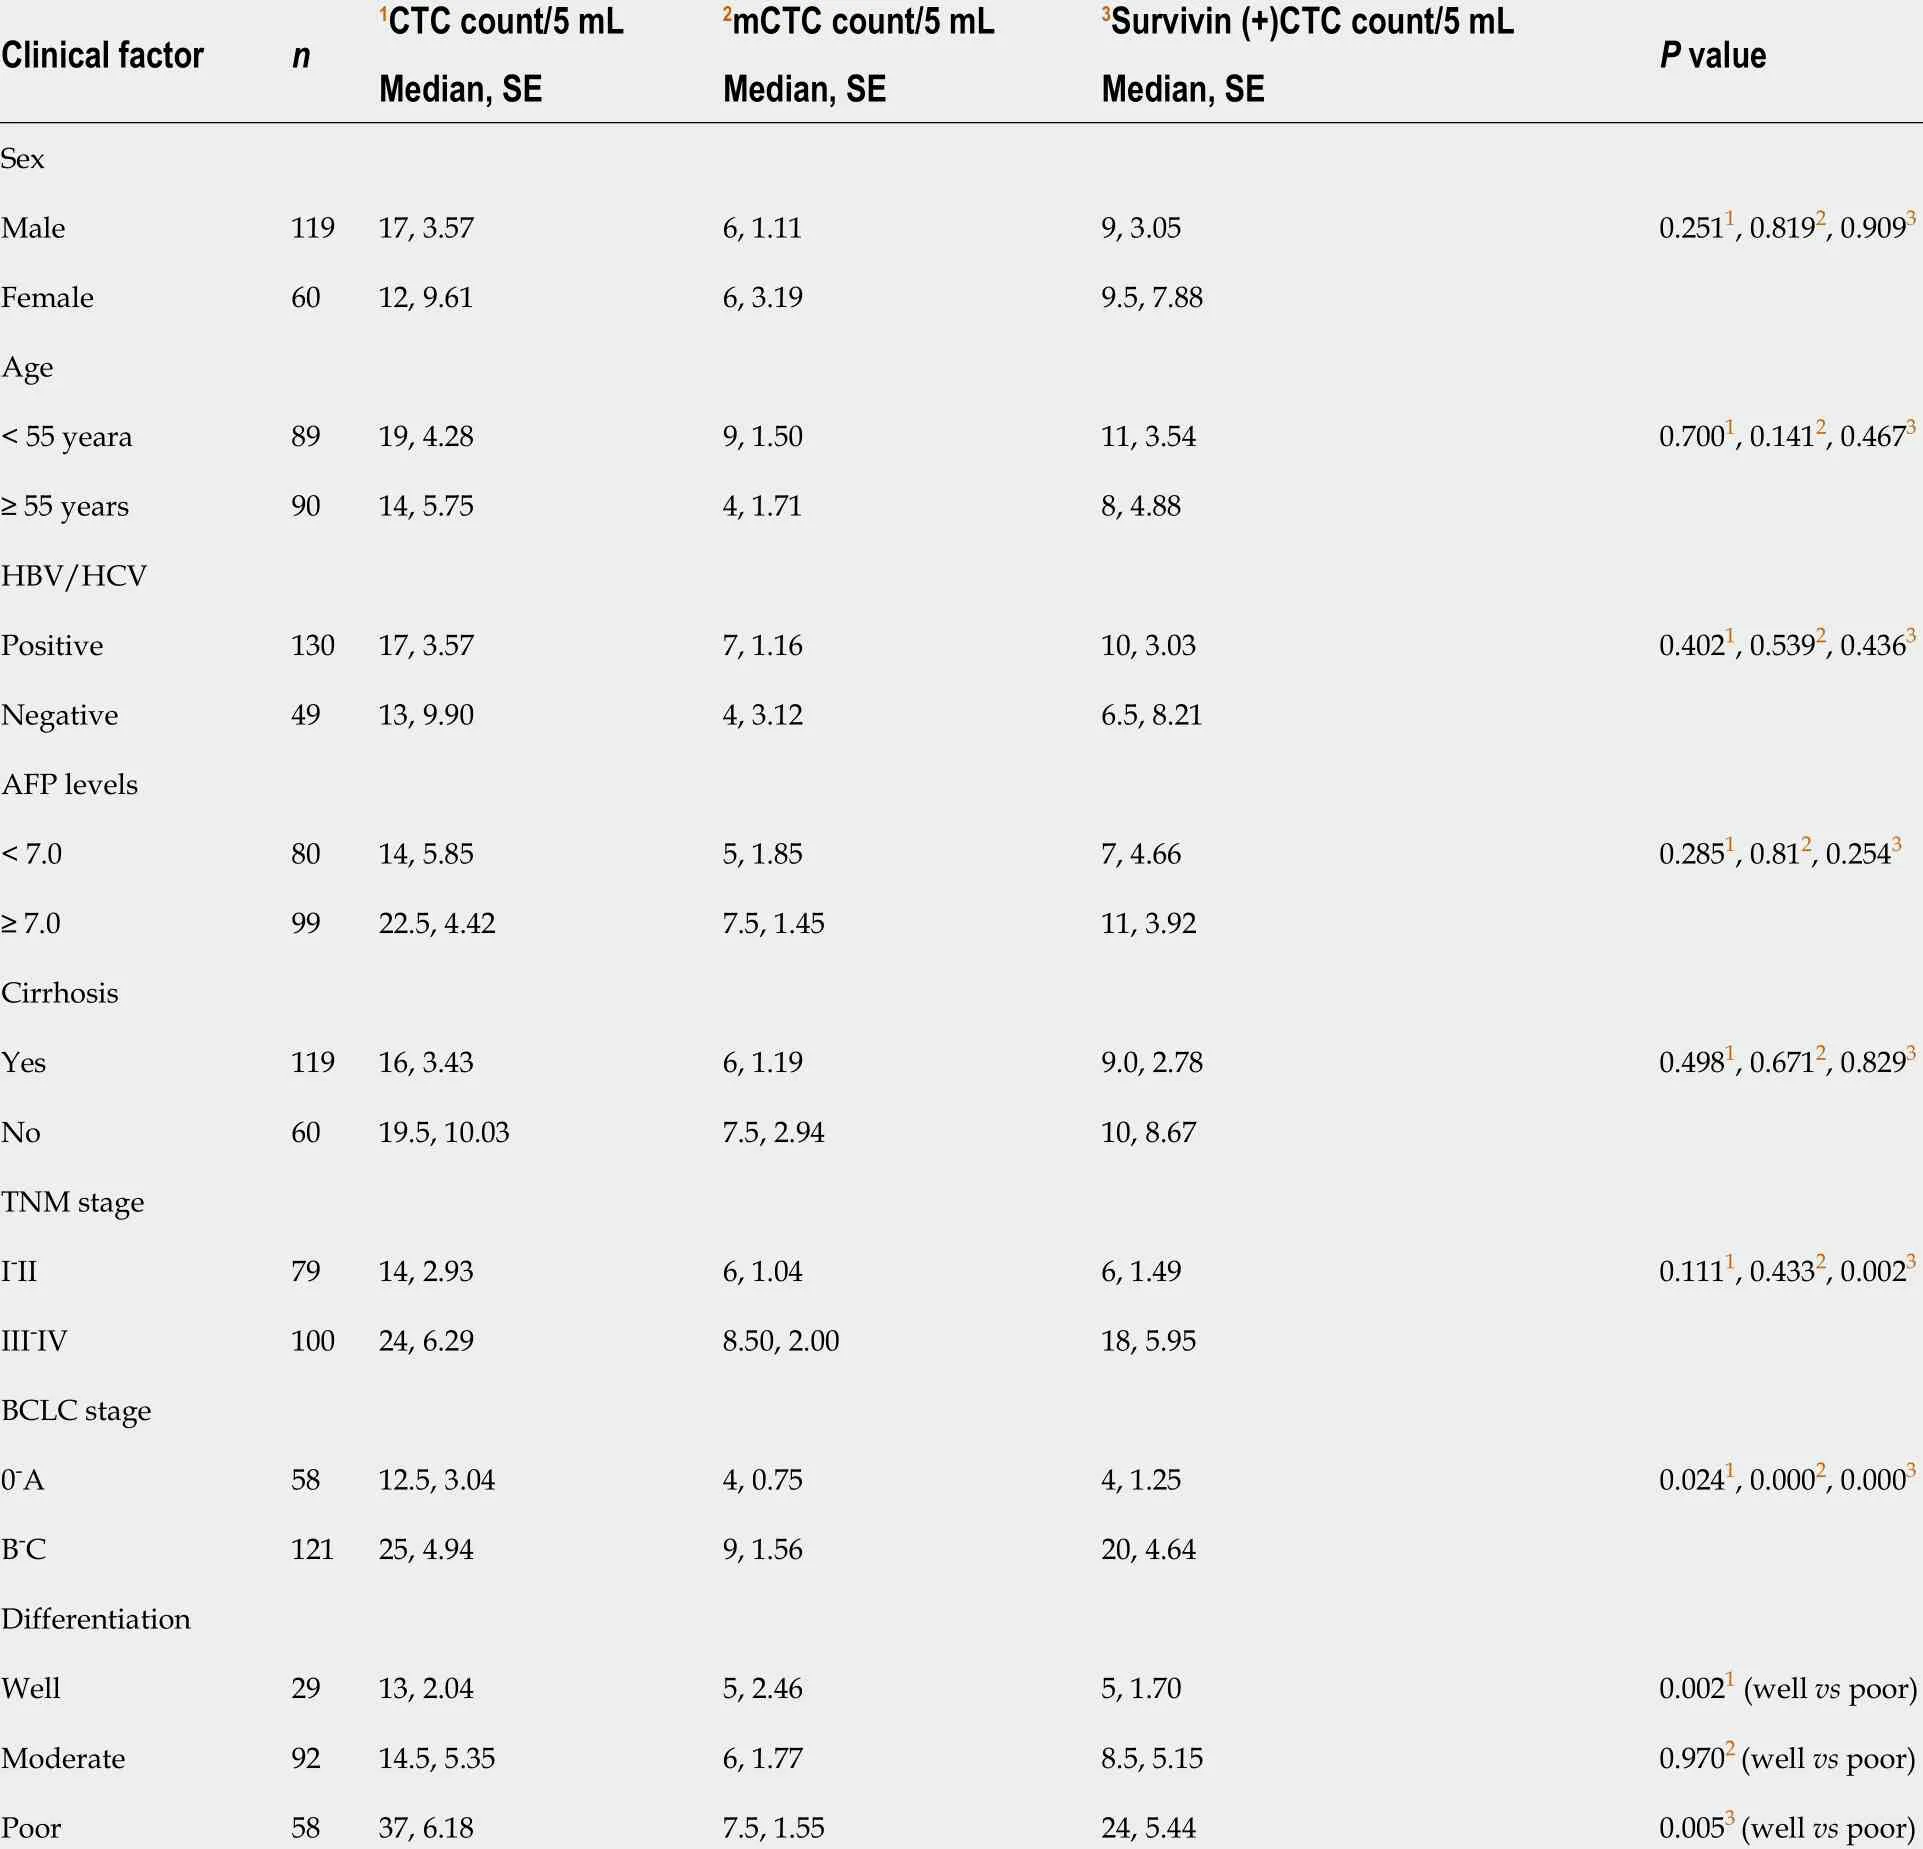
Table 1 Clinical characteristics of 179 hepatocellular cancer patients
ROC curve analysis of CTCs, survivin-positive CTCs, and mCTC proportion
The area under the ROC curve was 0 .84 [95 % confidence interval (CI) = 0 .77 -0 .91] for CTCs, 0 .82 (95 %CI = 0 .75 -0 .89 ) for survivin-positive CTCs, and 0 .82 (95 %CI = 0 .75 -0 .90 )for the proportion of mCTCs (Figure 6 D). The rational cut-off value for diagnosis was 12 for the CTC count (sensitivity = 60 .89 %, specificity = 91 .13 %), 4 for the survivinpositive CTC count (sensitivity = 81 .01 %, specificity = 78 .23 %), and 1 .85 % for the proportion of mCTCs (sensitivity = 84 .92 %, specificity = 72 .58 %).
Correlation between survivin expression in CTCs and clinicopathological factors of HCC patients
The survivin-positive CTC counts were not significantly associated with AFP levels.However, the median survivin-positive CTC count in patients with stages III and IV HCC was significantly higher than that in patients with stages I and Ⅱ HCC (Table 1 ).Further, patients with stage B/C HCC (or advanced HCC) had a significantly greater median survivin-positive CTC count than those with stage 0 /A HCC (or early-stage HCC) (P< 0 .001 ) (Table 1 ). Finally, patients with poorly differentiated HCC had a significantly greater median survivin-positive CTC count than those with well-differentiated tumors (P= 0 .005 ) (Table 1 ).
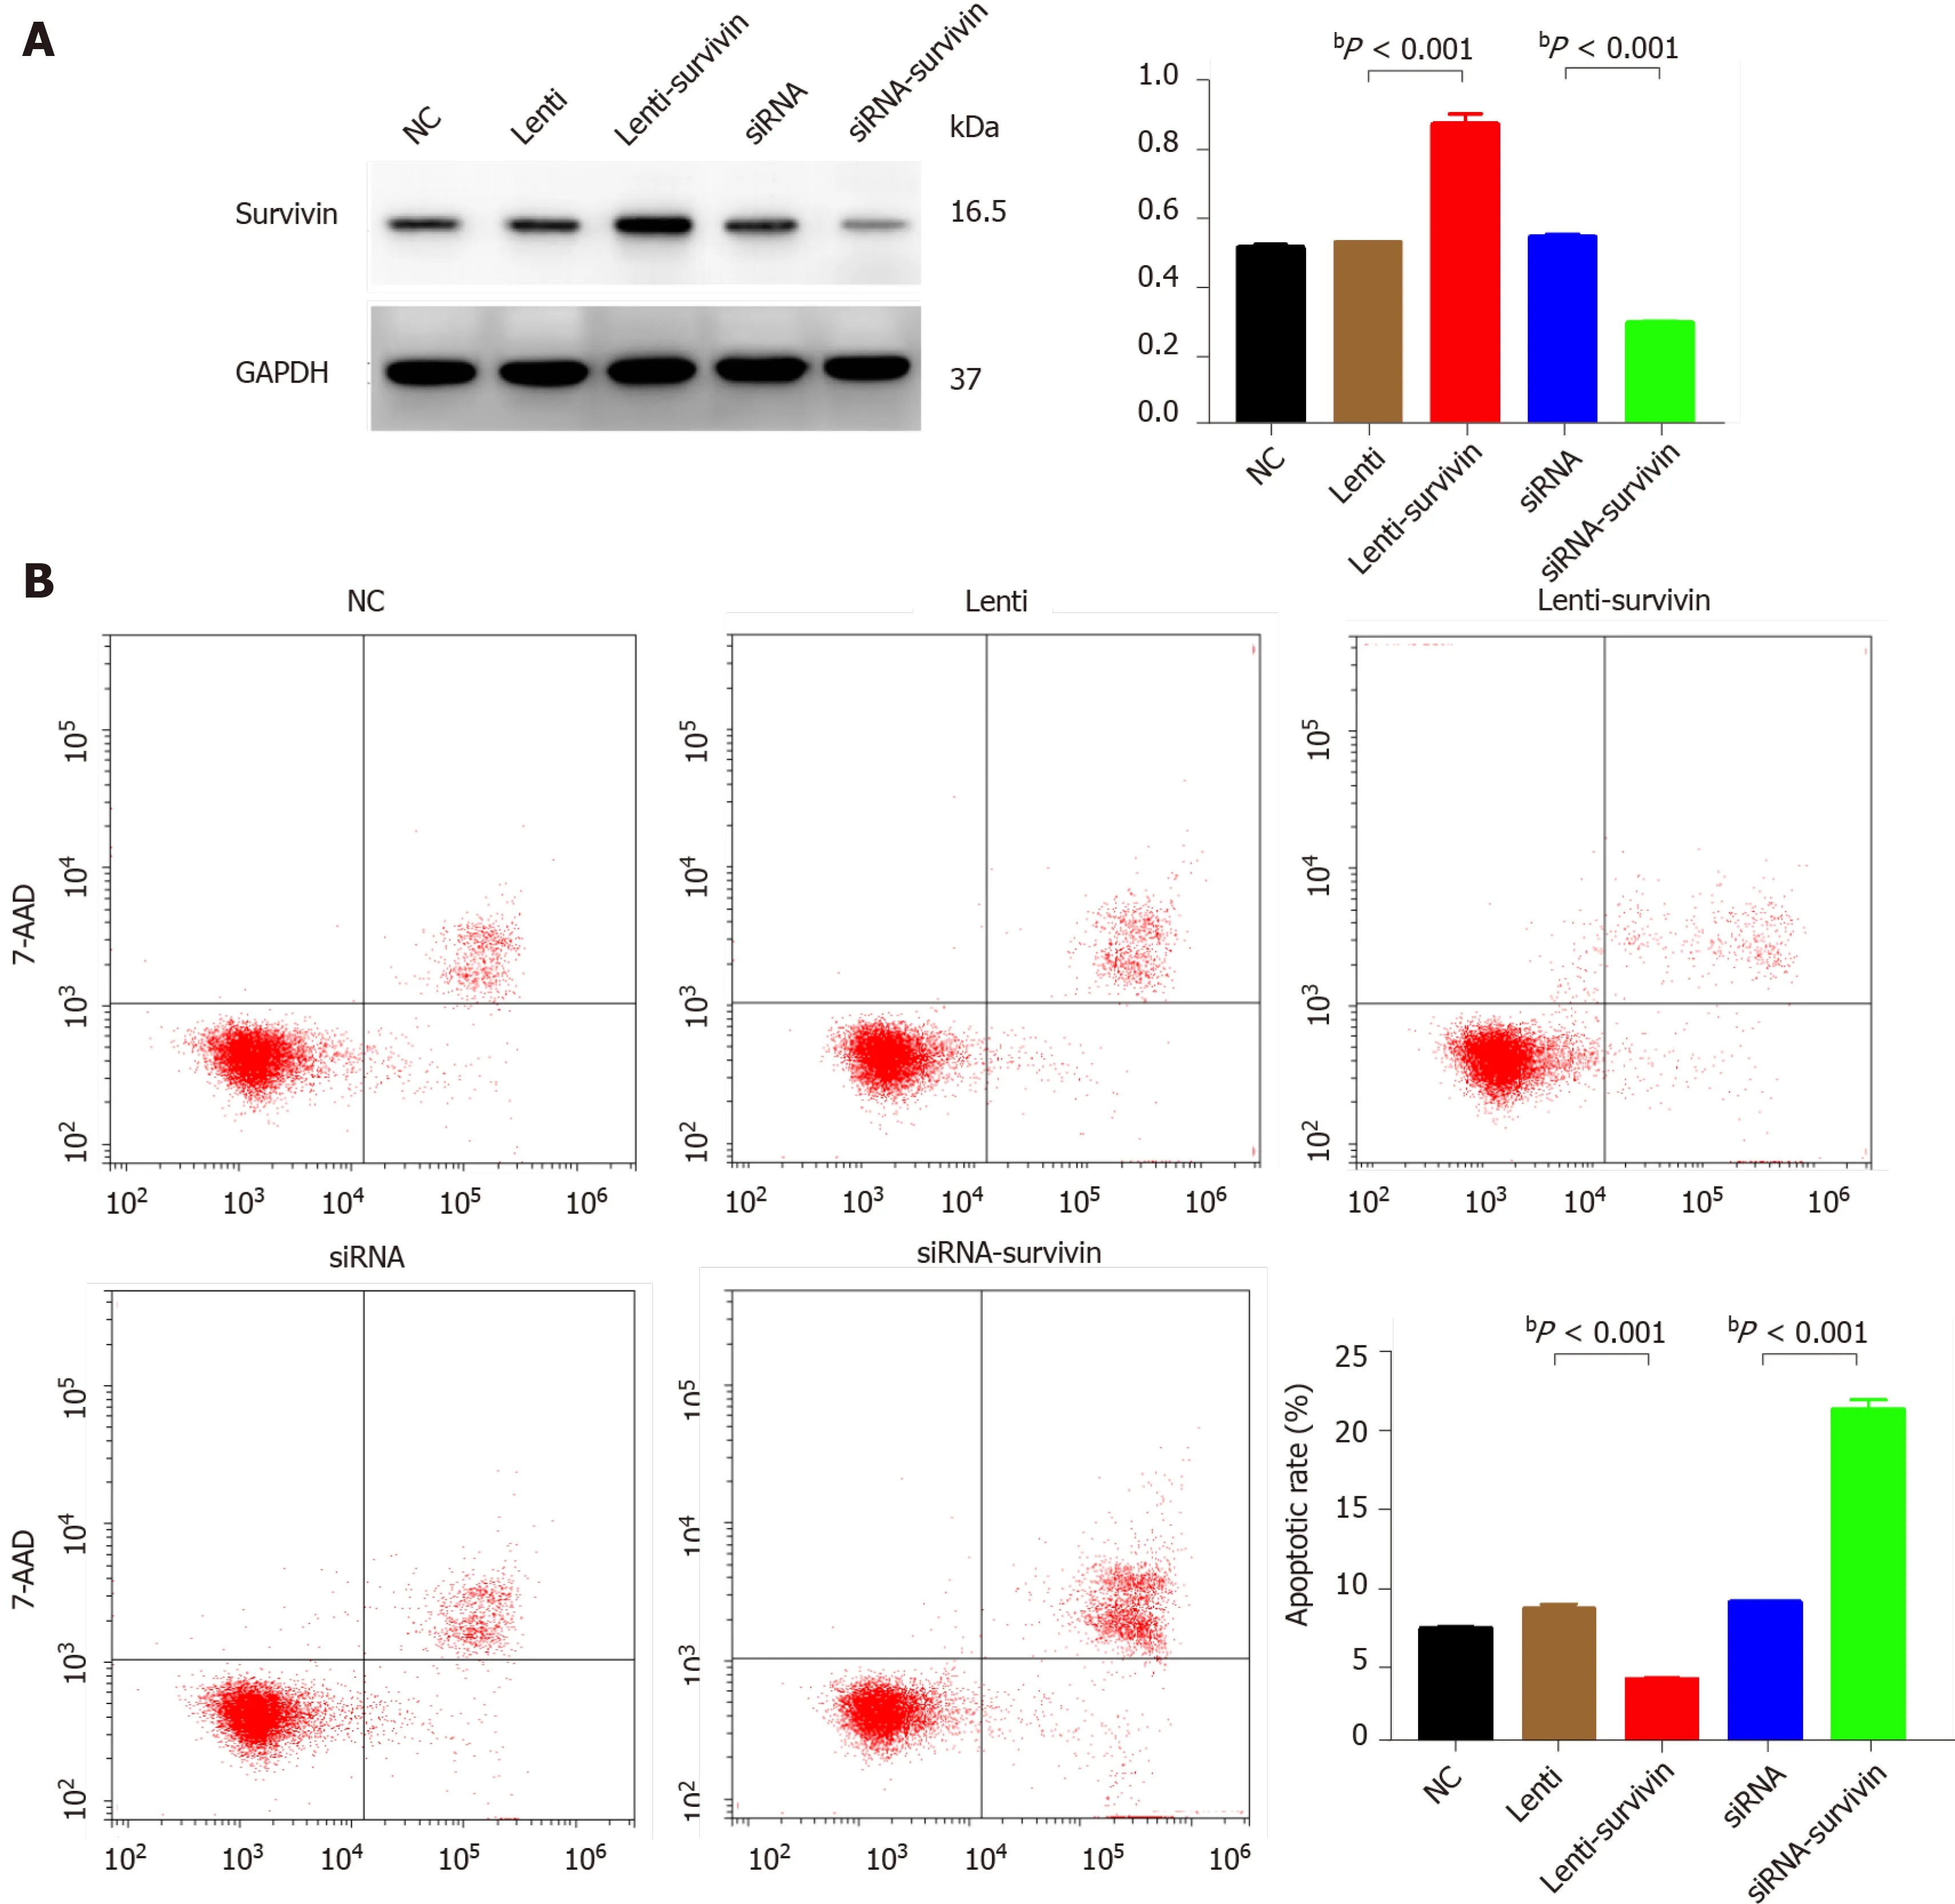
Figure 4 Effect of survivin silencing and overexpression on apoptosis ability of HepG2 cells. A: Western blot analysis confirming survivin protein knockdown and upregulation in the selected clones (siRNA, siRNA-survivin, Lenti, and Lenti-survivin) and controls; B: Cell apoptosis was detected by flow cytometric analysis (n = 3 ). The apoptosis rate was significantly lower in the survivin-overexpressing cells (bP < 0 .01 ).
Survivin expression in CTC subtypes
Survivin expression was detected in all CTC-positive patients (Figure 7 ), but the level of expression (based on the intensity of the purple fluorescent signal) differed between epithelial, mesenchymal, and hybrid CTCs, although not significantly: Survivin expression was observed in 62 .7 % of mCTCs, 74 .61 % of hybrid CTCs, and 73 .53 % of epithelial CTCs. However, the signal intensities were significantly different: Moderateand high-intensity signals were observed in 48 .53 % and 31 .91 % of mCTCs,respectively, and in 47 .65 % and 16 .5 % of hybrid CTCs, respectively. The proportion of mesenchymal and hybrid CTCs with moderate- and high-intensity signals was significantly higher than that of epithelial CTCs (P< 0 .001 ) (Figure 7 A and B). In contrast, a significantly greater proportion of epithelial CTCs tended to have low signal intensity for survivin expression: 72 .47 % of epithelial CTCs vs 33 .85 % and 35 .83 % of hybrid and mCTCs, respectively (Figure 7 A and B).
Dynamic changes in survivin-positive CTC count following surgery and its prognostic significance
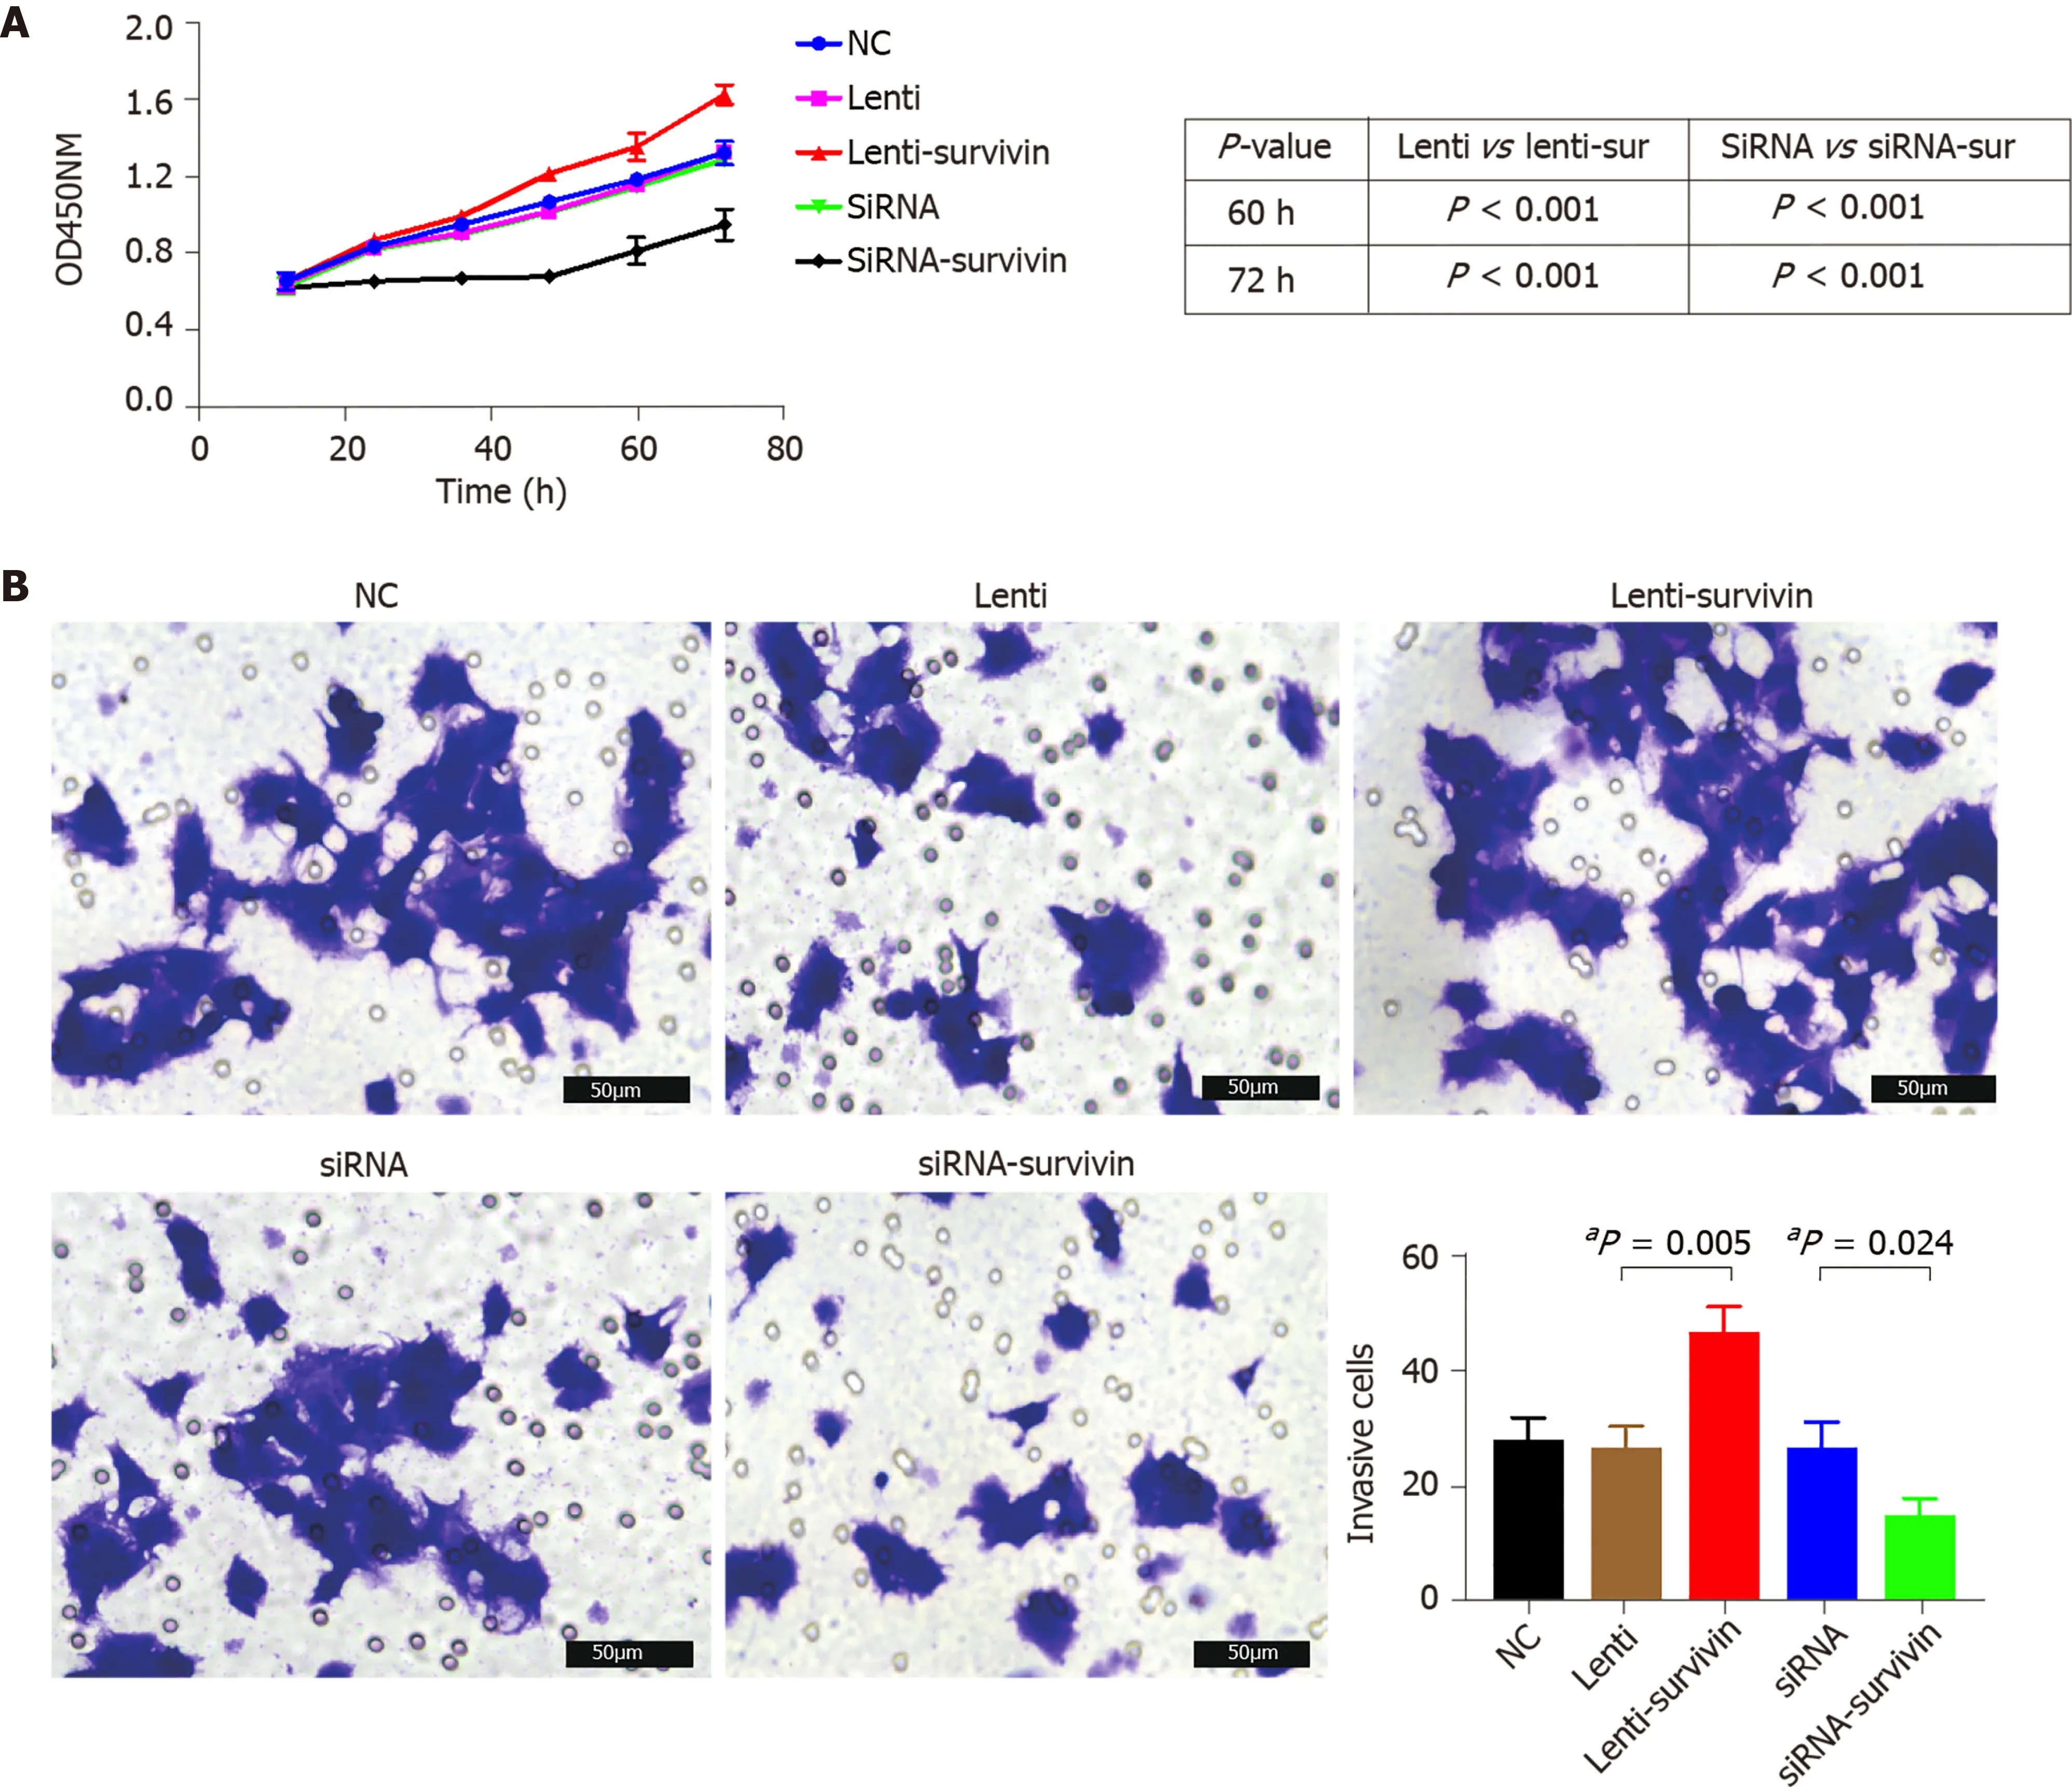
Figure 5 Effect of survivin silencing and overexpression on proliferation and invasion abilities of HepG2 cells. A: Cell proliferation was evaluated at 12 h, 24 h, 48 h, 60 h, and 72 h after transfection with the siRNA or lentivirus using the CCK8 assay (n = 5 ), and it was significantly higher in the survivinoverexpressing cells (aP < 0 .05 ); B: Invasion ability of cells was examined by transwell assay (n = 3 ). The invasive cell count was significantly higher in the survivinoverexpressing cells (aP < 0 .05 ).
The survivin-positive CTC counts were detected in 22 patients at 1 wk following surgical resection. The total CTC count exhibited a considerable decrease after resection, as did the survivin-positive CTC and mCTC counts (Figure 8 A-C). During the postoperative period, in 10 out of 22 HCC patients, the total CTC, mCTC, and survivin-positive CTC counts had increased over the thresholds (12 for CTCs, 4 for mCTCs and sur-CTCs) at 86 d before imaging recurrence or metastatic lesions were detected, while no increase was noted in the other 12 patients for more than 1 year(Figure 8 D). Additionally, log-rank test revealed that the recurrence free survival rate was significantly associated with survivin-positive CTC count (Figure 9 A). In all 10 cases, over 4 survivin-positive CTCs were detected before recurrence (Figure 9 B).
In two HCC patients, initial overexpression of survivin was observed in CTCs(counts/5 mL), while recurrence or metastasis (Figure 10 A and B) was observed 4 -5 mo after therapy in patients who were in the same BCLC stage before treatment. And increased surviving-positive CTC count is showed in Figure 10 C.
DISCUSSION
In the present study, we analyzed the correlation between survivin-positive CTC expression patterns and the prognosis of HCC, in order to explore the potential of survivin-positive CTCs as markers for HCC stage and predictors of HCC metastasis.The prognostic value of survivin-positive CTCs in patients after surgical resection was also demonstrated.
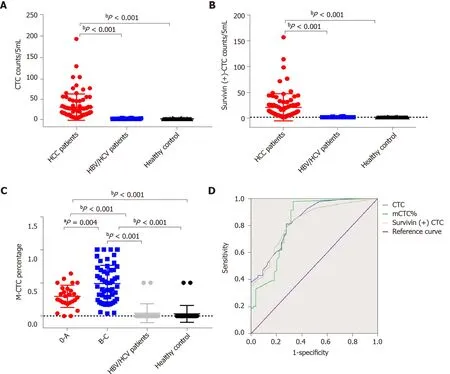
Figure 6 Total circulating tumor cell count and survivin-positive circulating tumor cell count in the study cohort. A and B: Both the median circulating tumor cell (CTC) count (A) and survivin-positive CTC count (B) in hepatocellular cancer (HCC) patients were significantly higher than those in the HBV/HCV patients and healthy controls; C: The proportion of mesenchymal CTCs (mCTCs) in HCC at the advanced BCLC stage (B-C) was significantly higher than that in HCC at the early stage (0 -A); D: ROC curves for survivin-positive CTC count, total CTC count, and mCTC proportion. The rational cut-off for diagnosis was 12 for the CTC count, 4 for the survivin-positive CTC count, and 1 .85 % for the mCTC proportion. aP < 0 .05 ; bP < 0 .01 . CTC: Circulating tumor cell.
Ourin vitroexperiments with HepG2 cells showed that siRNA-induced silencing of survivin expression resulted in a significant decrease in the proliferation and invasive ability of these cells, and a significant increase in their apoptosis rate; opposite results were obtained with overexpression of survivin. In agreement with this finding,previous studies have confirmed that survivin deficiency induces apoptosis in HepG2 cells[20 ,21]. These findings together indicate that survivin promotes the metastasis of HCC, and they are in agreement with a previous study which showed that knockdown of survivin expression suppressed HCC metastasis[22].
In our study, 94 .41 % of CTCs obtained from the HCC patients were positive for survivin expression. Further, we examined the survivin expression pattern in different phenotypes of CTCs, including mCTCs, hybrid CTCs, and epithelial CTCs. The findings showed that survivin expression was much higher in mesenchymal and hybrid CTCs than in epithelial CTCs, and a major proportion (62 .7 %) of mCTCs were positive for survivin expression. These findings indicate that survivin plays an important role in promoting EMT in HCC cells. During the process of carcinogenesis,tumor cells gain invasive ability by undergoing EMT, which occursviadownregulation of the epithelial cell marker E-cadherin (among others) and upregulation of the mesenchymal cell markers vimentin and N-cadherin (among others)[23]. Accordingly,it has also been reported that survivin mediates EMT in HCC cellsviamodulation of EMT marker expression[24]. Thus, based on these findings, it appears that survivin promotes metastasis of HCC through mediation of EMT events.
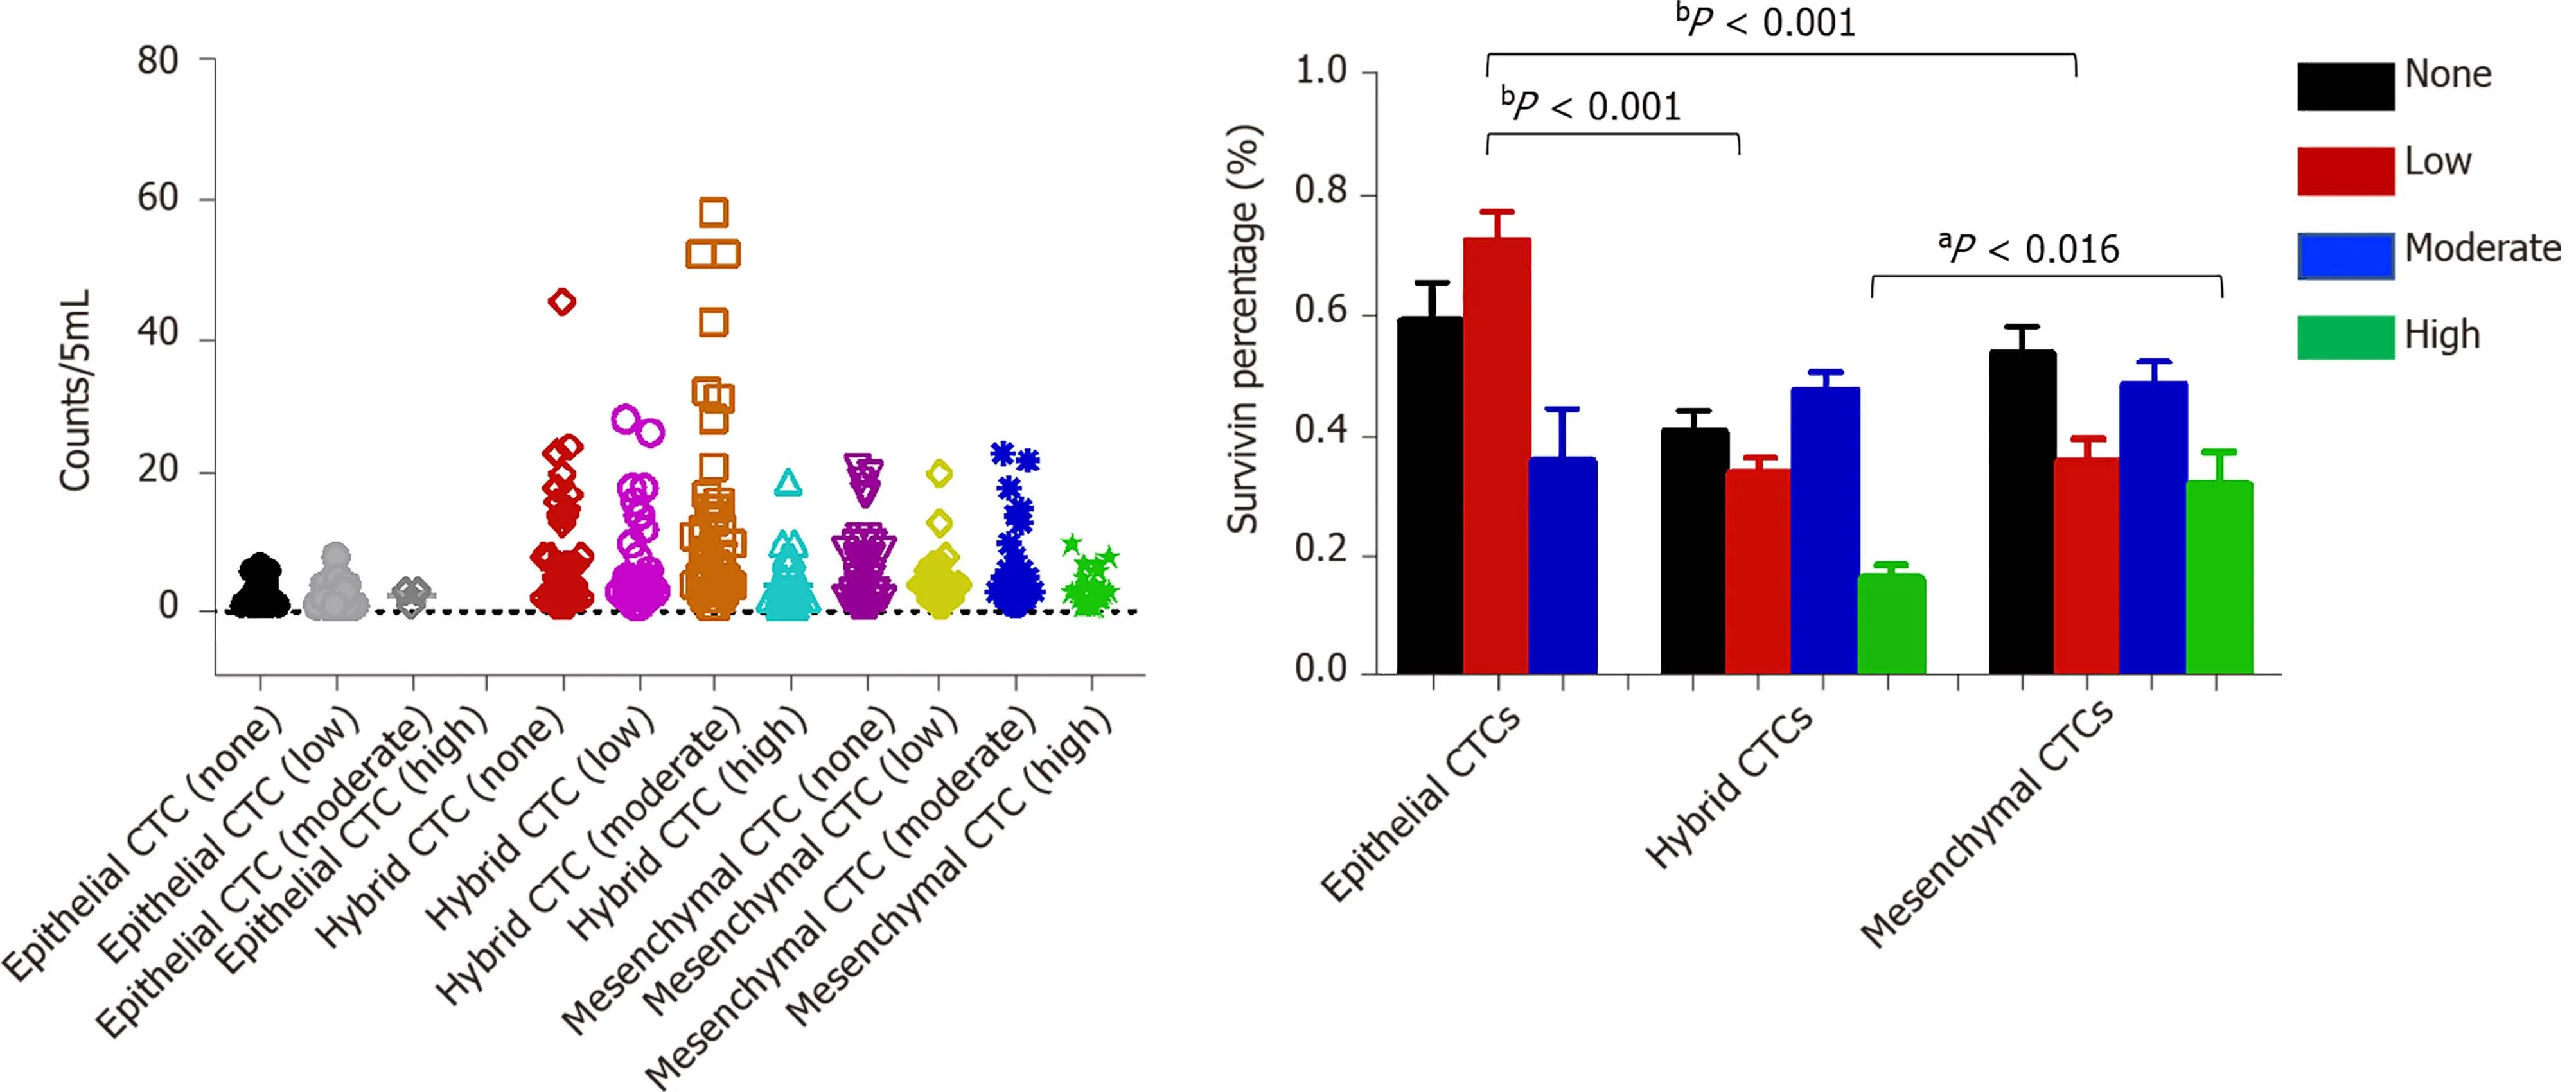
Figure 7 Analysis of survivin gene expression patterns in epithelial, mixed, and mesenchymal circulating tumor cells. A significantly lower percentage of epithelial circulating tumor cells (CTCs) showed moderate staining intensity than mixed and mesenchymal CTCs (mCTCs), while a significantly higher percentage of epithelial CTCs showed low staining intensity than hybrid and mCTCs. aP < 0 .05 ; bP < 0 .01 . CTC: Circulating tumor cell.
Our findings showed that survivin was expressed at significantly greater levels in HCC tissue than in normal liver tissue, and the expression levels were significantly associated with the degree of tumor differentiation, that is, poorly differentiated tumors had significantly higher survivin expression. We also found that survivin expression level was significantly greater in HCC tissue than in normal tissue. The high frequency of cytoplasmic survivin expression in HCC observed in our study is in agreement with that reported in previous studies[24 ,25]. Many studies have demonstrated that survivin plays a crucial role in the early and late stage of carcinogenesis[26]. In agreement with our findings, otherin vitrostudies have reported increased expression of survivin in tumor cells[27 ,28]. Based on these findings, we assumed that survivin plays an anti-apoptotic role and aids in the progression of HCC.Hence, HCC patients who are positive for survivin should be monitored carefully, and enhanced adjuvant therapy should be considered to help improve their prognosis[29 ,30]. It is not easy to obtain HCC tissue samples at every follow-up appointment;therefore, detection of survivin in CTCs may be a useful supplementary method.
CONCLUSION
Previous studies have mostly investigated the expression of survivin in cancer cells or tissue specimens from patients[25 ,31 ,32], but the strength of our study lies in its investigation of survivin expression in different subtypes of CTCs. This is the first study to have pursued this line of investigation. We found that the survivin-positive CTC counts are significantly associated with the TNM tumor stage, BCLC stage, and degree of differentiation. Thus, the survivin-positive CTC count may particularly be important as an indicator of tumor stage and cancer progression. Additionally, the proportion of mCTCs also increases with tumor progression, but the mCTC counts are not significantly different between the different tumor grades and AFP. This variable needs to be explored further in future studies for its potential as a tumor stage marker.
One of the limitations of this study is the small sample size. Future investigations on survivin-positive CTCs should use a larger sample. Additionally, because of the limited follow-up time, the relationship between survivin-positive CTC counts and overall survival could not be explored. Therefore, an analysis with a longer follow-up duration would be highly useful.
Thus, the present findings indicate that the survivin-positive CTC count might have potential as an indicator for disease stage and a predictor of recurrence in HCC patients. Thus, an efficient and reliable technique to measure survivin expression in CTCs from liver cancer patients could prove useful for predicting the prognosis and recurrence of this cancer, and this could help clinicians select an optimal and customized management strategy for the treatment of this malignancy.
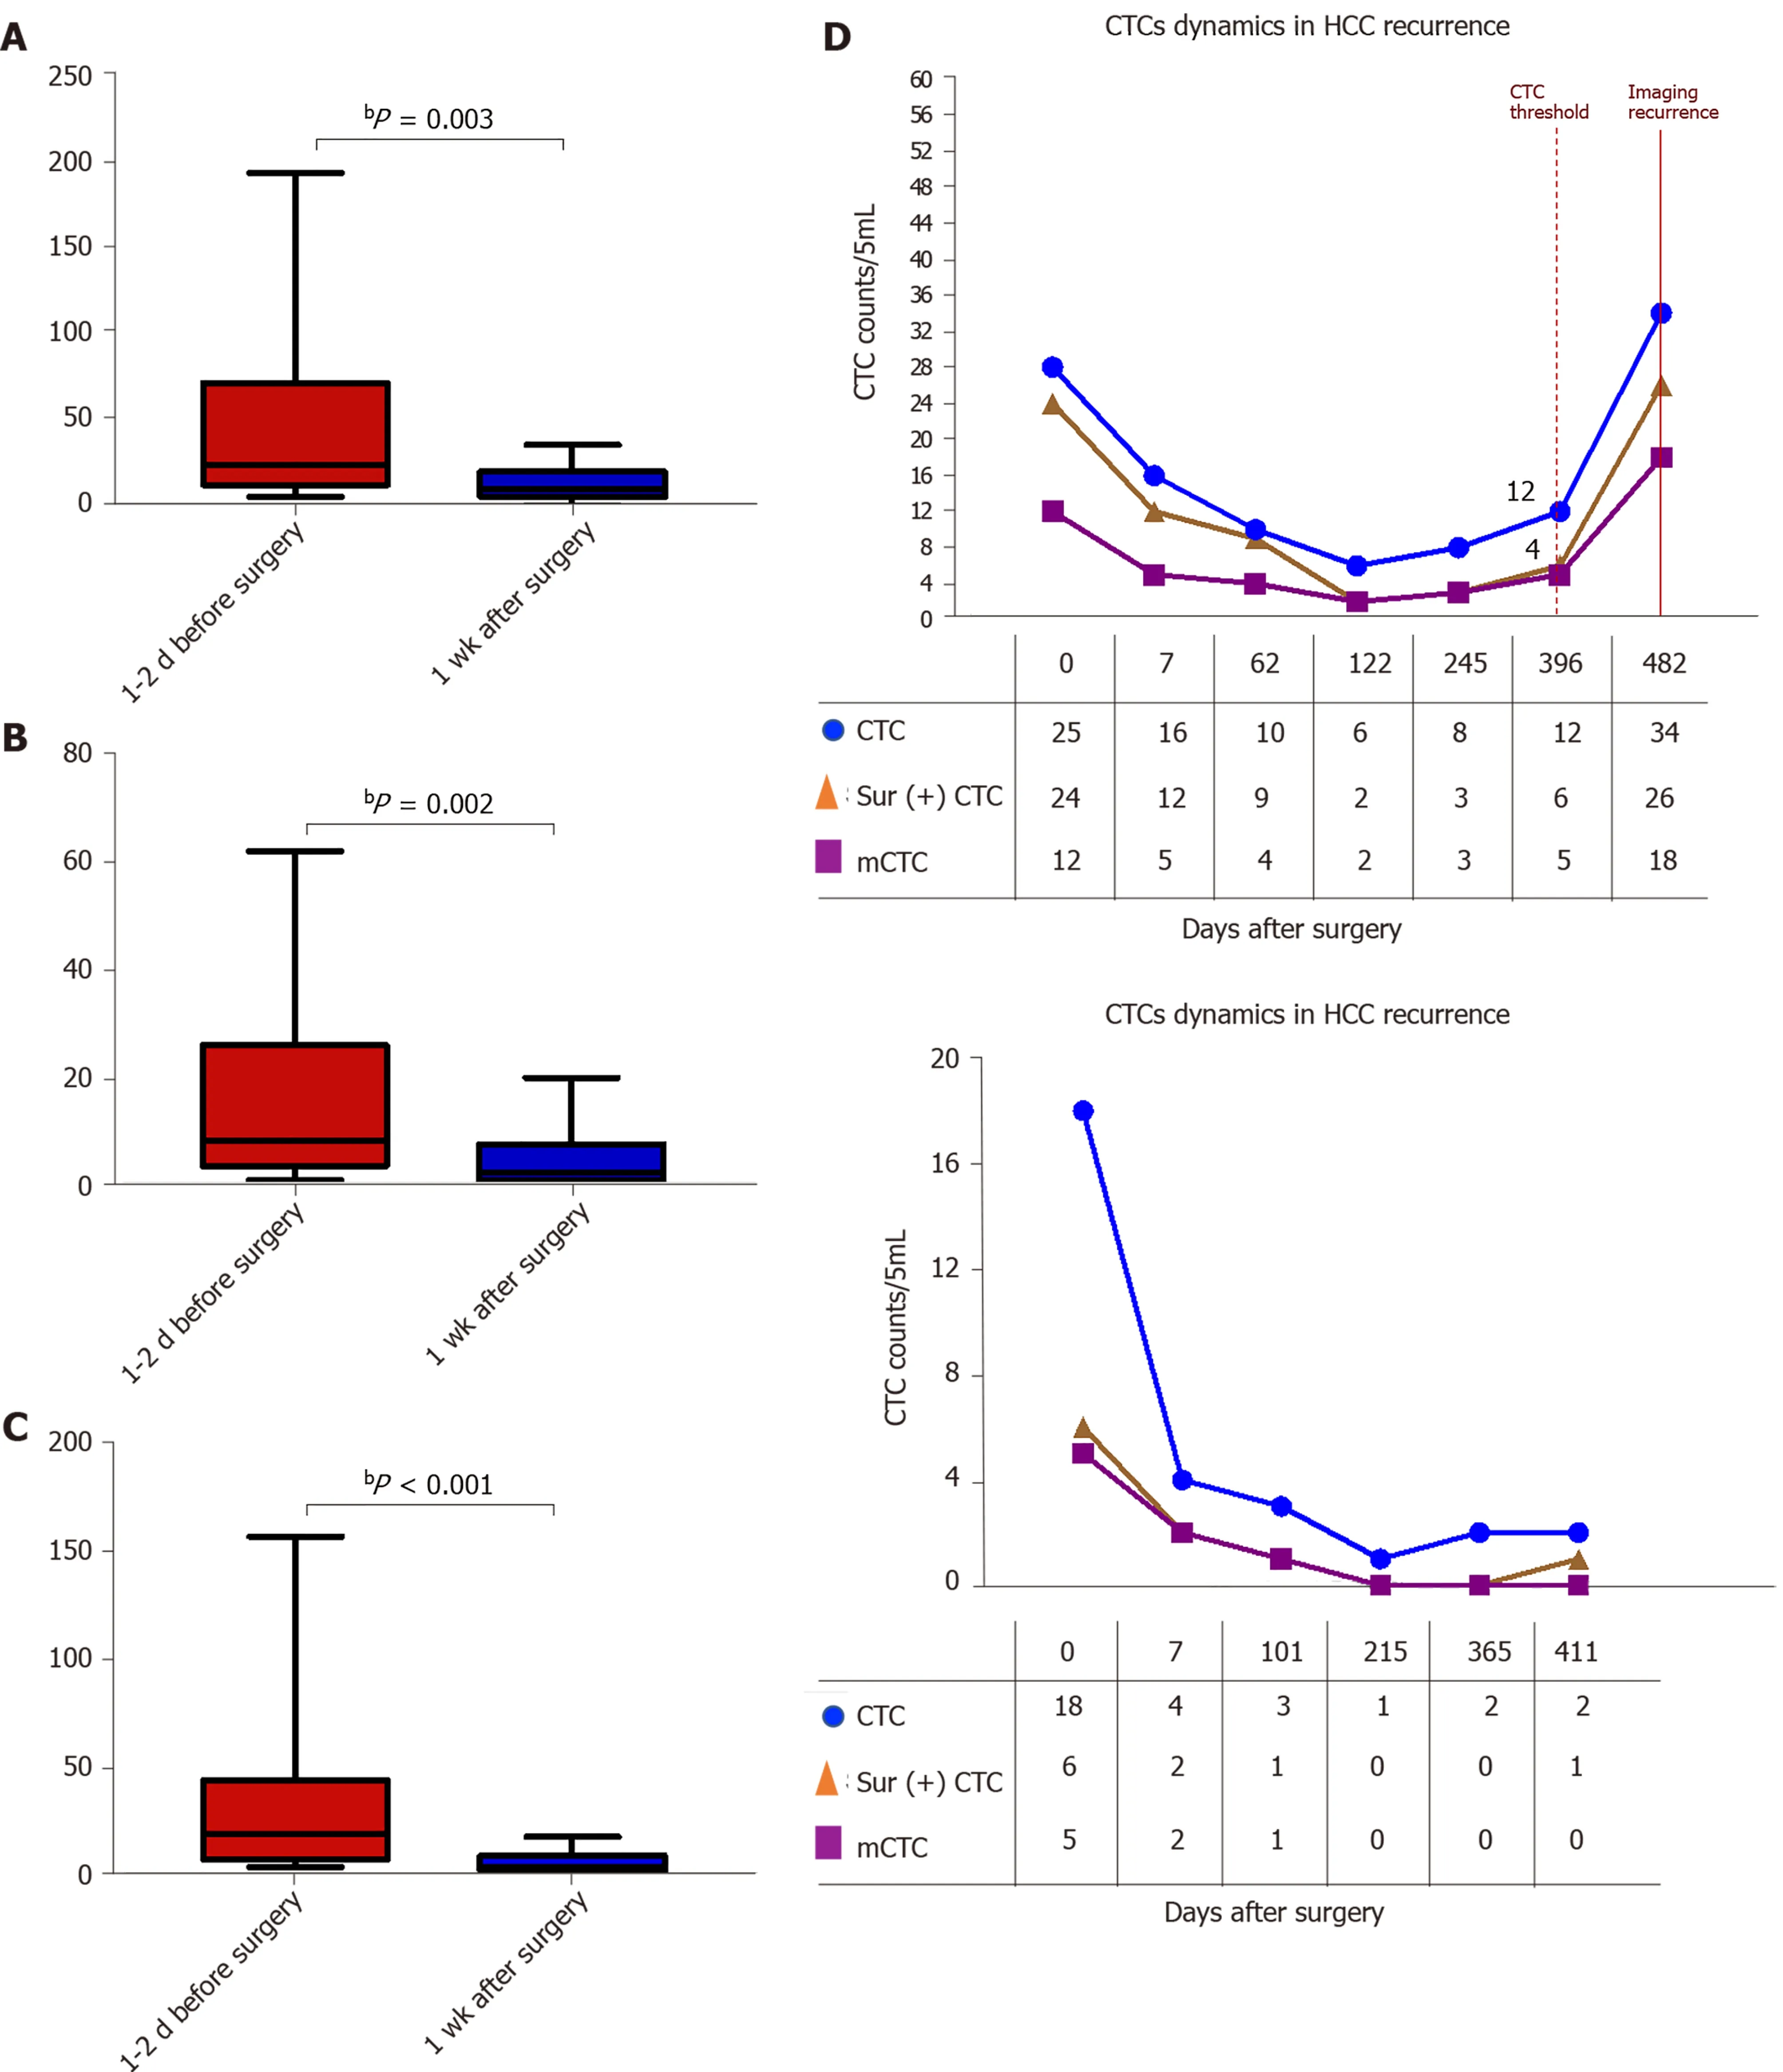
Figure 8 Dynamic changes in circulating tumor cell, mesenchymal circulating tumor cell, and survivin-positive circulating tumor cell counts following surgery. A-C: The total circulating tumor cell (CTC) count, mesenchymal CTC proportion, and survivin-positive CTC count decreased dramatically 1 wk after resection. D: Increased survivin-positive CTC count in postoperative hepatocellular cancer patients (n = 10 ) at 1 -12 mo before detectable recurrence or appearance of metastatic lesions, and decreased surviving-positive CTC count in the last 12 hepatocellular cancer patients with no recurrence. bP <0 .01 . CTC: Circulating tumor cell.
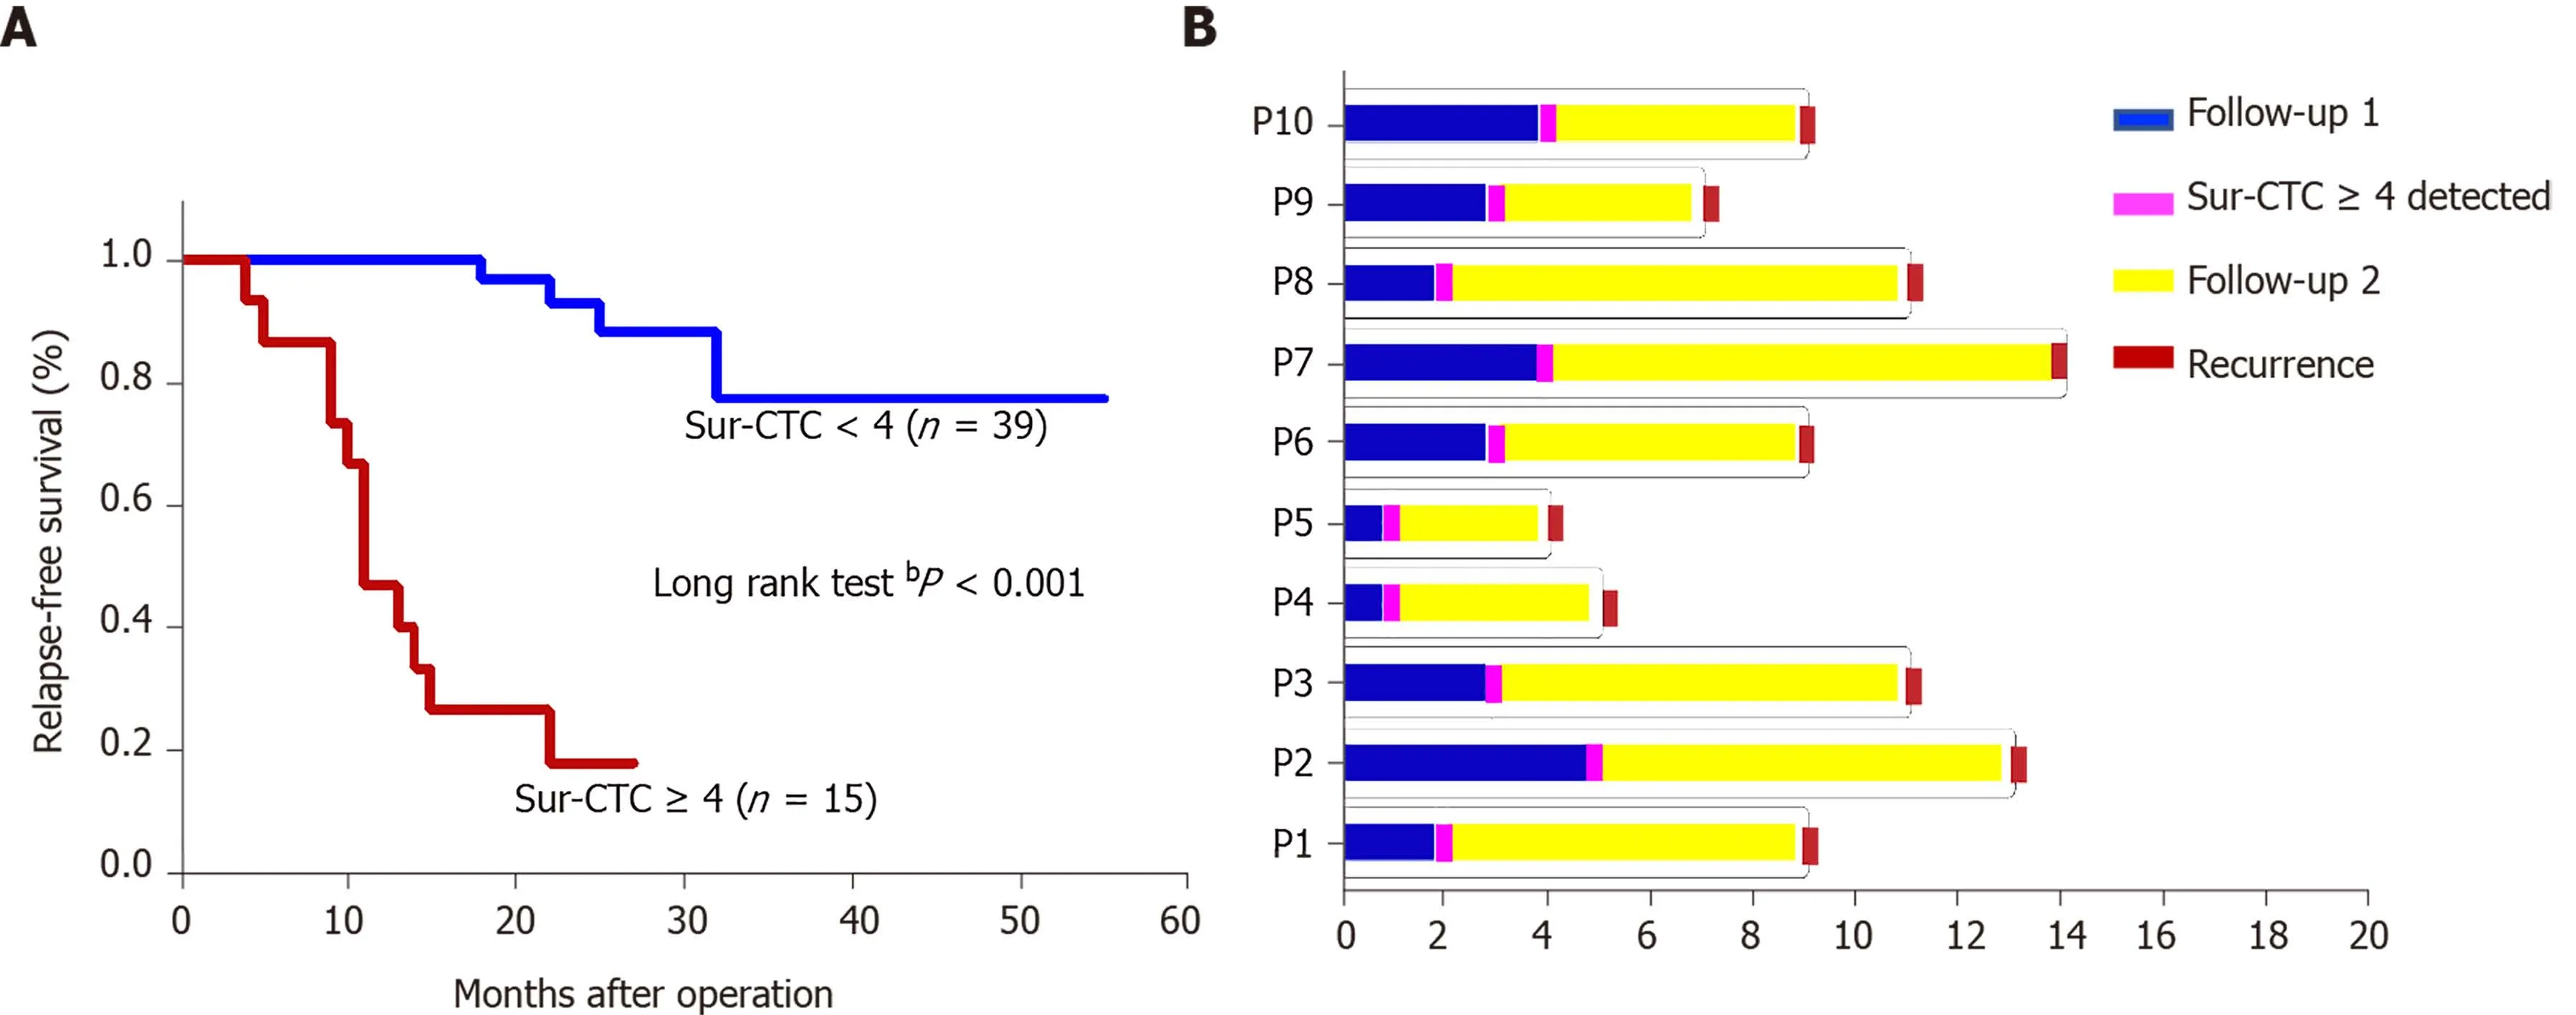
Figure 9 Prognosis of hepatocellular cancer patients with different survivin-positive circulating tumor cell counts. A: Recurrence free survival time after surgery by change in survivin-positive circulating tumor cell (CTC) count; B: The survivin-positive CTCs detected during follow-up of 10 hepatocellular cancer patients after operation predict tumor recurrence. bP < 0 .01 . CTC: Circulating tumor cell.
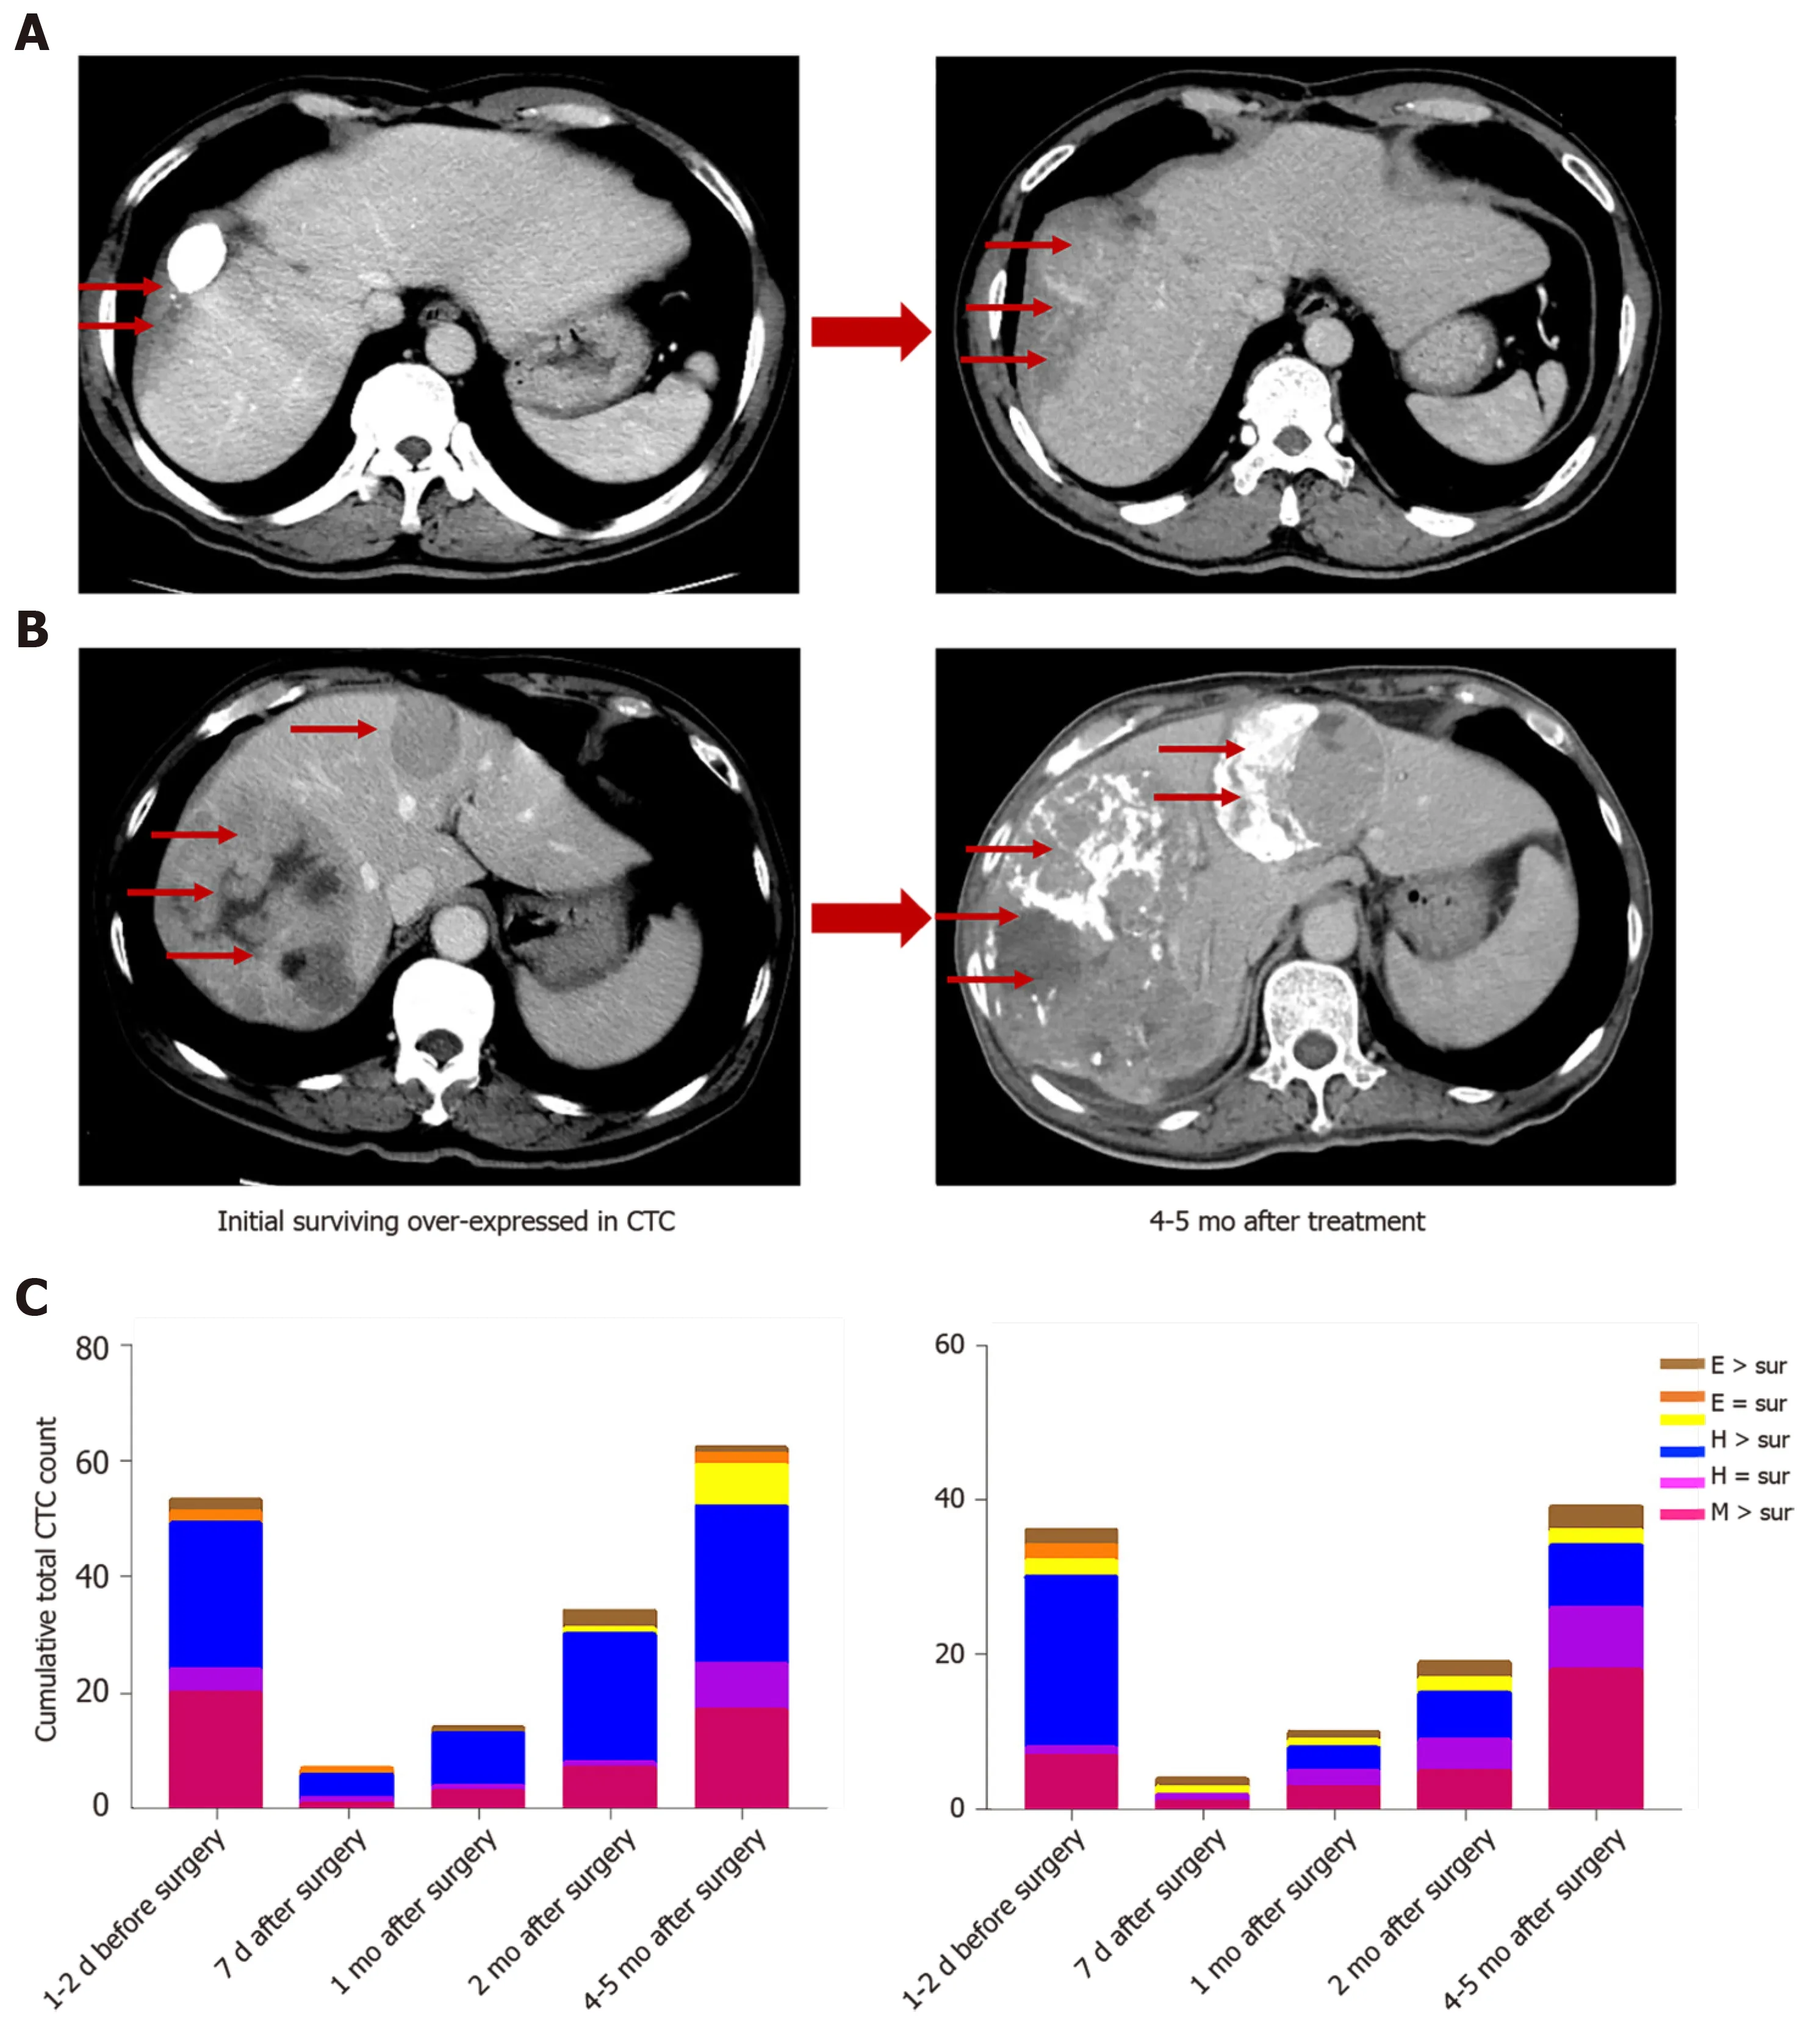
Figure 10 Survivin-positive circulating tumor cells detected during follow-up predict recurrence (m). A and B: Images of two hepatocellular cancer (HCC) patients at the same BCLC stage who expressed survivin in circulating tumor cells (CTCs). At 4 and 5 mo after treatment, the HCC tumors showed more rapid progression in patients with higher survivin expression in CTCs at baseline; C: Cumulative total CTC count by three cell types and survivin-positive CTC count in the two patients before and after operation. The patients’ CTC and survivin-positive CTC count increased at the 2 -mo follow-up. Letter E represents epithelial CTCs; Letter H represents hybrid CTCs; Letter M represents mesenchymal CTCs. CTC: Circulating tumor cell.
ARTICLE HIGHLIGHTS

 World Journal of Gastroenterology2021年43期
- World Journal of Gastroenterology的其它文章
- Minimum sample size estimates for trials in inflammatory bowel disease: A systematic review of a support resource
- Immunoglobulin G in non-alcoholic steatohepatitis predicts clinical outcome: A prospective multi-centre cohort study
- Genome-wide map of N6 -methyladenosine circular RNAs identified in mice model of severe acute pancreatitis
- Liver injury changes the biological characters of serum small extracellular vesicles and reprograms hepatic macrophages in mice
- Hepatitis B: Who should be treated?-managing patients with chronic hepatitis B during the immunetolerant and immunoactive phases
- Recent advances in artificial intelligence for pancreatic ductal adenocarcinoma