
Minimum sample size estimates for trials in inflammatory bowel disease: A systematic review of a support resource
2021-12-03 06:15:54MorrisGordonSvetlanaLakuninaVasilikiSinopoulouAnthonyAkobeng
World Journal of Gastroenterology 2021年43期
Morris Gordon, Svetlana a Lakunina, Vasiliki Sinopoulou, Anthony Akobeng
Abstract
Key Words: Inflammatory bowel disease; Crohn’s disease; Ulcerative colitis; Gastroenterology; Statistics; Sample size
INTRODUCTION
Sample size estimation (SSE) is an extremely important calculation for designing a clinical trial. Failure to produce an appropriate calculation may lead to imprecise results[1]. If a sample size is too large, statistically significant outcomes may be theoretically detected that may not be clinically relevant (type 1 error). This, however,is rarely a concern as studies are rarely overpowered to balance the study power with the cost. On the other hand, if a sample size is too small then a clinically significant outcome may not be detected statistically (type 2 error)[2 ,3]. The reporting of SSE in randomised controlled trials (RCTs) is a standard requirement according to the consolidated standards of reporting trials (CONSORT) statement which was introduced as a guide to conducting RCTs in 1996 [4].
In a previous systematic review[5], we showed that 25 % of RCTs on interventions for inflammatory bowel disease (IBD) have no power calculation (PC). A third of those who report PC do not achieve their target sample size. Based on those results, we decided to conduct a further systematic review.
We set out to systematically review RCTs on interventions for the IBD management,extract the vital parameters needed for sample size calculations, and synthesise the data to demonstrate whether trials across the field are adequately powered. We also set out to use the actual clinical data across these comparisons to synthesise data for minimum sample sizes that would achieve appropriate power to support future researchers designing trials and performing SSEs.
MATERIALS AND METHODS
This review was performed in alignment with Cochrane guidelines[6] in April 2020 and reported in line with the Preferred Reporting Items for Systematic Reviews and Meta-analyses statement[7].
Eligibility criteria
We followed the sampling methodology described within our systematic review protocol (uploaded within our institutional repository)[8] used for our previous review of the reporting of sample size calculations[5].
In brief, we included RCTs investigating either induction or maintenance therapy with biologics, immunomodulators, and microbiome against control, placebo, or no intervention. We conducted a comprehensive search of the Cochrane IBD Specialized Trials Register, CENTRAL, Cochrane library of IBD reviews for primary RCTs. The search terms are presented in Supplementary material.
We included RCTs published since 1996 (after the publication of the CONSORT statement). We excluded reports lacking clear information on the number of participants; cluster RCTs; pilot or feasibility studies; studies with mixed population of people with and without IBD; studies on secondary analyses of follow-up data collection after discontinuation of treatment. We excluded abstracts as these rarely allow space for such information to be presented. As we wanted to assess the established evidence for a PC of treatment for the IBD, we excluded RCTs describing all interventions where work may be at phase 3 (pharmacological:e.g.ustekinumab,golimumab, tofacitinib) or not under the three core headings (biologic, immunomodulators or anti-inflammatories).
Complying to the above search strategy, two authors (SL and MG) identified RCTs titles that appeared to be applicable. These were independently screened and in cases of disagreement, a third review author (VS) was involved to reach consensus. Two review authors independently extracted and recorded data on a predefined checklist.When disagreements occurred, a third review author was involved, and the consensus was reached.
We created an excel document to extract data regarding the trials. Firstly, we separated the studies into 8 categories [Crohn’s disease (CD)-clinical relapse, clinical remission, endoscopic relapse, endoscopic remission; ulcerative colitis (UC)-clinical relapse, clinical remission, endoscopic relapse, endoscopic remission]. Secondly, we grouped the studies according to the intervention used. One author extracted the data,and in case of any problems, the data was checked by the second author.
The extracted data although is not available publicly can be obtainedviadirect contact with authors. The references of the included stuidies can be found in Supplementary material.
Extracted data included
(1 ) Number of events and participants originally assigned to each group; (2 ) Characteristics of participants; (3 ) The proportion that we calculated according to the number of events and participants (x = n/N), in which n is a number of events and N is a number of participants); (4 ) The difference achieved that we calculated according to the proportions of two groups (proportion 1 -proportion 2 ); (5 ) Intervention and control details; (6 ) Presence of SSE and calculation details [minimal clinically important difference (MCID) used for PC, power, significance level, target sample size]; and (7 )Outcomes (the number of patients recruited and completing study; the number of treatment success/failures; and the difference achieved).
We used the studies in which intervention was compared to the control or placebo.We grouped those studies according to the interventions, type of treatment (induction,maintenance), and outcomes (relapse, remission) and calculated mean difference and mean MCID where it was possible.
After resolving all the inconsistencies with data extraction regarding the use of sample size calculations for the studies with achieved difference of less than 10 %, we produced two tables (Tables 1 and 2 ). We recalculated sample size for those groups using the power of 80 %, probability of type 1 error 0 .05 , and the achieved difference.We used those parameters as they were the most commonly used amongst the studies.The parameters we used were two independent groups, dichotomous outcomes. In group 1 we have put the rate reported by the study of the intervention drug, and in group 2 we have put the rate of the placebo.
The small lest MCID that was reported by the studies was 10 %, thereby, we decided to not reproduce PC for those studies with the achieved difference of less than 10 %.We also calculated the mean sample deficit in percentage based on the target sample size and achieved sample size reported by the studies.
After receiving the sample size of participants, we made a decision whether the study is underpowered, and if yes, then by how many people.
Data synthesis
We produced descriptive statistics regarding the sample sizes for the studies grouped according to the interventions (Tables 1 and 2 ).
Ethical statement
As all data included already existed within the published scholarly output, no ethical approval was sought.
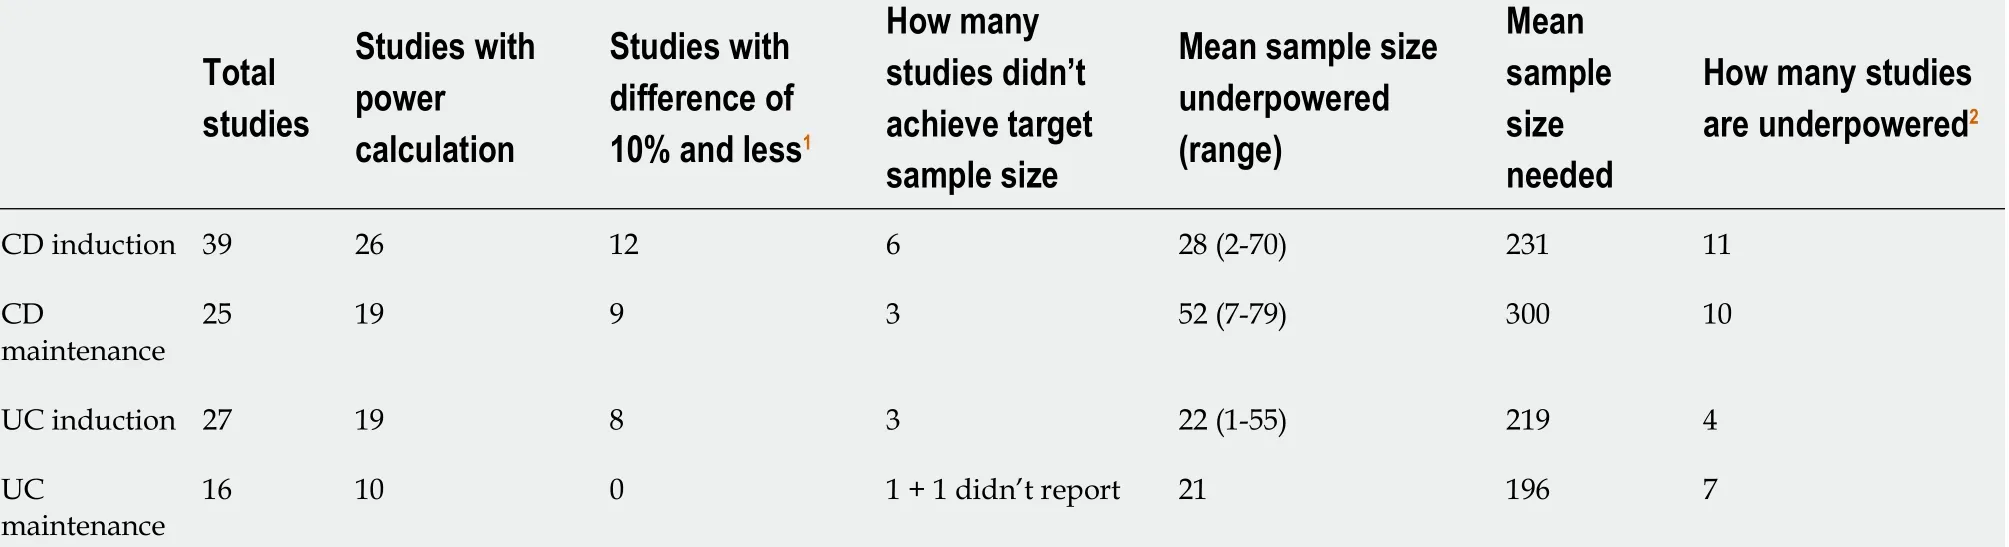
Table 1 Overall summary of power calculations and sample size deficits
RESULTS
A total of 7451 potential citations were screened and 308 full texts assessed for eligibility. There were 209 texts excluded, 106 because they were published prior to the release of the CONSORT statement and 103 because they did not match our inclusion outcome. This left a total of 99 trials included, with 60 pertaining to CD and 39 to UC.The full details are shown in Figure 1 .
The mean proportion of patients achieving clinical remission reported within the placebo groups of induction studies was 34 .34 % in CD trials and 26 .79 % for UC. For endoscopic remission, 0 % in CD and 29 .6 % for UC. The mean proportion of patients achieving clinical relapse for maintenance studies were 55 % for CD and 46 .79 % for UC. For endoscopic relapse, 78 .85 % in CD, and 28 .7 % in UC.
Within CD induction studies, 26 out of 41 (63 .4 %) reported a PC and 19 of 26 (73 .1 %)in maintenance studies. Within UC induction studies, 22 out of 31 (71 %) reported a PC and 10 of 17 (58 .8 %) in maintenance studies.
When considering the MCID that those studies reporting a PC employed for this calculation, within CD induction studies the mean difference was 33 % (range 20 %-50 %) and 27 % difference for maintenance studies (15 %-40 %). Within UC induction studies the mean was 26 % (range 19 %-40 %) and 27 % for maintenance studies (18 %-40 %). The MCIDs these studies reported rarely matched the actual differences achieved by these studies. In fact, the discrepancy between this estimated figure for the MCID used for the PC and the actual differences seen were a mean of 22 .8 % higher in CD induction studies, 13 .8 % higher in maintenance studies, 15 .7 % higher in UC induction studies, and 10 .2 % higher in maintenance studies.
These discrepancies are proportionally large and in the context of PCs are clearly substantial and led to large numbers of studies being underpowered. These are summarised in Table 1 . Study specific data with further details is available upon request.
Table 2 gives the results of our sample size calculations at the intervention specific level that employed the actual achieved clinical differences from previous studies,using the power of 80 % and the probability of type 1 error 0 .05 . This shows the minimum sample sizes that would be indicated for RCTs compared with placebo to use. Within comparisons where the mean difference was less than 10 %, no calculation has been given as this would be a very high indicative figure.
DISCUSSION
Within this review, it has been demonstrated that there is no clear basis or accepted standard for current practice for MCID estimation when producing a PC for a primary RCT within IBD. This has led to huge variations in suggested figures for recruitment.These trials present practical and logistical challenges to organisers, with potential inconvenience to patients, as well as the cost to those funding such research. Having an accurate figure for calculations is important to ensure this investment of resource is used most efficiently and effectively. It is key to note that we are not commenting atthe individual study level. It is inappropriate to look at the projected MCID and PC for a project, if calculated on a reasonable basis, to then retrospectively suggest that the findings of a lesser MCID mean it is underpowered. This not just statistically inappropriate, but methodologically flawed. However, these findings propose that the basis for such MCID estimations is at worst unclear and often can be seen as flawed.
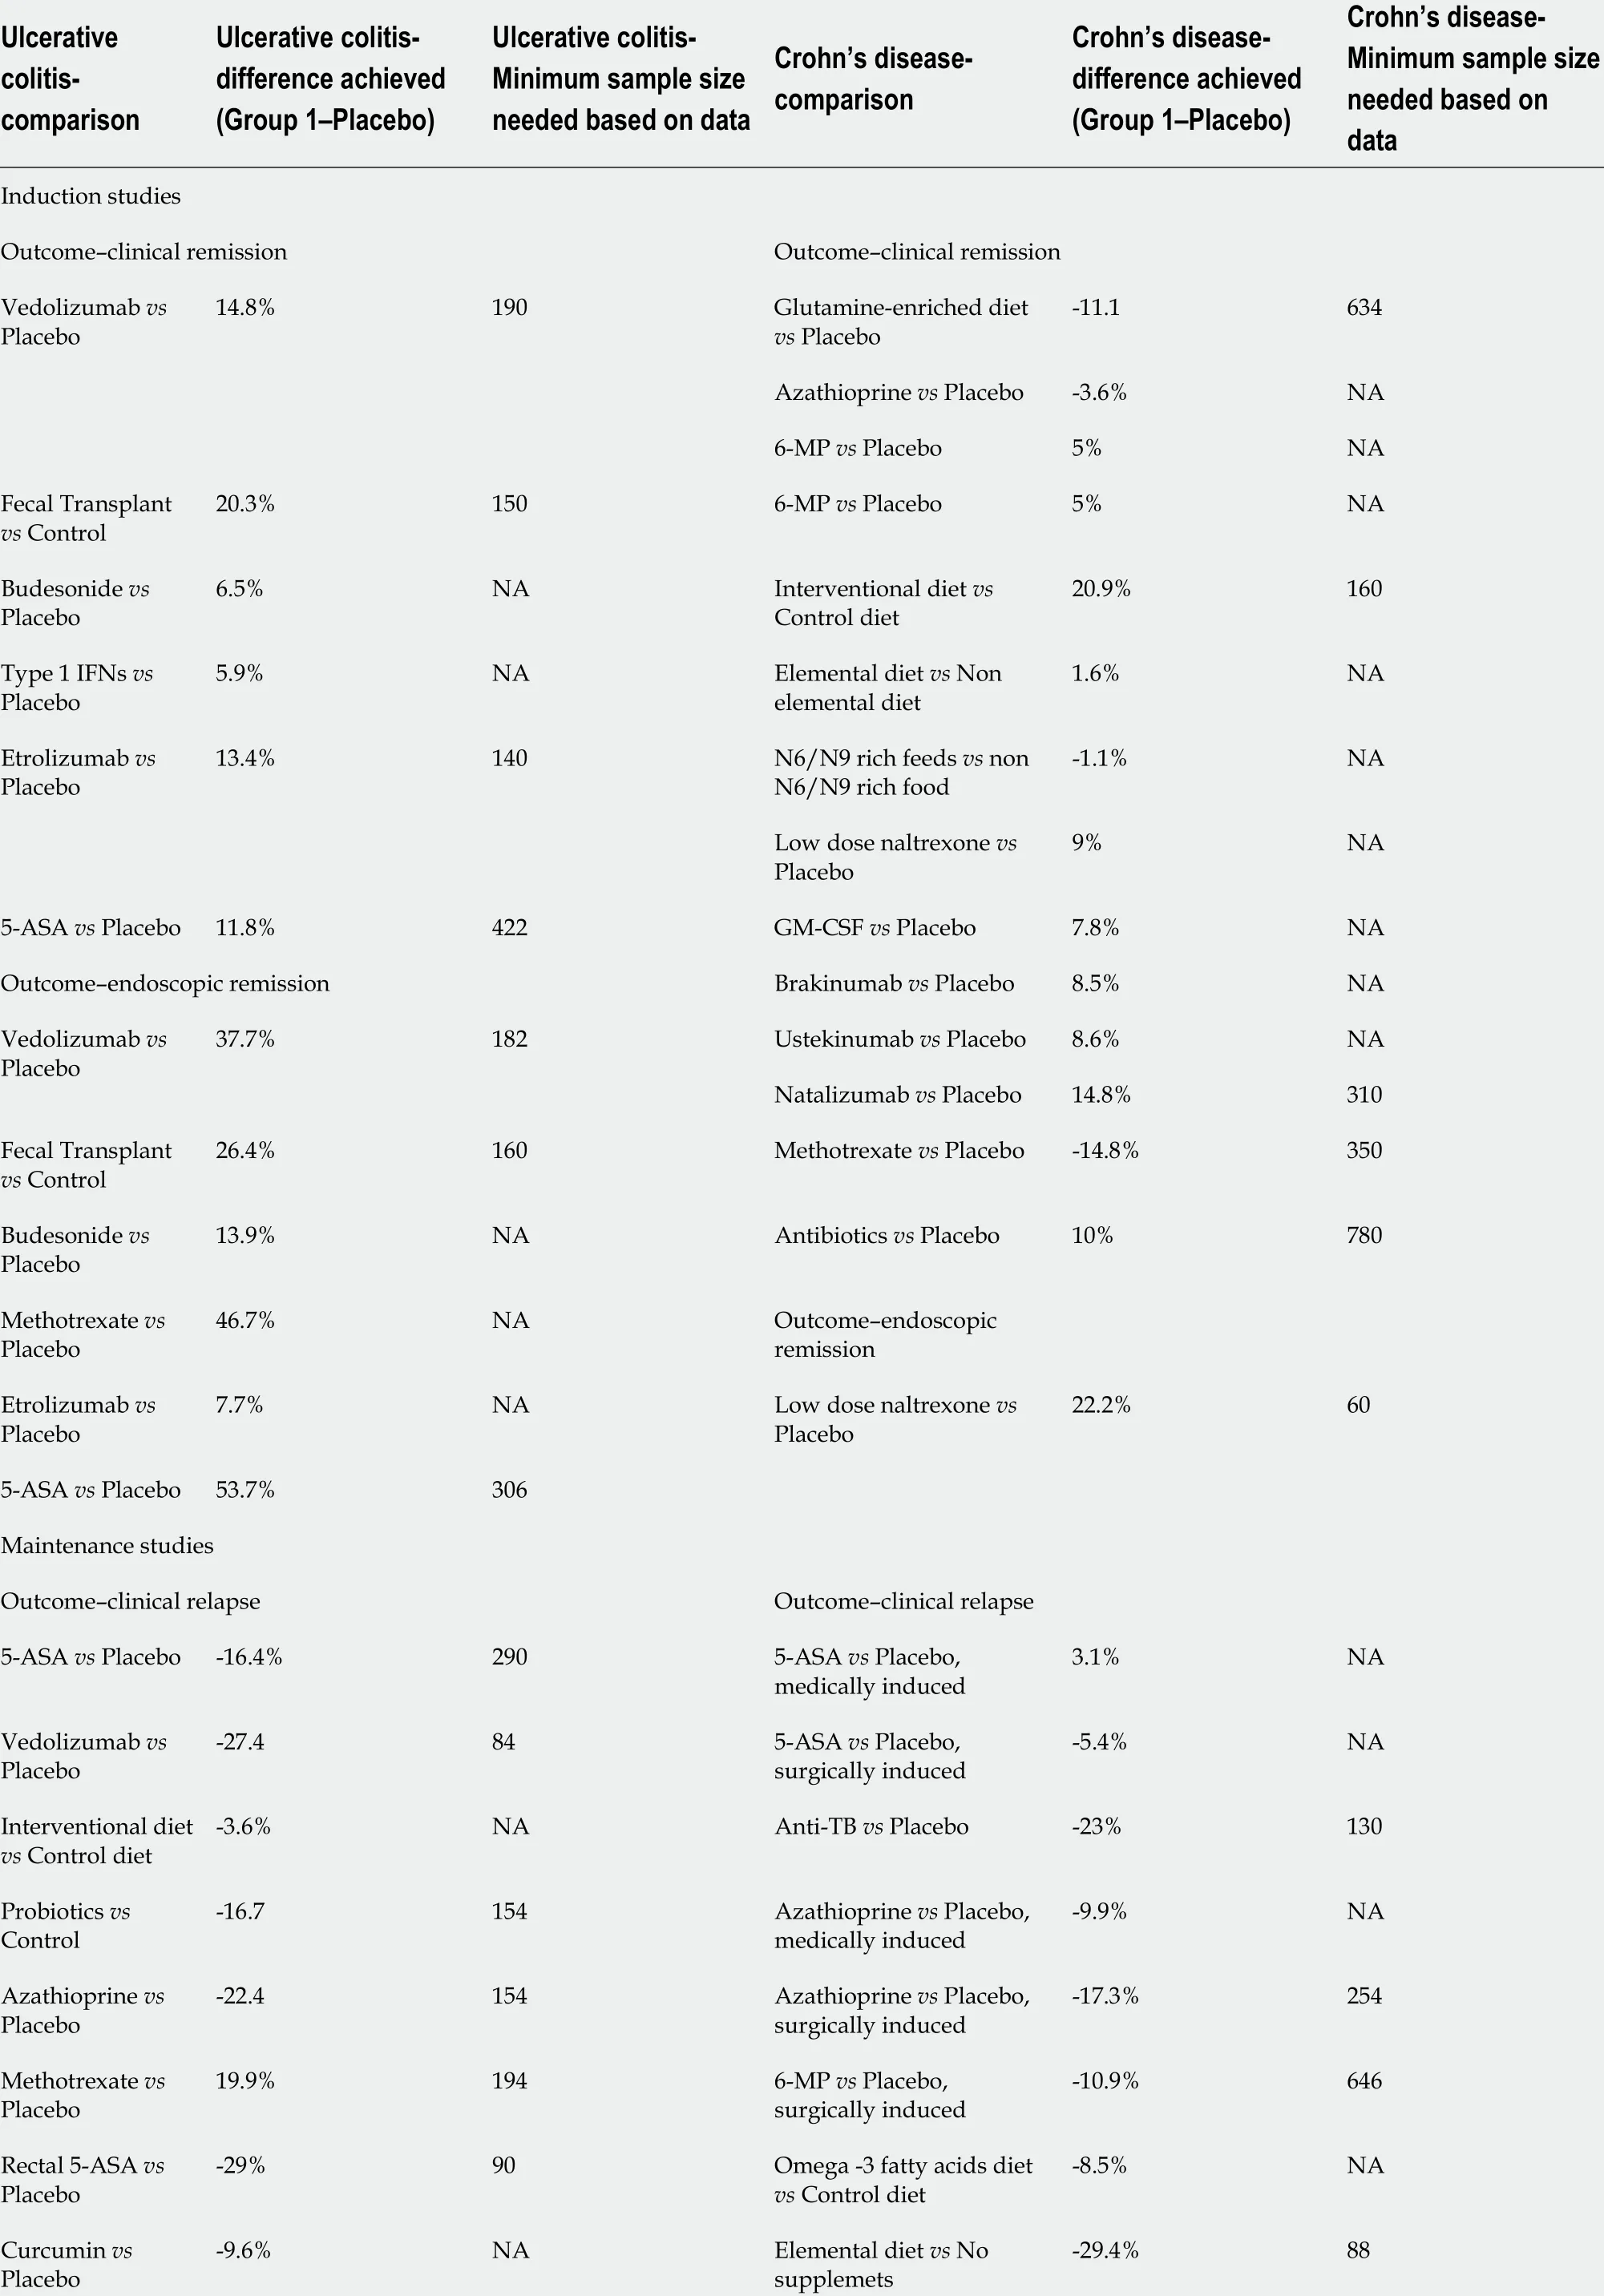
TabIe 2 ProposaIs for minimum cIinicaIIy important difference and associated power caIcuIations for future studies
Outcome-endoscopic relapse Interventional diet vs Control diet-2 .5 %NA Vedolizumab vs Placebo-3460 Antibiotics vs Placebo -14 .6 %360 Methotrexate vs Placebo -24 .2 %1285 -ASA vs Placebo -16 .4 %290 Methotrexate vs Placebo -24 .2 %128 Outcome-endoscopic relapse 5 -ASA vs Placebo 2 .7 %NA Azathioprine vs Placebo -23 %1306 -MP vs Placebo -3 .8 %NA Antibiotics vs Placebo 6 .6 %NA Induction studies Outcome-clinical remission Outcome-clinical remission Vedolizumab vs Placebo 14 .8 %190 Glutamine-enriched diet vs Placebo-11 .1634 Azathioprine vs Placebo -3 .6 %NA 6 -MP vs Placebo 5 %NA Fecal Transplant vs Control 20 .3 %1506 -MP vs Placebo 5 %NA Budesonide vs Placebo 6 .5 %NA Interventional diet vs Control diet 20 .9 %160 Type 1 IFNs vs Placebo 5 .9 %NA Elemental diet vs Non elemental diet 1 .6 %NA Etrolizumab vs Placebo 13 .4 %140 N6 /N9 rich feeds vs non N6 /N9 rich food-1 .1 %NA Low dose naltrexone vs Placebo 9 %NA 5 -ASA vs Placebo 11 .8 %422 GM-CSF vs Placebo 7 .8 %NA Outcome-endoscopic remission Brakinumab vs Placebo 8 .5 %NA Vedolizumab vs Placebo 37 .7 %182 Ustekinumab vs Placebo 8 .6 %NA Natalizumab vs Placebo 14 .8 %310 Fecal Transplant vs Control 26 .4 %160 Methotrexate vs Placebo -14 .8 %350 Budesonide vs Placebo 13 .9 %NA Antibiotics vs Placebo 10 %780 Methotrexate vs Placebo 46 .7 %NA Outcome-endoscopic remission Etrolizumab vs Placebo 7 .7 %NA Low dose naltrexone vs Placebo 22 .2 %605 -ASA vs Placebo 53 .7 %306 Maintenance studies Outcome-clinical relapse Outcome-clinical relapse 5 -ASA vs Placebo -16 .4 %2905 -ASA vs Placebo,medically induced 3 .1 %NA Vedolizumab vs Placebo-27 .4845 -ASA vs Placebo,surgically induced-5 .4 %NA Interventional diet vs Control diet-3 .6 %NA Anti-TB vs Placebo -23 %130 Probiotics vs Control-16 .7154 Azathioprine vs Placebo,medically induced-9 .9 %NA
Azathioprine vs Placebo-22 .4154 Azathioprine vs Placebo,surgically induced-17 .3 %254 Methotrexate vs Placebo 19 .9 %1946 -MP vs Placebo,surgically induced-10 .9 %646 Rectal 5 -ASA vs Placebo-29 %90 Omega -3 fatty acids diet vs Control diet-8 .5 %NA Curcumin vs Placebo-9 .6 %NA Elemental diet vs No supplemets-29 .4 %88 Outcome-endoscopic relapse Interventional diet vs Control diet-2 .5 %NA Vedolizumab vs Placebo-3460 Antibiotics vs Placebo -14 .6 %360 Methotrexate vs Placebo -24 .2 %1285 -ASA vs Placebo -16 .4 %290 Methotrexate vs Placebo -24 .2 %128 Outcome-endoscopic relapse 5 -ASA vs Placebo 2 .7 %NA Azathioprine vs Placebo -23 %1306 -MP vs Placebo -3 .8 %NA Antibiotics vs Placebo 6 .6 %NA NA is put when the difference achieved is less than 10 % (which is the least Minimal Clinically Important Difference used by the studies).
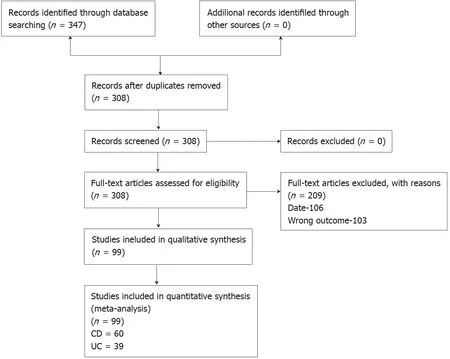
Figure 1 Study flow diagram. UC: Ulcerative colitis; CD: Crohn’s disease.
There are further ethical issues these problems raise, such as being forced to give treatments to people without having a statistically proved effect or a high certainty result within the Grading of Recommendations Assessment, Development and Evaluation analysis (due to reasons of imprecision from statistical sampling issues).The power of a study, therefore, has huge implications on the precision of estimates in the future analysis of data and in turn clinical practice guidelines. Within this review,30 % of studies appeared to be underpowered based on actual achieved clinical differences within the wider comparable evidence base, with mean sample size deficits up to 79 patients per trial. This does impact the overall certainty of the global evidence base within IBD, with precision a key limitation downgrading many outcomes within key guidelines across dozens of interventions.
Within this review, we present a resource for SSE not just for future study authors,but for study peer reviewers and most importantly professionals and the patients. This table gives an estimated PC result for a minimum sample size based on all existing studies within this period. Rather than being based on just single studies or clinical judgement, these represent estimates based on actual achieved clinical data and to our knowledge are the first time such a resource has ever been provided for researchers in the field or indeed for readers of future research. Additionally, for those wishing to calculate key statistics and measures of outcome from their primary studies, this paper provides a systematic and objective resource for baseline risk. This could be used for calculating numbers needed to treat or harm, for example.
This resource can be used by study designers to prevent PCs based on studies that offer a high MCID and as such a lower minimum sample size than is actually warranted. Conversely, it prevents unnecessary over recruitment. Funders can use this to appropriately budget and ensure viability of studies. Ethics boards and other governance groups will be able to consult this resource to support their consideration of research proposals.
There were a number of comparisons where the difference in practice was below 10 % and it was deemed inappropriate to make a calculation in such cases, as no previous study has ever indicated an MCID below 10 % as clinically significant to patients or practice. In these cases, consideration should be given to the overall figures presented in Table 2 or minimum sample size and MCID in practice in a similar context.
We would also recommend that in practice, patients and key stakeholders should be involved in deciding on an MCID for a given intervention prior to a new study. They may indicate that in spite of any existing MCID evidence that such a difference is not significant enough to matter to those who are most impacted by the findings and such views must be reflected in the process of SSE. It is also worth noting that there will always be settings and contexts when deviation may be warranted, thereby, a resource is not prescriptive but rather presented as evidence-based guidance. We would,however, propose that such deviations can and should be justified to support transparency for the readings these trials report.
There are weaknesses and exceptions to these approaches. The search methods used limited the parameters of the search for pragmatic reasons. However, this does not represent any systematic bias, hence we do not believe it invalidates the findings, and in the future this resource can be updated prospectively. When the achieved difference was less than 10 %, rather than reporting extremely large sample size calculations, no such calculation was made. Additionally, in studies comparing active agents, accurate estimates are needed based on the contexts as the hypothesis may not be of the inferiority or superiority but of no difference, which requires a different approach to calculations.
There were some limitations to this review. There are obvious issues of heterogeneity limiting the appropriateness of pooling the data, however, the only way to obtain the previously used MCID was through looking at the past studies. These are mainly related to missing or unclear information in primary studies regarding SSE and as authors were not contacted, assumptions were made for the basis of these calculations which could confer some inaccuracy in our estimations. We also limited our studies to those from after the CONSORT statement release as we felt this was a fair time from which to expect SSE to occur, but earlier studies could potentially have offered more insight. Finally, we have focussed on studies comparing treatment with placebo or no intervention. This was a pragmatic decision as many studies of agents choose to make this comparison, although often these do not reflect current standard clinical practice. In the cases of such comparisons, SSE may not have to be based on a MCID but instead assume clinical equivalency and therefore be informed differently.In essence, this guidance may not be relevant for these scenarios, although may inform statistical considerations within similar contexts. Finally, such a resource of course is likely to become inaccurate rapidly, with the need for updates, but as often no such resource is employed, we believe this is still an improvement on current practices.
Future researcher is needed to potentially validate the calculations with clinical and patient input to ensure the SSE and MCID that the data informs has clinical, as well as statistical relevance. This could lead to a more triangulated resource that is statistically and evidentially sound, but also clinically sound and patient informed. This could conceivably lead to increases or decreases in minimally important differences to reflect complexity in specific clinical scenarios and interventional contexts.
CONCLUSION
In conclusion, a third of intervention IBD studies within the last 25 years are underpowered, with large variations in the approaches to calculating sample sizes and the minimum clinically important differences. The authors present a sample size estimate resource based on the published evidence base for future researchers and other key stakeholders within the IBD trial field.
ARTICLE HIGHLIGHTS
 World Journal of Gastroenterology2021年43期
- World Journal of Gastroenterology的其它文章
- Survivin-positive circulating tumor cells as a marker for metastasis of hepatocellular carcinoma
- Immunoglobulin G in non-alcoholic steatohepatitis predicts clinical outcome: A prospective multi-centre cohort study
- Genome-wide map of N6 -methyladenosine circular RNAs identified in mice model of severe acute pancreatitis
- Liver injury changes the biological characters of serum small extracellular vesicles and reprograms hepatic macrophages in mice
- Hepatitis B: Who should be treated?-managing patients with chronic hepatitis B during the immunetolerant and immunoactive phases
- Recent advances in artificial intelligence for pancreatic ductal adenocarcinoma