
Liver injury changes the biological characters of serum small extracellular vesicles and reprograms hepatic macrophages in mice
2021-12-03 06:15:26XiuFangLvAnQiZhangWeiQiLiuMinZhaoJingLiLiHeLiChengYuFengSunGangQinPengLuYuHuaJiJuLingJi
World Journal of Gastroenterology 2021年43期
Xiu-Fang Lv, An-Qi Zhang, Wei-Qi Liu, Min Zhao, Jing Li, Li He, Li Cheng, Yu-Feng Sun, Gang Qin, Peng Lu,Yu-Hua Ji, Ju-Ling Ji
Abstract
Key Words: MicroRNA; Small RNA sequencing; Biomarker; Monocyte-derived macrophage; Resident macrophage
INTRODUCTION
Because of its strategic location and biological functions, the liver is particularly susceptible to various pathogenic factors, including drugs, alcohol and viruses. The initial insult induces acute liver injury (ALI) or even liver failure. Repeated or persistent insults will cause chronic liver injury (CLI), resulting in liver fibrosis and finally fatal cirrhosis[1 ,2]. Therefore, it is important to identify individuals with liver injury. However, liver injury does not always cause noticeable signs and symptoms.Aside from the widely used blood liver function tests on serum alanine aminotransferase (ALT) and aspartate aminotransferase (AST), which are not always restricted to liver injury[3], there is still a need to explore specific and sensitive biomarkers. With the rapid progress in medical research, it is now possible and necessary to search for new biomarkers from serum small extracellular vesicles (sEVs).
Recently, serum sEVs have attracted tremendous interest due to their essential roles in intercellular communication and to their diagnostic and therapeutic potential[4].The term sEVs refers to extracellular vesicles released by cells that are of relatively small size (< 200 nm) and were previously regarded as exosomes[5]. The cargoes carried by sEVs represent a snapshot of the parental cells at the time of release and change depending on the physiological and pathological states[6 ,7]. In the liver, sEVs are released from both hepatocytes and nonparenchymal cells into the extracellular space and circulation. Several studies have reported that circulating sEV RNAs or proteins are abnormally expressed in the contexts of drug-induced liver injury (DILI),steatohepatitis, viral hepatitis and hepatocellular carcinoma (HCC)[6 ,8].
MicroRNAs (miRNAs) are 22 -24 nt small noncoding RNAs involved in posttranscriptional regulation and various biological processes[9]. Tissue-specific distribution is a key feature of miRNAs, making miRNAs good candidates as biomarkers or therapeutic targets for particular types of tissue injury[10 -12]. Serum miRNAs have been studied in a variety of liver diseases[13]. However, compared to serum miRNAs,serum sEV miRNAs are well protected from RNA enzymes. Thus, serum sEV can serve as a more reliable miRNA pool[14]. We hypothesized that serum sEVs and their miRNA cargoes might reflect liver damage upon injury and could be promising biomarkers.
In the present study, we tried to determine the effects of liver injury on serum sEVs and the small RNAs (sRNAs) they transport; we were also interested in determining if there is any difference between acute and chronic injury. A study in this regard will aid in identification of potential serum sEV miRNA biomarkers. The dynamic changes in the number and morphology of serum sEVs and the sRNA components of serum sEVs were examined. The profiles of deregulated serum sEV miRNAs were obtained and compared to those of mouse liver enriched miRNAs and previously reported circulating miRNAs related to human liver diseases (HLD). To further evaluate the biological significance of serum sEVs upon liver injury, conditioned cultures of ALI serum sEVs and primary hepatic macrophages were carried out.
MATERIALS AND METHODS
Animal studies
Male C57 BL/6 mice (8 wk old) were purchased from the Shanghai Medical Laboratory Animal Center (Shanghai, China) and housed in the animal facility of Nantong University with temperature 25 ± 2 °C and 12 h light/dark cycle controls. All experimental protocols were approved by the Animal Ethics Committee of Nantong University. The animal care and experiments were performed in accordance with the relevant guidelines and regulations. For ALI, mice were treated with a single dose of CCL4(0 .5 mL/kg intraperitoneal injection) dissolved in olive oil (1 :9 ). The mice were sacrificed at 2 d or 7 d. For CLI, mice were treated with CCL4 (0 .5 mL/kg) or vehicle twice a week for 8 wk[15]. The mice were sacrificed 48 h after the last injection at 8 wk or at 12 wk (Figure 1 A). Mice treated with the same volume of olive oil served as the controls for the ALI and CLI models, and 10 -12 mice were used in each group. Blood or livers were collected from each group for further analyses.
Liver function test and histopathologic examination
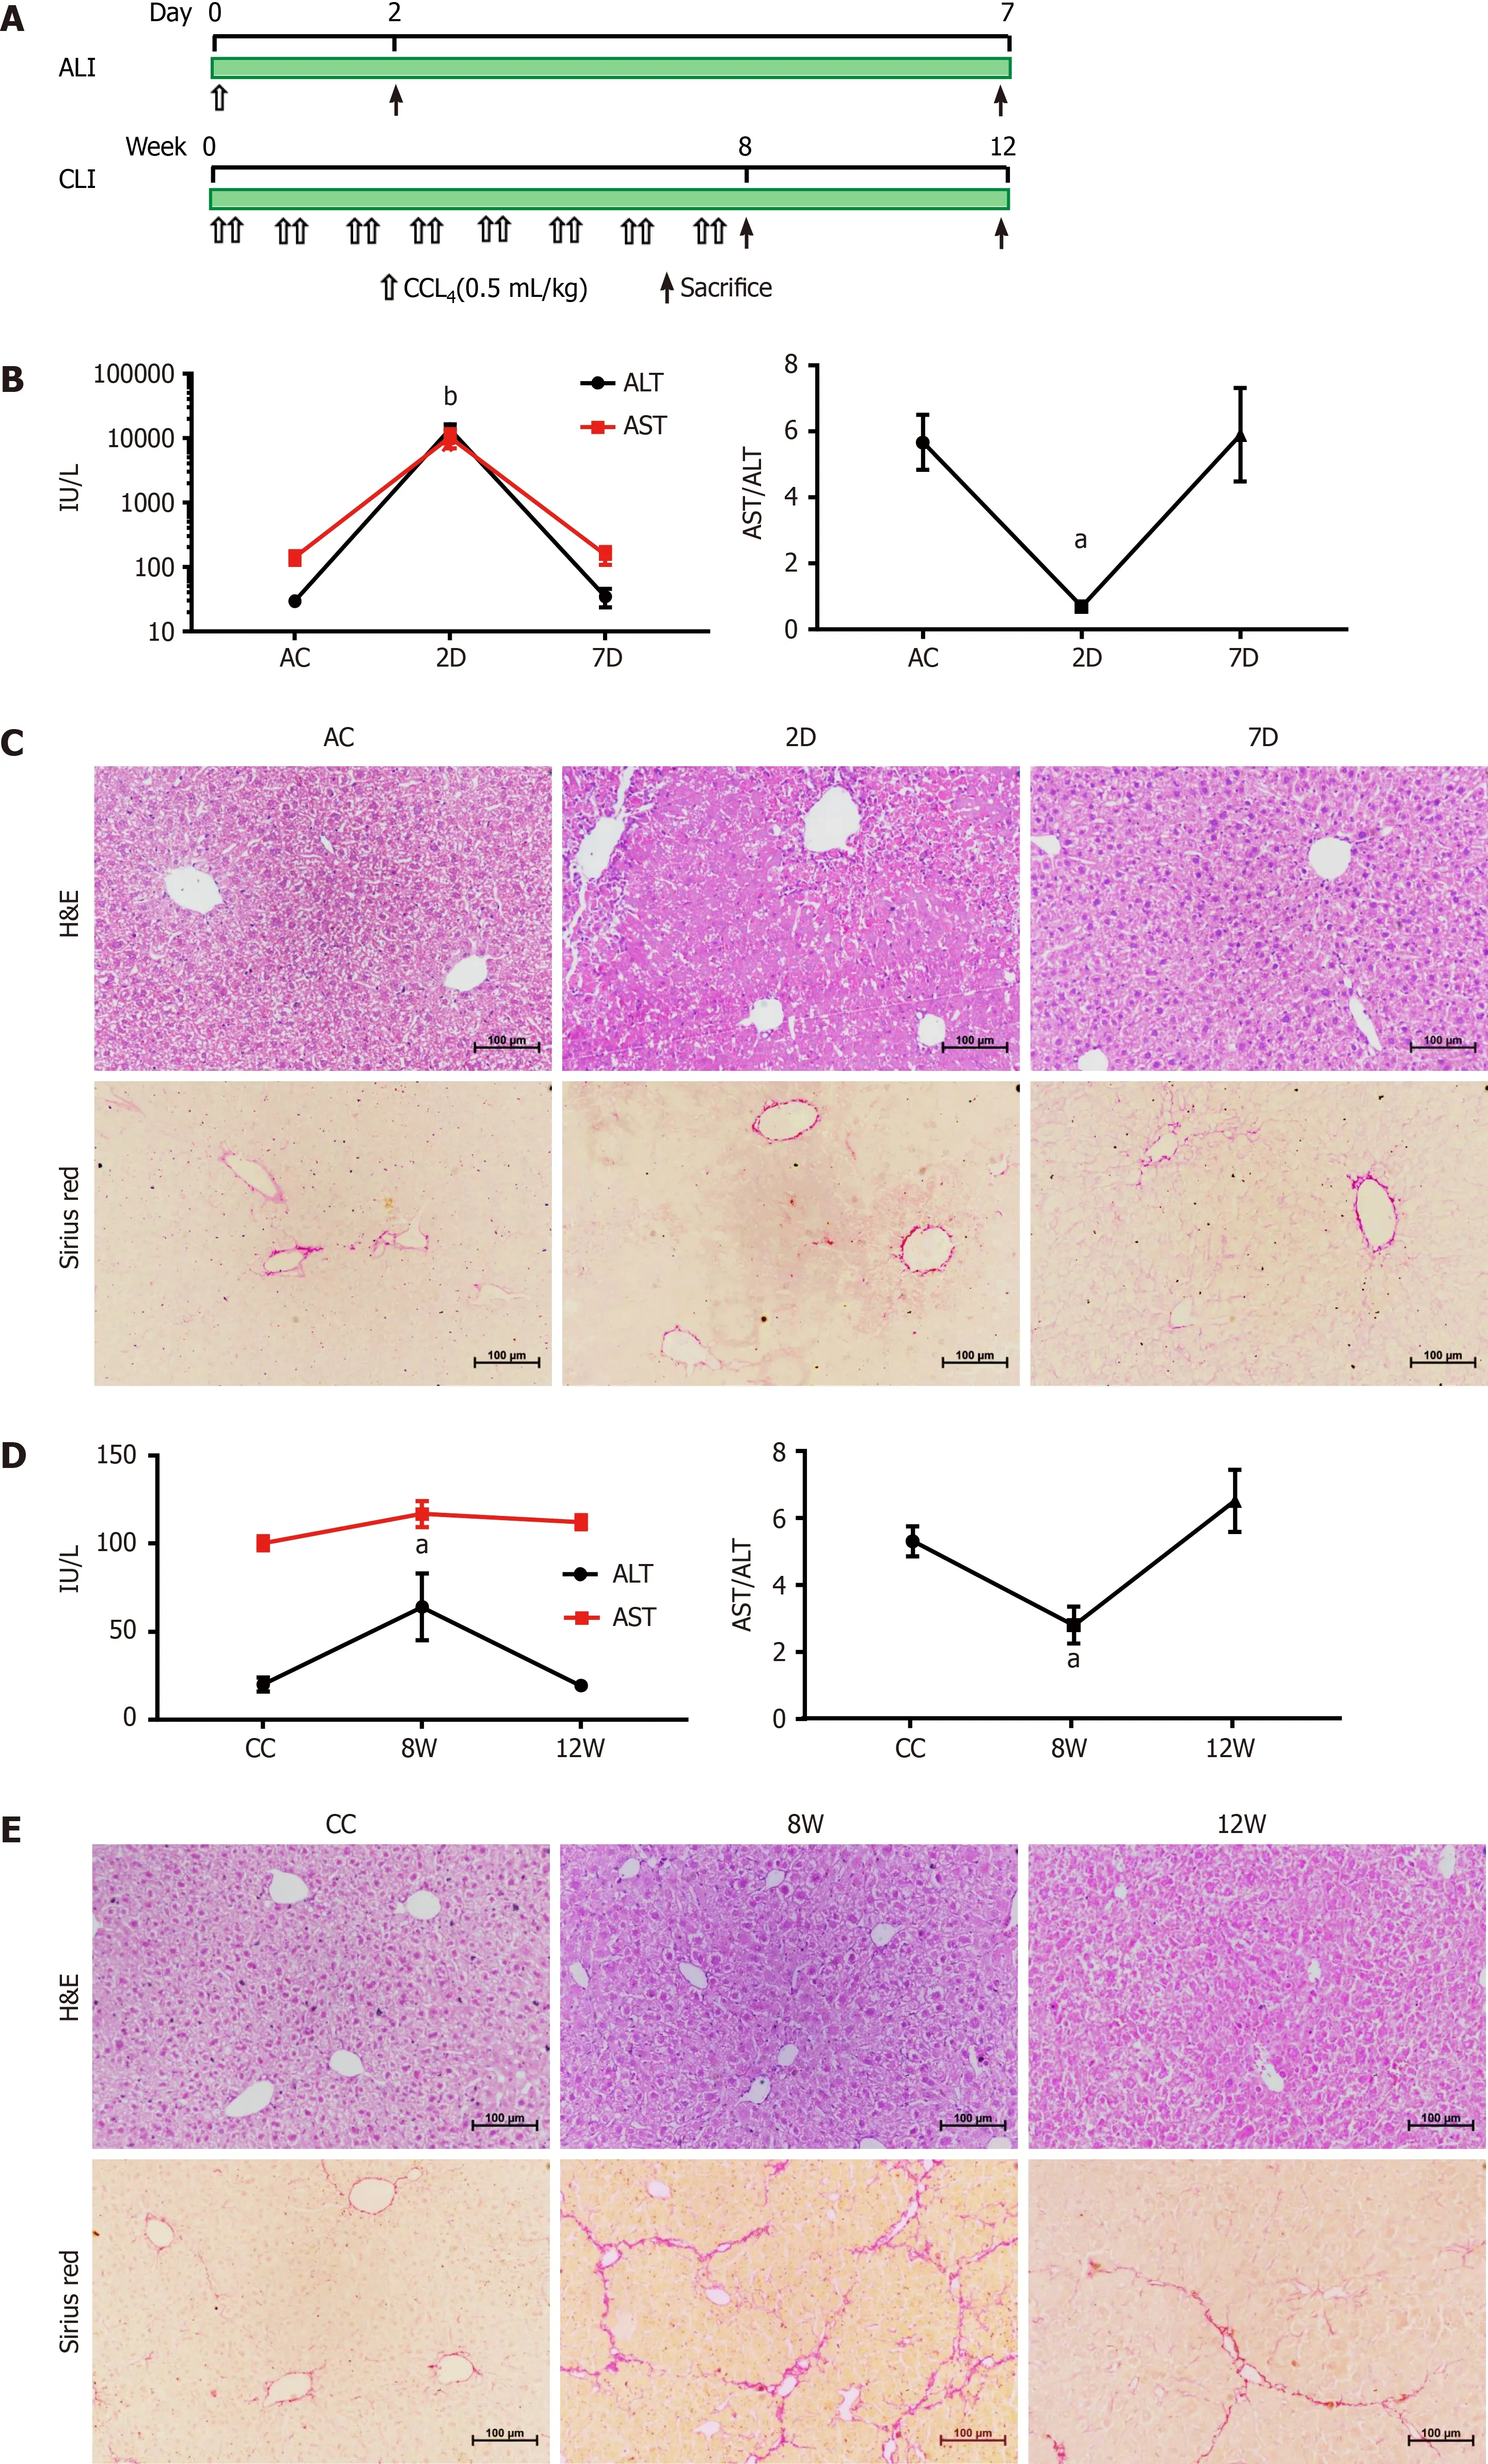
Figure 1 Establishment and validation of CCL4 -induced acute liver injury and chronic liver injury in mice. A: Workflow for the establishment of the acute liver injury (ALI) and chronic liver injury (CLI) mouse models; B: Serum alanine aminotransferase (ALT) and aspartate aminotransferase (AST) levels in ALI mice. Compared with the ALI control (AC) group, aP < 0 .05 , bP < 0 .01 ; C: Hematoxylin-eosin (H&E) and Sirius Red staining of liver sections from AC, 2 d and 7 d mice; D: Serum ALT and AST levels in CLI mice. Compared with the CC group, aP < 0 .05 ; E: H&E and Sirius Red staining of liver sections from CLI control (CC), 8 wk and 12 wk mice. Scale bar = 100 μm. D: Day; W: Week.
Blood was collected by left ventricular puncture from mice and was left undisturbed for 1 h at 37 °C and 2 h at 4 °C. Afterward, the samples were centrifuged at 1000 ×gfor 10 min at 4 °C; the clear upper fractions were aliquoted and stored at -80 °C. Serum ALT and AST levels were measured on an ADVIA 1800 autoanalyzer (Siemens Healthcare Diagnostics, Deerfield, IL, United States). The livers were preserved in 4 %paraformaldehyde, paraffin-embedded and sectioned. The liver tissue sections were stained with hematoxylin and eosin (Beyotime Biotechnology, Shanghai, China) for routine histology and 0 .1 % Sirius Red (Sigma-Aldrich, St. Louis, MO, United States)for collagen evaluation.
Mouse serum sEV isolation and characterization
Exosome-enriched serum sEV fractions were precipitated using ultracentrifugation and an ExoQuick precipitation kit (System Biosciences Inc., Mountain View, CA,United States)[16]. The sizes and particle concentrations of the isolated serum sEVs were measured by nanoparticle tracking analysis (NTA, NanoSight NS300 , Malvern,United Kingdom). Serum sEVs were visualized using transmission electron microscopy (TEM, HT7700 , Hitachi Ltd., Tokyo, Japan). The expression of exosomal protein markers was determined by Western blot analysis. The details are provided in the Supplementary material, Supporting Information.
sRNA library construction and deep sequencing
Serum sEV sRNA sequencing (RNA-seq) was conducted by BMK Biotech Co., Ltd.(Beijing, China) with biological replicates for each group.
Sequencing data analysis and bioinformatic analysis
The raw data were processed as described previously[16]. The trimmed sequencing reads were deposited in the European Nucleotide Archive (https://www.ebi.ac.uk/arrayexpress/experiments/E-MTAB-9462 ). Bioinformatic analysis of the differentially expressed serum sEV miRNAs was performed using Ingenuity Pathways Analysis(Qiagen, Valencia, CA, United States). The significance of enrichment for genes with particular biologically relevant functions was determined with a one-sided Fisher’s exact test.
Systematic review of abnormally expressed circulating miRNAs in HLDs
The detailed procedure is provided in the Supplementary material, Supporting Information.
Isolation and culture of mouse hepatic macrophages
Primary mouse hepatic macrophages were isolated from male C57 BL/6 mouse livers by Percoll (GE Healthcare, Princeton, NJ, United States) density gradient centrifugation. Incubation of liver macrophages with mouse serum sEVs and subsequent multiple-color flow cytometric analysis were carried out. The details are provided in the Supplementary material, Supporting Information.
Statistical analysis
Statistical analyses were performed with GraphPad Prism 7 .0 software (GraphPad Software, Inc., La Jolla, CA, United States). Quantitative data were reported as the mean ± standard deviation. Comparisons between groups were made by Student’sttest or one-way analysis of variance. AllPvalues were two-sided, and statistical significance was accepted for a value less than 0 .05 . Except for the data from sRNA-seq experiments, which included two biological replicates for each group, the data provided in the present study were from three or more independent experiments.
Additional methods and details are provided in the Supplementary material,Supporting Information.
RESULTS
Establishment and validation of CCL4 -induced ALI and CLI in mice
The mouse CCL4-induced ALI and recovery model and the mouse CCL4 -induced CLI and recovery model were established and validated (Figure 1 ).
In acutely injured mice (at 2 d; 2 D group), serum ALT and AST levels were increased, and hepatocyte necrosis and inflammatory cell infiltration were observed around the lobular central vein. After 5 d of recovery (at 7 d; 7 D group), the elevated ALT and AST levels had returned to the baseline of the ALI control group, and the histological changes were also reversed (Figure 1 B and C). For CLI, repeated CCL4 treatment induced a slight elevation in serum ALT (at 8 wk; 8 W group), but the level returned to the baseline of the CLI control (CC) group by 4 wk after cessation of CCL4 treatment (at 12 wk; 12 W group) (Figure 1 D). Although the ALT level change in CLI at 8 W was not as prominent as those in ALI at 2 D, the change was comparable to the ALT level changes reported by other study groups using the same mice CLI model[17 ,18]. Damaged hepatocytes and centrilobular contracture were observed in the livers of the CLI mice (8 W), with mild inflammatory cell infiltration. Sirius Red staining showed obvious collagen deposition and pseudolobule formation in 8 W CLI mice.These morphological changes were alleviated in recovered mice (12 W) (Figure 1 E).
Identification and characterization of serum sEVs from ALI and CLI mice
The isolated particles were spherical or cup-shaped, as observed by TEM (Figure 2 A).Exosomal protein markers, including CD63 , CD81 and CD9 , were all highly expressed(Figure 2 B), as determined by Western blot analysis.
NTA showed that the mean diameter of the particles ranged from 90 .2 nm to 127 .8 nm. The number of particles was higher in the 2 D group but lower in the 7 D group than in the control group, and the particle diameters were smaller in the 2 D group but larger in the 7 D group than in the control group. We also noticed that the size distribution of sEVs widened and that multiple peaks were present in the 7 D group(Figure 2 C). For CLI mice, the particle concentrations in the 8 W and 12 W groups tended to be lower than those in the control group, although there were no significant differences. The size distribution of sEVs was expanded with multiple peaks in both the 8 W and 12 W groups, and the particle diameters were larger in both the 8 W and 12 W groups (Figure 2 D). TEM examination revealed that the multiple peaks reflected the aggregation or fusion of mouse serum sEVs present in 7 D, 8 W and 12 W samples(Figure 2 C and D).
These findings suggested that both ALI and CLI changed the number and morphology of mouse serum sEVs, and even when the visible histological changes of the liver had recovered in the 7 D and 12 W groups, the changes in particle number and morphology of serum sEVs persisted.
Comparison of the sRNA components in serum sEVs from ALI and CLI mice
Dramatic increases in both total RNA and sRNA levels in serum sEVs were observed upon ALI (2 D) (Figure 3 A and B). For CLI, there was no significant difference in either sEV RNA or sRNA content among the groups. RNA-seq and annotation revealed that each pair of biological repeats had at least 94 .97 % common sequences in clean reads(Supplementary Figure 1 ). In the control groups (ALI control and CC), tRNA was the dominant sRNA species in serum sEVs, followed by rRNA and miRNA (Figure 3 C).The most remarkable change in serum sEV sRNAs was the increase in miRNA proportion in both ALI and CLI mice. Compared to the control condition, ALI increased the proportion of miRNAs by more than four-fold, but the proportion returned to baseline by 7 d; the proportion of miRNAs increased by almost three-fold in CLI mice but was partially restored by 12 wk. With the increase in miRNA, the proportion of tRNA decreased (Figure 3 D).
miRNA expression profiles of serum sEVs from ALI and CLI mice
For the ALI and CLI groups, 467 and 488 detectable sEVs (transcripts per million reads≥ 5 .0 ) miRNAs were obtained, respectively. The biological replications were highly correlated in each group (Figure 4 A). The RNA-seq data were further validated by quantitative real-time polymerase chain reaction. Differentially expressed miRNAs with different abundances were selected for validation (Figure 4 B).
In total, 91 miRNAs were upregulated and 85 miRNAs were downregulated (fold change ≥ 2 .0 , P < 0 .05 ) in the 2 D group compared with the ALI control group(Figure 4 C and Supplementary Table 1 ). The levels of most of these miRNAs had recovered to baseline levels in the 7 D group, in which only 8 upregulated miRNAs and 11 downregulated miRNAs were detected (fold change ≥ 2 .0 , P < 0 .05 ) (Figure 4 C and Supplementary Table 2 ). The cumulative distribution frequency was calculated by adding each proportion of miRNAs from most to least abundant. The plot showed that the top five upregulated miRNAs (miR-148 a-3 p, miR-122 -5 p, miR-192 -5 p, miR-22 -3 p and miR-21 a-5 p) in the 2 D group accounted for up to 84 .27 % of all detectable miRNAs(Figure 4 C).
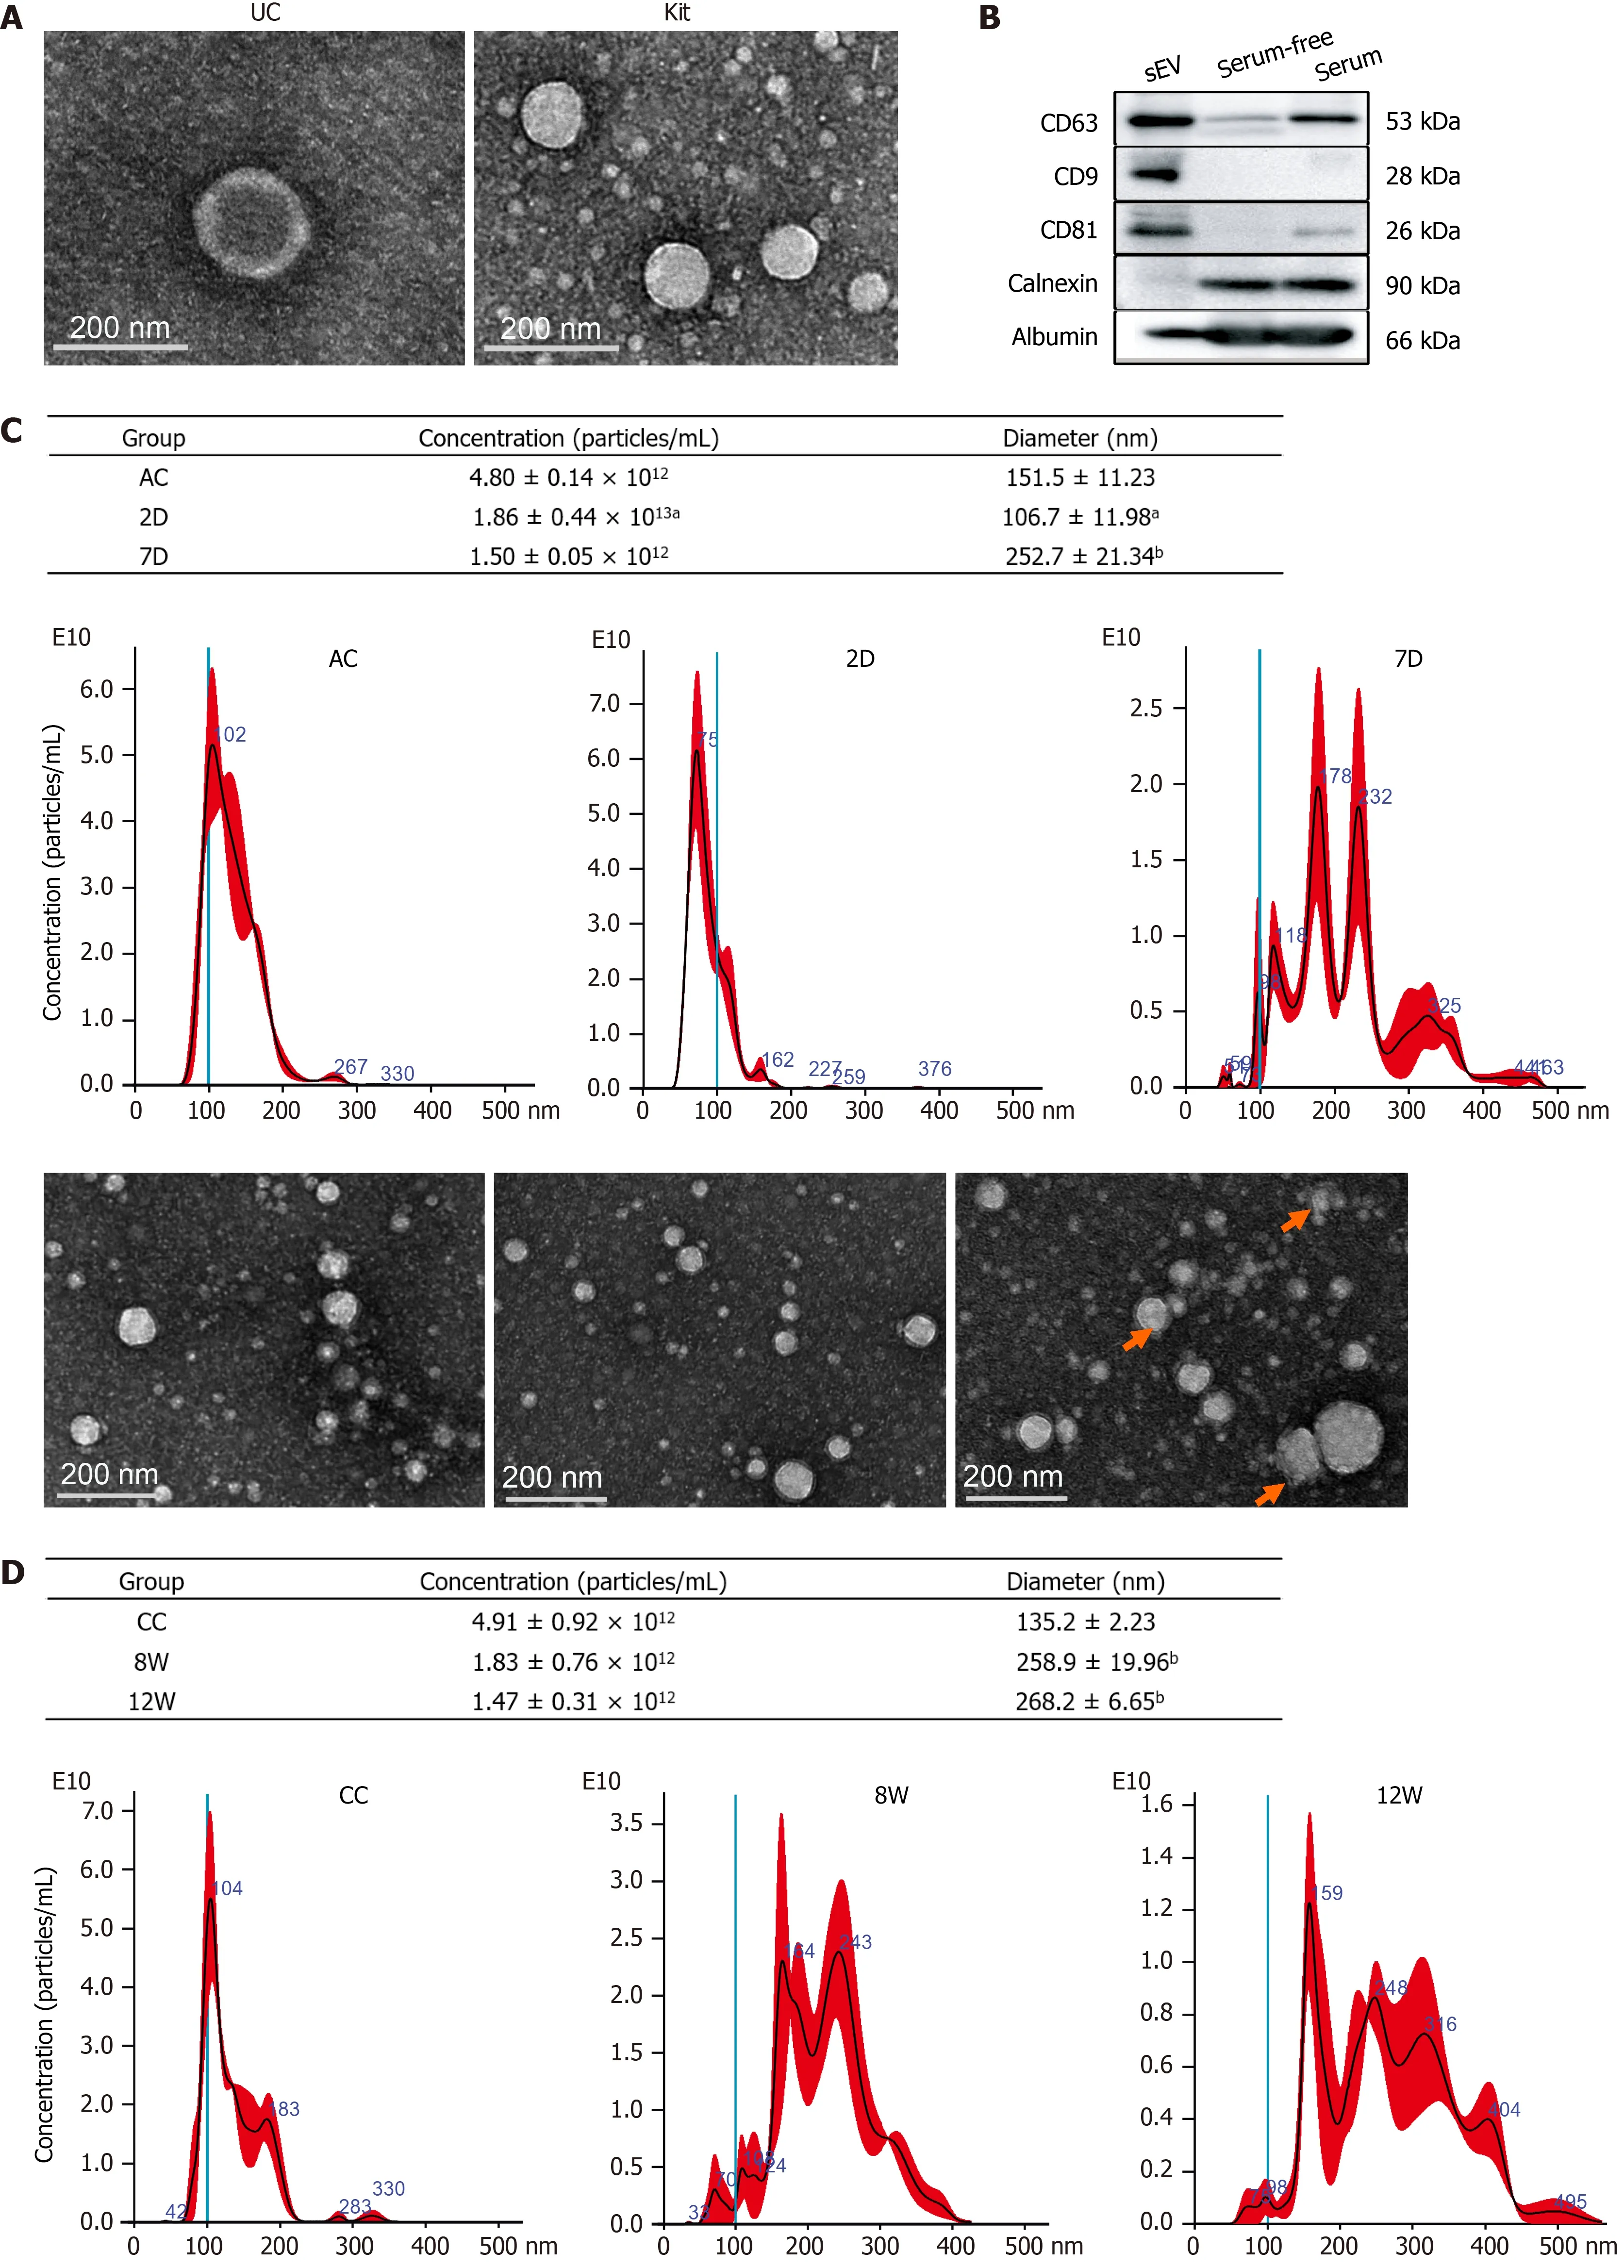
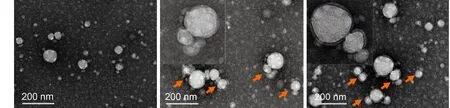
Figure 2 Characterization of isolated mouse serum small extracellular vesicles. A: Transmission electron microscopy (TEM) images of the particles isolated using ultracentrifugation and an ExoQuick precipitation kit; B: Representative Western blotting bands for CD63 , CD81 , CD9 , calnexin and albumin; C:Nanoparticle tracking analysis (NTA) plots for the size distribution and concentration of the isolated particles in each group from ALI mice and the corresponding TEM images. Compared with the ALI control group, aP < 0 .05 , bP < 0 .01 ; D: NTA plots for the size distribution and concentration of the isolated particles in each group from CLI mice and the corresponding TEM images. Compared with the CLI control group, bP < 0 .01 . The red arrow indicates aggregated particles; representative particles were amplified and were exemplified in the top left corner. Scale bar = 200 nm. UC: Ultracentrifuge; D: Day; W: Week; AC: Acute liver injury control; CC: Chronic liver injury control; sEVs: Small extracellular vesicles.
Only 13 miRNAs were upregulated and six miRNAs were downregulated (fold change ≥ 2 .0 , P < 0 .05 ) in the 8 W group compared with the CC group (Figure 4 D and Supplementary Table 3 ); in addition, 8 miRNAs were upregulated and 3 miRNAs were downregulated (fold change ≥ 2 .0 , P < 0 .05 ) in the 12 W group compared with the CC group (Figure 4 D and Supplementary Table 4 ). The cumulative distribution frequency analysis showed that the top three upregulated miRNAs (miR-122 -5 p, miR-192 -5 p, and miR-22 -3 p) in the 8 W group constituted up to 43 .48 % of all detectable miRNAs (Supplementary Figure 2 ). These findings suggested that both ALI and CLI induced changes in serum sEV miRNA composition. The changes were caused by the differential expression of a small number of miRNAs with high abundance.
The biological significance of these differentially expressed serum sEV miRNAs in liver injury was explored by Ingenuity Pathway Analysis (www.qiagen.com/ingenuity). For the 176 differentially expressed serum sEV miRNAs upon ALI, hepatic steatosis was the most significant hepatotoxic effect, followed by liver inflammation.For the 19 differentially expressed serum sEV miRNAs upon CLI, HCC was the most significant, followed by liver hyperplasia (Figure 4 E).
The liver is the main contributor to the differentially expressed serum sEV miRNAs during ALI and CLI
We were interested in determining the contribution of liver cells to the changes in serum sEV miRNAs upon ALI and CLI. First, the liver miRNA expression profile for wild-type male C57 BL/6 mice was established using BRB-Array Tool v4 .6 .0 (https://brb.nci.nih.gov) based on the RNA-seq data from GSE78792 (https://www.ncbi.nlm.nih.gov/geo/query/acc.cgi?acc=GSE78792 )[19] (Supplementary Table 5 ).Differentially expressed serum sEV miRNAs from ALI and CLI mice were compared to the liver miRNA expression profile. Among the top ten most abundant liver miRNAs, seven were also among the top ten increased miRNAs in serum sEVs upon ALI (Table 1 ) and constituted up to 84 .70 % of the increased serum sEV miRNAs. For CLI, the levels of three were raised in serum sEVs. These three miRNAs were the top three miRNAs that increased upon CLI (Table 1 ) and constituted up to 60 .56 % of the total increased serum sEV miRNAs. These findings suggested the liver as the primary contributor to the upregulated serum sEV miRNAs during ALI and CLI and confirmed that the serum sEV miRNA test could be a reliable and sensitive way to monitor either ALI or CLI.
ALI and CLI signatures based on serum sEV miRNA profiling
To identify serum sEV miRNA signatures for liver injury, we compared the differentially expressed serum sEV miRNAs in various stages of ALI and CLI. Compared to the levels in the vehicle control samples, eight miRNAs were upregulated and two miRNAs were downregulated significantly during the acute injury stage, and these changes were sustained through the chronic phase (fold change ≥ 2 .0 , P < 0 .05 ); thus,they can serve as common liver injury signatures (Figure 5 A). In addition, the levels of 166 miRNAs changed significantly during acute injury, while those of nine miRNAs changed dramatically during chronic injury. These miRNAs with high abundance(transcripts per million reads _mean > 1000 ) have the potential to be ALI or CLIsignatures. The complete lists of these potential ALI and CLI serum sEV miRNA signatures are provided in Supplementary Table 6 . According to their abundance, up to the top 20 miRNAs are listed in Figure 5 . For the recovery stage, 18 miRNAs were changed significantly in the ALI group, and 11 miRNAs were changed significantly in the CLI group (Figure 5 B). Some of these miRNAs overlapped with differentially expressed serum sEV miRNAs in corresponding acute or chronic injury stages.
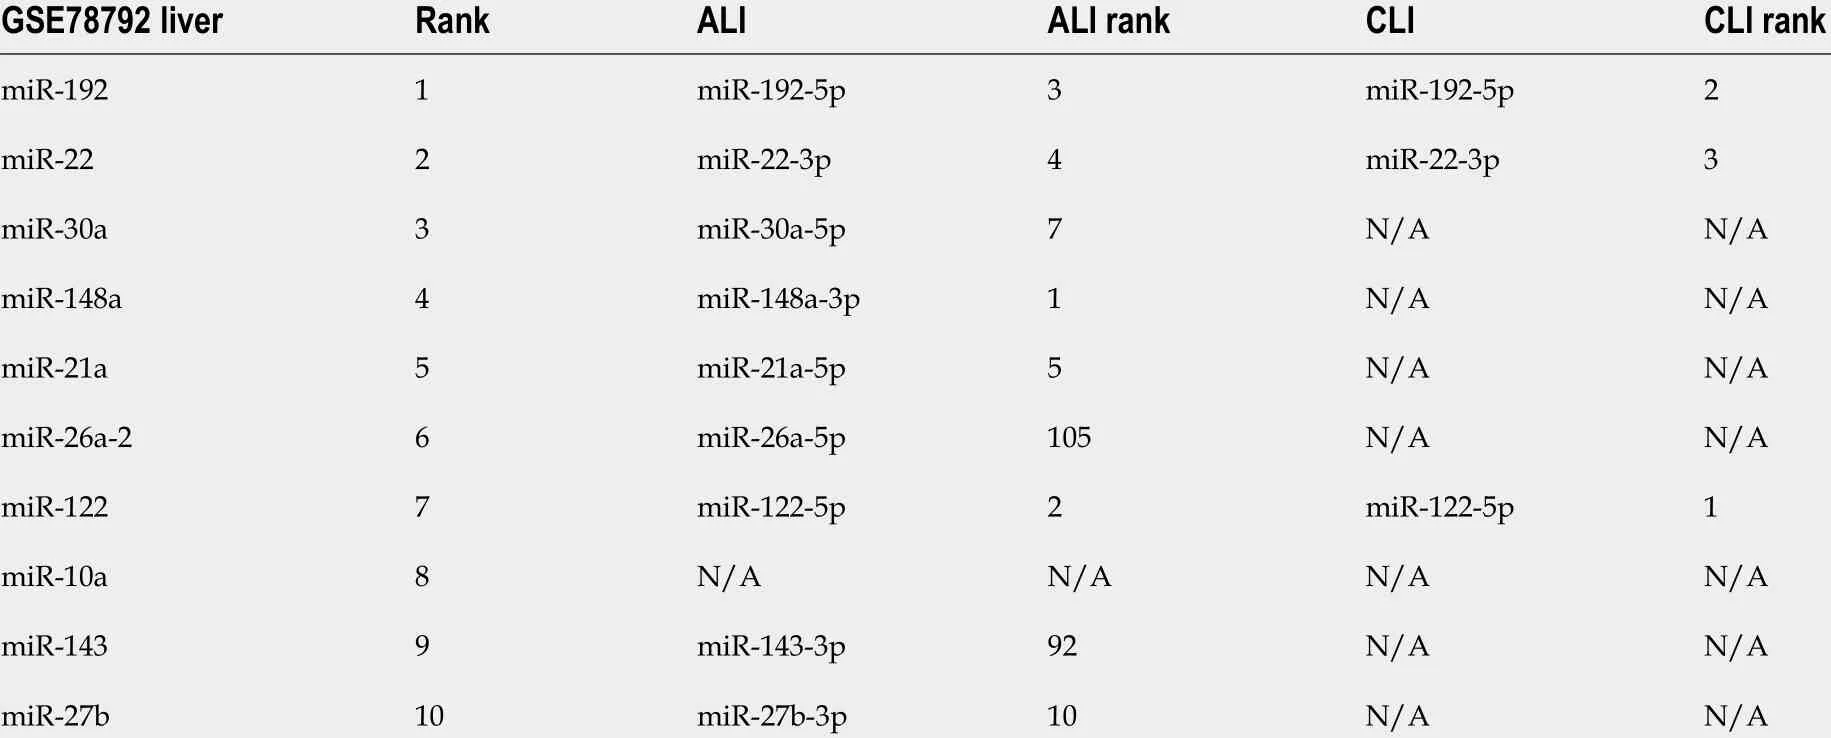
Table 1 Liver-enriched microRNAs ranked highly among serum small extracellular vesicle microRNAs from acute liver injury and chronic liver injury model mice
Comparison of the potential ALI and CLI serum sEV miRNA signatures to HLDrelated circulating miRNAs
To explore the biological significance of the ALI and CLI serum sEV miRNA signatures in HLDs, we performed a systematic review of abnormally expressed circulating miRNAs reported in various HLDs. In total, 299 and 257 studies were identified from PubMed (https://pubmed.ncbi.nlm.nih.gov) and Web of Science (http://apps.webofknowledge.com/) databases, respectively (Figure 6 A). Data were retrieved from 14 studies, including drug-induced liver injury[20], chronic hepatitis B[21 -25], chronic hepatitis C[21 ,25 -27], nonalcoholic fatty liver disease[28], nonalcoholic steatohepatitis[23], liver cirrhosis[24 ,29 ,30] and HCC[21 -24 ,28 -33] studies. Details on the 14 articles are summarized in Supplementary Table 7 .
In total, 269 nonredundant abnormally expressed circulating miRNAs related to HLDs were extracted, and those that appeared ≥ four times were defined as highfrequency miRNAs (Figure 6 A). Of the 30 high-frequency miRNAs (Supple mentary Table 7 ), 23 miRNAs were detected in ALI and CLI serum sEVs (Figure 6 B),14 miRNAs overlapped with ALI and CLI serum sEV signatures, and 12 miRNAs showed the same expression trend. Of the 12 miRNAs, three miRNAs (miR-122 -5 p,miR-192 -5 p, and miR-22 -3 p) were identified as being increased in both ALI and CLI mice and thus have the potential to serve as common signatures for either ALI or CLI.The other 9 miRNAs were identified as ALI signatures (miR-21 a-5 p, miR-92 a-3 p, miR-194 -5 p, miR-17 -5 p and miR-19 b-3 p were increased; miR-451 a, miR-27 a-3 p, miR-26 a-5 p,and miR-223 -3 p were decreased) and may reflect acute or active liver injury(Figure 6 C). In addition, it was noteworthy that the four high-frequency circulating miRNAs reported in HLDs with decreased levels all exhibited decreased levels in serum sEVs upon ALI.
Serum sEVs from liver injury mice induced hepatic macrophage reprogramming
Primary mouse hepatic macrophages were isolated, purified and incubated with SYTO-labeled serum sEVs. After 24 h, green fluorescence was observed in most macrophages in both the control and ALI (2 D) serum sEV incubation groups(Figure 7 A). These observations indicated that serum sEVs could be taken up by hepatic macrophages. Serum sEVs from ALI mice (2 D) accelerated the adhesion of hepatic macrophages (Figure 7 B). As determined by quantitative real-time polymerase chain reaction, normal serum sEVs increased M1 -like gene (IL-1BandTNFA)expression and decreased the expression of some M2 -like genes (IL-10 RB, CD163 ,ARG1and CD206 ); ALI serum sEVs showed similar effects. However, compared to normal serum sEVs, ALI serum sEVs tended to decrease M1 -like IL-1Bbut increase M2 -like CD163 gene expression (Figure 7 C).
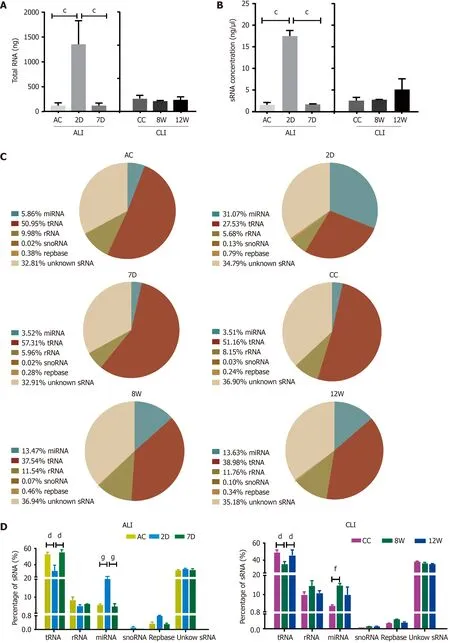
Figure 3 Annotations of small RNA in serum small extracellular vesicles from acute liver injury and chronic liver injury mice. A: Total RNA in serum small extracellular vesicles (sEVs) compared with the 2 D group, cP < 0 .001 ; B: Small RNA (sRNA) concentrations in serum sEVs compared with the 2 d group, cP < 0 .001 ; C: Representative pie charts depicting the annotated sRNA species and their proportions in the different groups; D: Statistical analysis of sRNA species in sEVs. Compared with the 2 d group, dP < 0 .0001 ; compared with the 8 wk group, fP < 0 .01 , gP < 0 .0001 . D: Day; W: Week; AC: Acute liver injury control;CC: Chronic liver injury control; ALI: Acute liver injury; CLI: Chronic liver injury; miRNA: MicroRNA; snoRNA: Small nucleolar RNA.
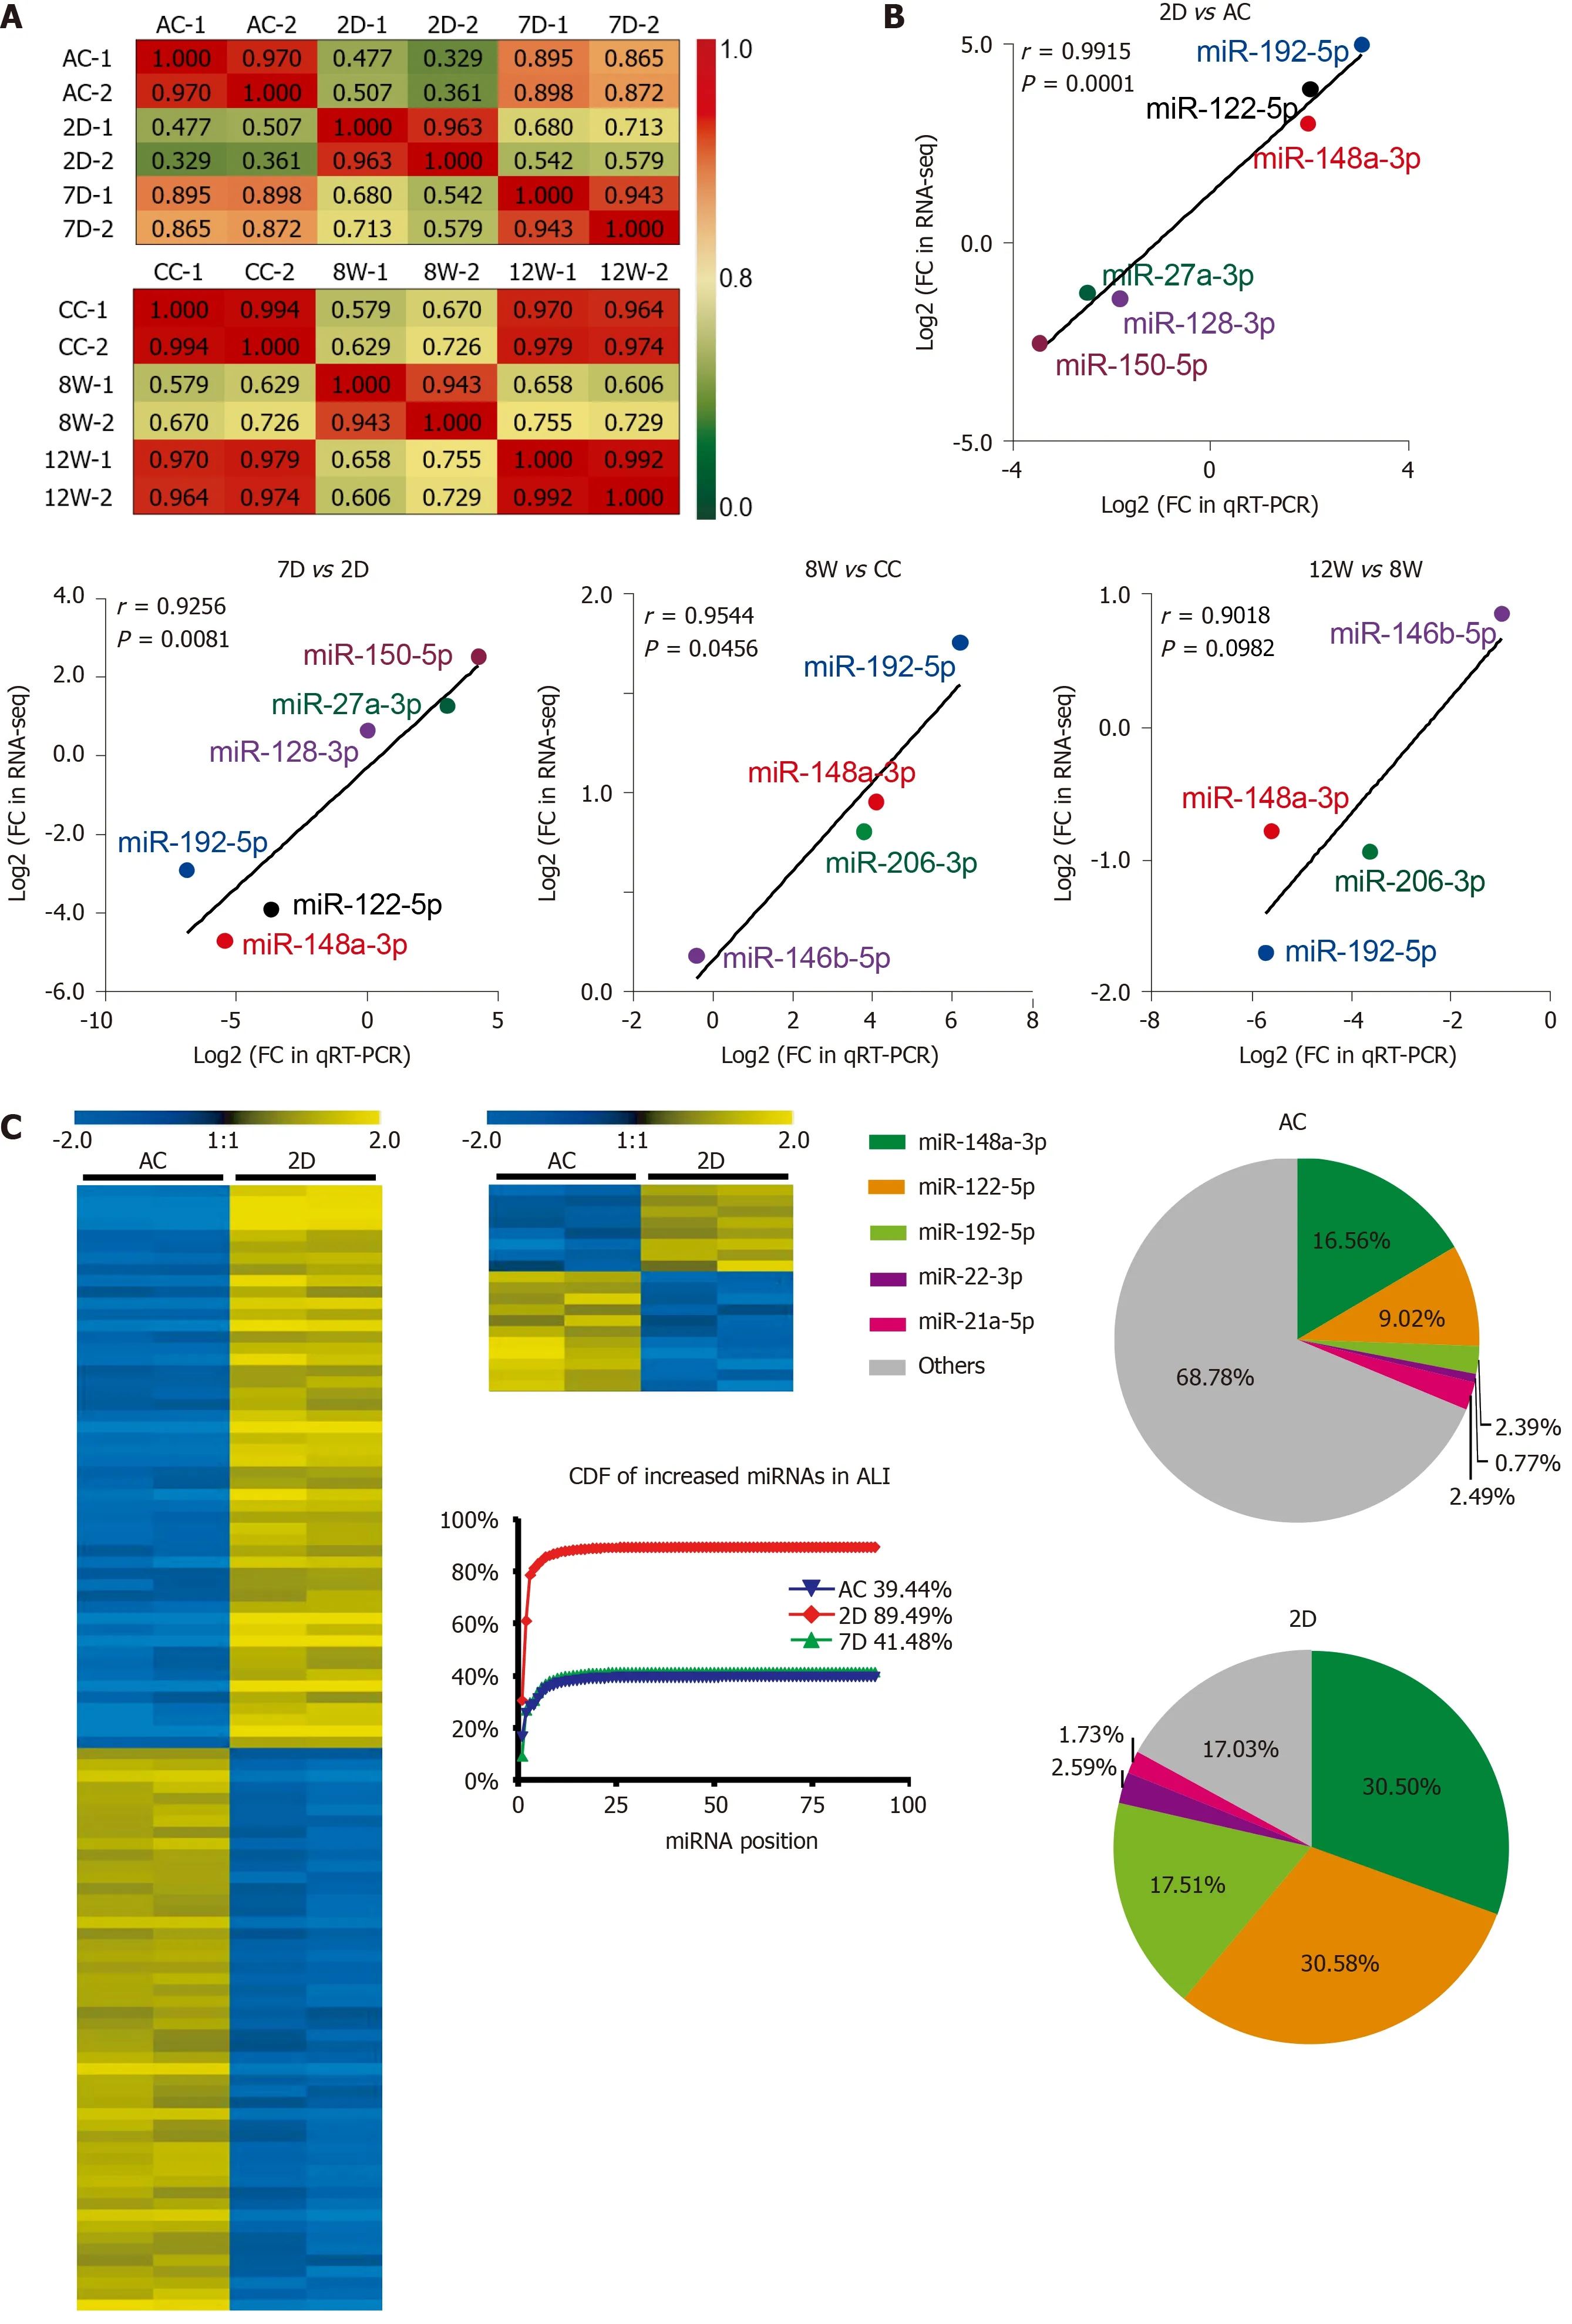
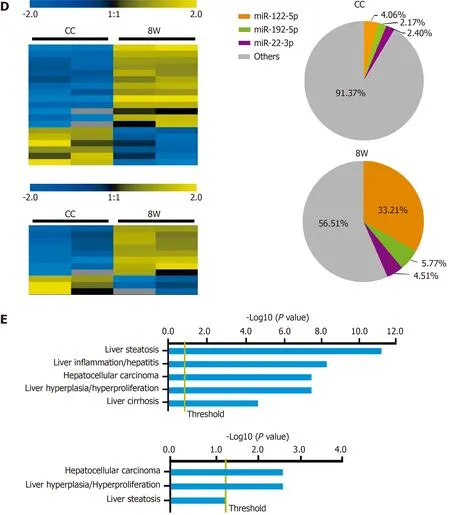
Figure 4 Differentially expressed microRNAs in serum small extracellular vesicles from acute liver injury and chronic liver injury mice and their biological significance. A: Pearson correlation coefficients between samples from acute liver injury (ALI) and chronic liver injury (CLI). The correlation coefficient values are labeled in the heat map; red or green represents high or low correlation, respectively; B: Validation of RNA sequencing data by quantitative realtime polymerase chain reaction for microRNAs (miRNAs) from ALI and CLI; C: Heatmap for the differentially expressed miRNAs in the ALI injury stage (2 d vs ALI control) and recovery stage (7 d vs ALI control), a cumulative distribution frequency plot for the increased miRNAs in ALI, and pie charts illustrating the proportions of the top five upregulated miRNAs in the ALI control and 2 d groups; D: Heatmap for the differentially expressed miRNAs in the CLI injury stage (8 wk vs CLI control)and recovery stage (12 wk vs CLI control). The pie charts illustrate the proportions of the top three upregulated miRNAs in the CLI control and 8 wk groups; E: The top hepatotoxicity processes related to the differentially expressed serum sEV miRNAs in ALI (top) and the differentially expressed serum sEV miRNAs in CLI (bottom)cataloged by Ingenuity Pathway Analysis-Tox function analysis. D: Day; W: Week; AC: Acute liver injury control; CC: Chronic liver injury control; ALI: Acute liver injury;CDF: Cumulative distribution frequency; qRT-PCR: Quantitative real-time polymerase chain reaction; FC: Fold change; RNA-seq: RNA sequencing; miRNA:MicroRNA.
In order to further dissect the effects of ALI serum sEVs on monocyte-derived and resident hepatic macrophage subgroups, multiple-color flow cytometric analyses were performed to assess the expression of M1 -like CD86 and M2 -like CD206 in CD11 b+F4 /80 Low monocyte-derived and CD11 b+F4 /80Highresident macrophages (Tacke and Zimmermann[34] and our unpublished data). ALI serum sEVs decreased both CD86 and CD206 expression in the CD11 b+F4 /80 Low subgroup but increased CD206 expression in the CD11 b+F4 /80 High subgroup (Figure 7 D and E). These findings indicated that ALI serum sEVs might induce depolarization of CD11 b+F4 /80Lowmonocyte-derived macrophages but M2 differentiation of CD11 b+F4 /80Highresident macrophages.
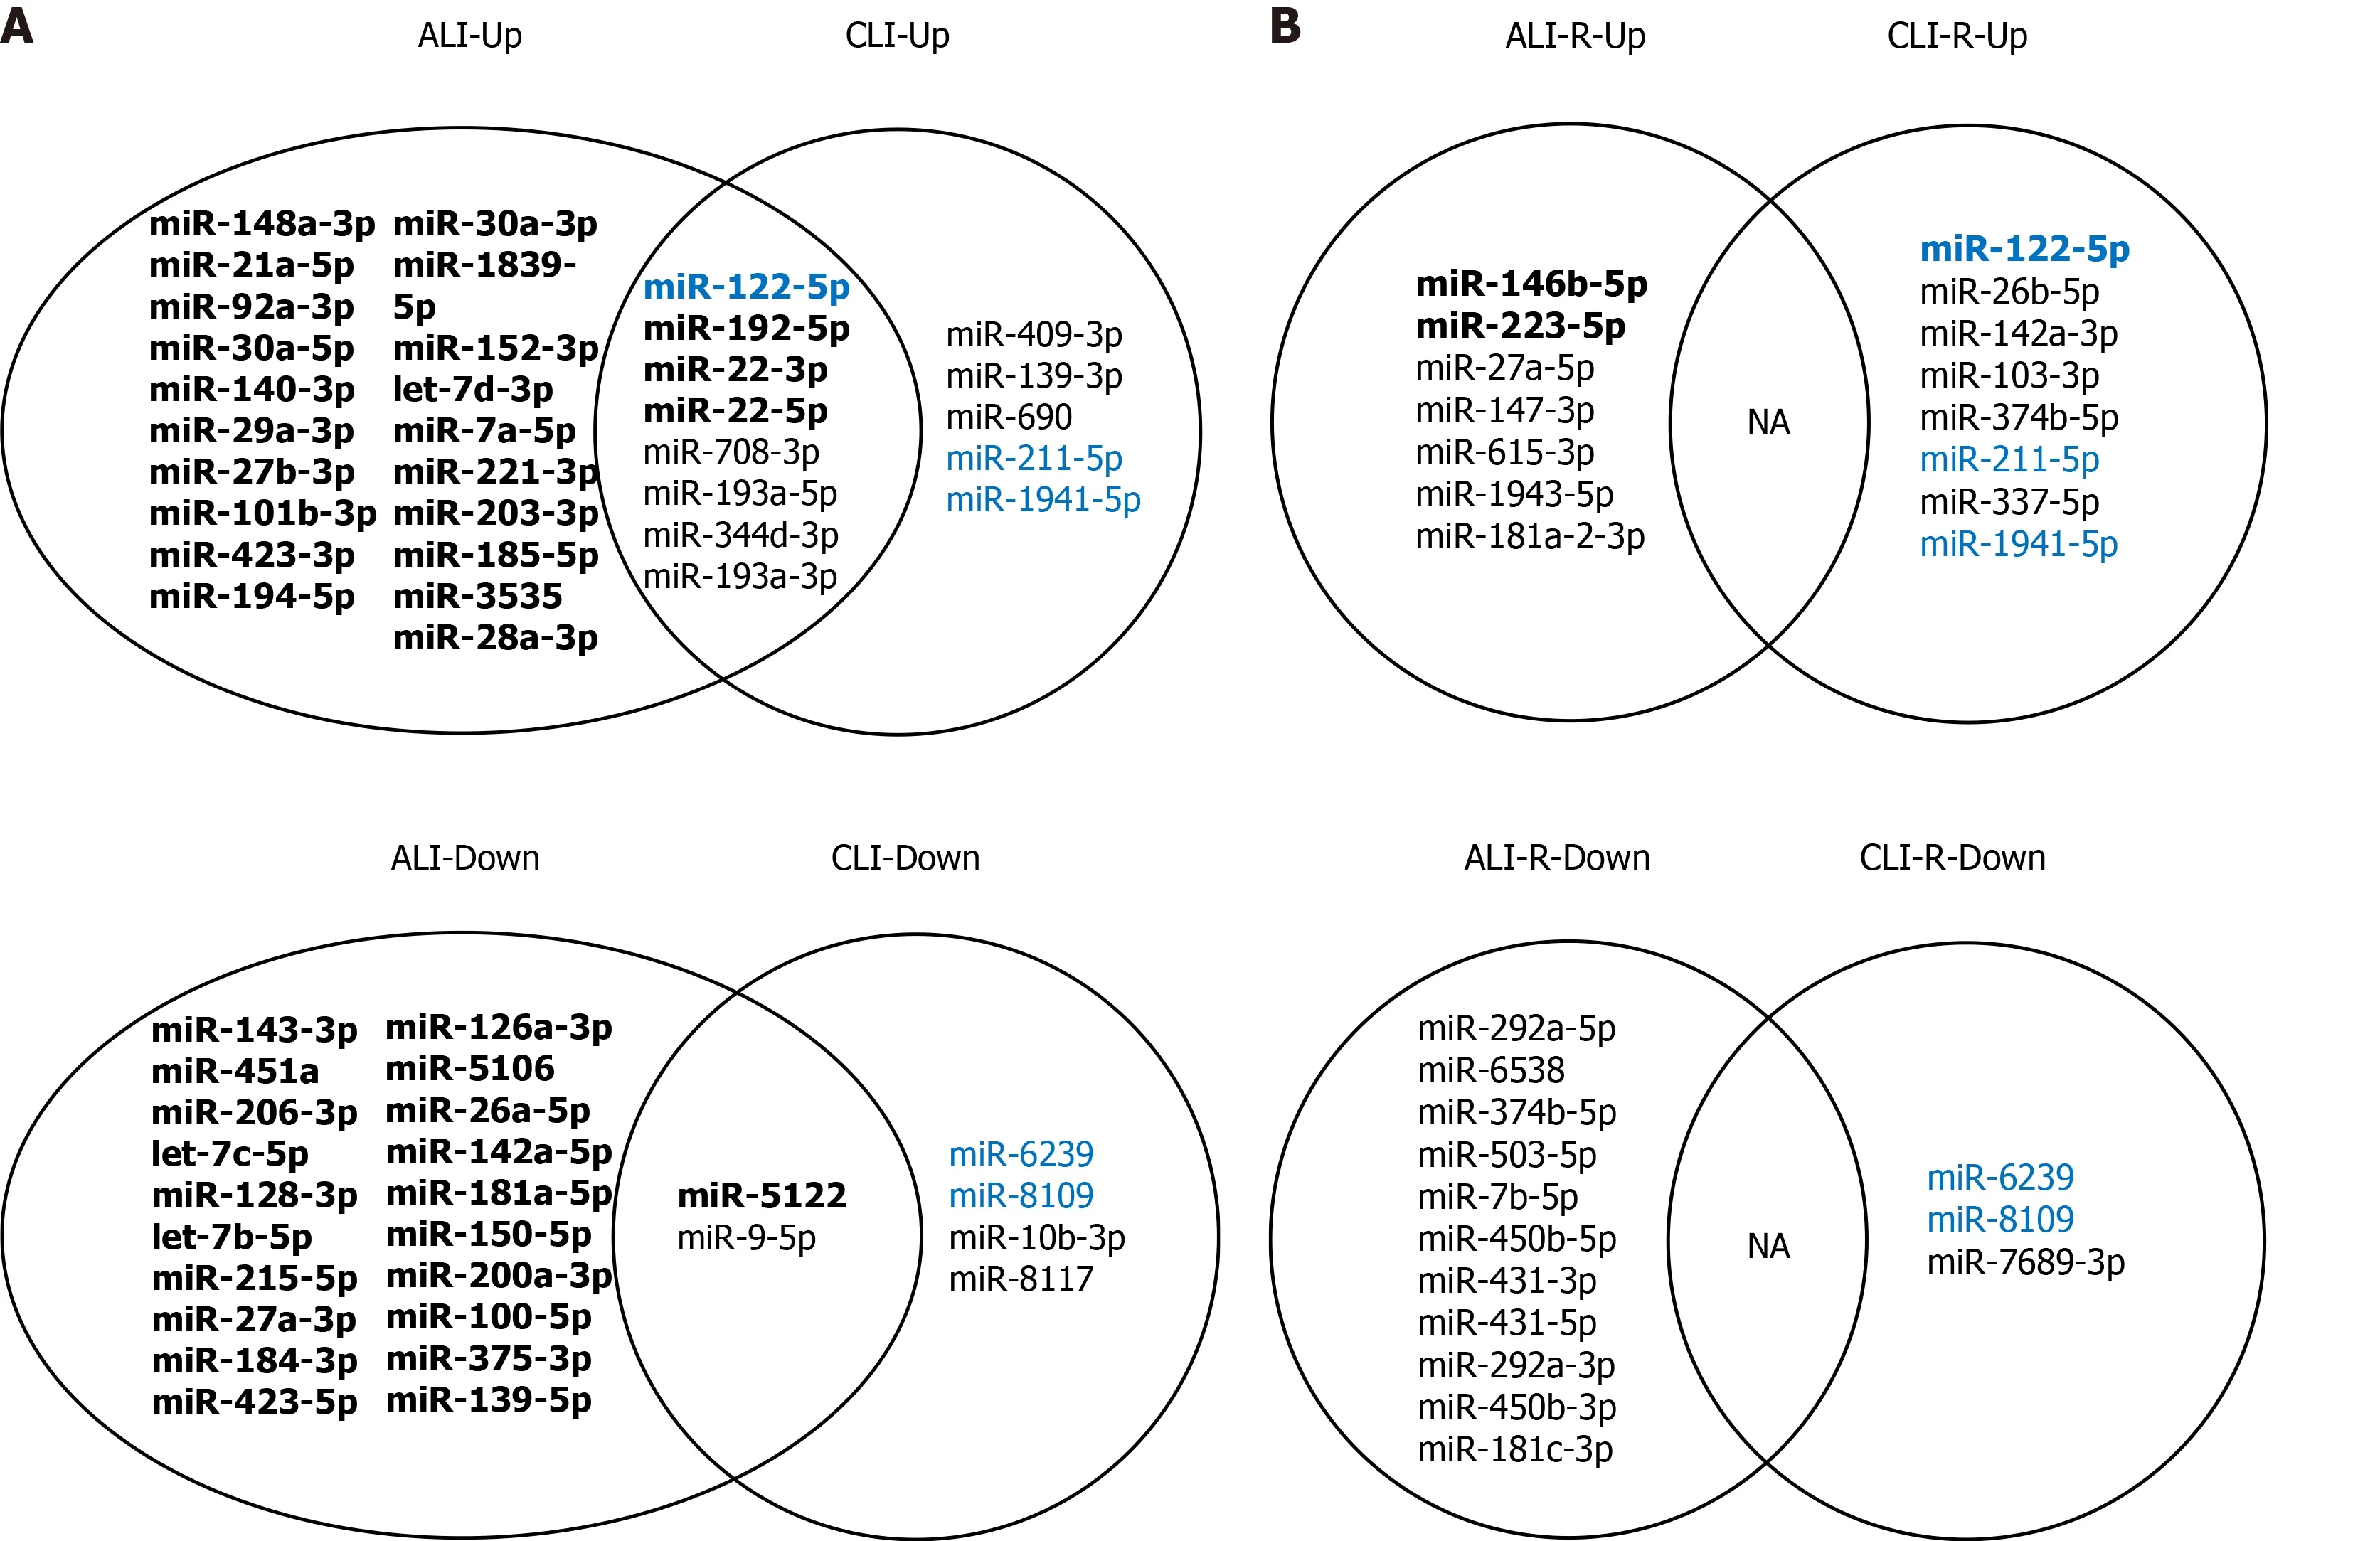
Figure 5 Common and specific microRNAs for acute and chronic liver injury and recovery in mouse models. A: Common and specific microRNAs (miRNAs) for acute and chronic liver injury; B: Common and specific miRNAs for the recovery stages of acute and chronic liver injury. Bold font:Transcripts per million reads Mean > 1000 ; Blue font: Overlapping microRNAs in injury and recovery; NA: Not applicable; ALI: Acute liver injury; CLI: Chronic liver injury; ALI-R: Acute liver injury recovery; CLI-R: Chronic liver injury recovery.
DISCUSSION
A growing number of studies have suggested the diagnostic value of serum sEV content for liver injury, especially miRNAs[6 ,8]. To explore potential serum sEV miRNA biomarkers for liver injury, we simulated the complex processes of liver injury and recovery in CCL4-induced ALI and CLI mouse models. The 2 D group and 8 W group represented ALI and CLI, respectively, while the 7 D group and 12 W group represented the recovery stage of ALI and CLI, respectively. The ALT and AST levels elevated in the 2 D group and 8 W group and returned to the baseline of the control groups (Figure 1 B and D). Moreover, the histological changes also reversed in the 7 D and 12 W recovery groups (Figure 1 C and E), which indicated that the ALI and CLI and recovery models were well established.
Unexpectedly, aside from differentially expressed miRNAs, we found that the concentration, size and morphology of serum sEVs might be essential features in liver injury (Figure 2 ). The number of serum sEVs increased upon ALI, which has been reported in human alcoholic hepatitis and alcoholic liver injury mouse models[35 -37].Furthermore, we found sustained decreases in serum sEV number during the chronic injury stage and the recovery stage for both ALI and CLI. Moreover, serum sEVs became smaller upon ALI but enlarged during ALI recovery and the CLI stage, and the increased size persisted through the CLI recovery stage, at which time there were multiple peaks, as observed by NTA. Interestingly, aggregation of serum sEV particles was observed in samples from the ALI recovery stage, CLI stage and CLI recovery stage by TEM, which explained the multiple peaks and increased particle size found by NTA. We propose that the aggregation of sEVs might reflect membrane damage of extracellular vesicles following liver injury. Thus, changes in serum sEV concentration,size, and morphology are well connected to a particular stage of liver injury and could provide diagnostic clues. In addition,the changes in serum sEVs persisted even when liver function and visible histopathological changes were restored; thus, they could be useful to trace recent liver injury.
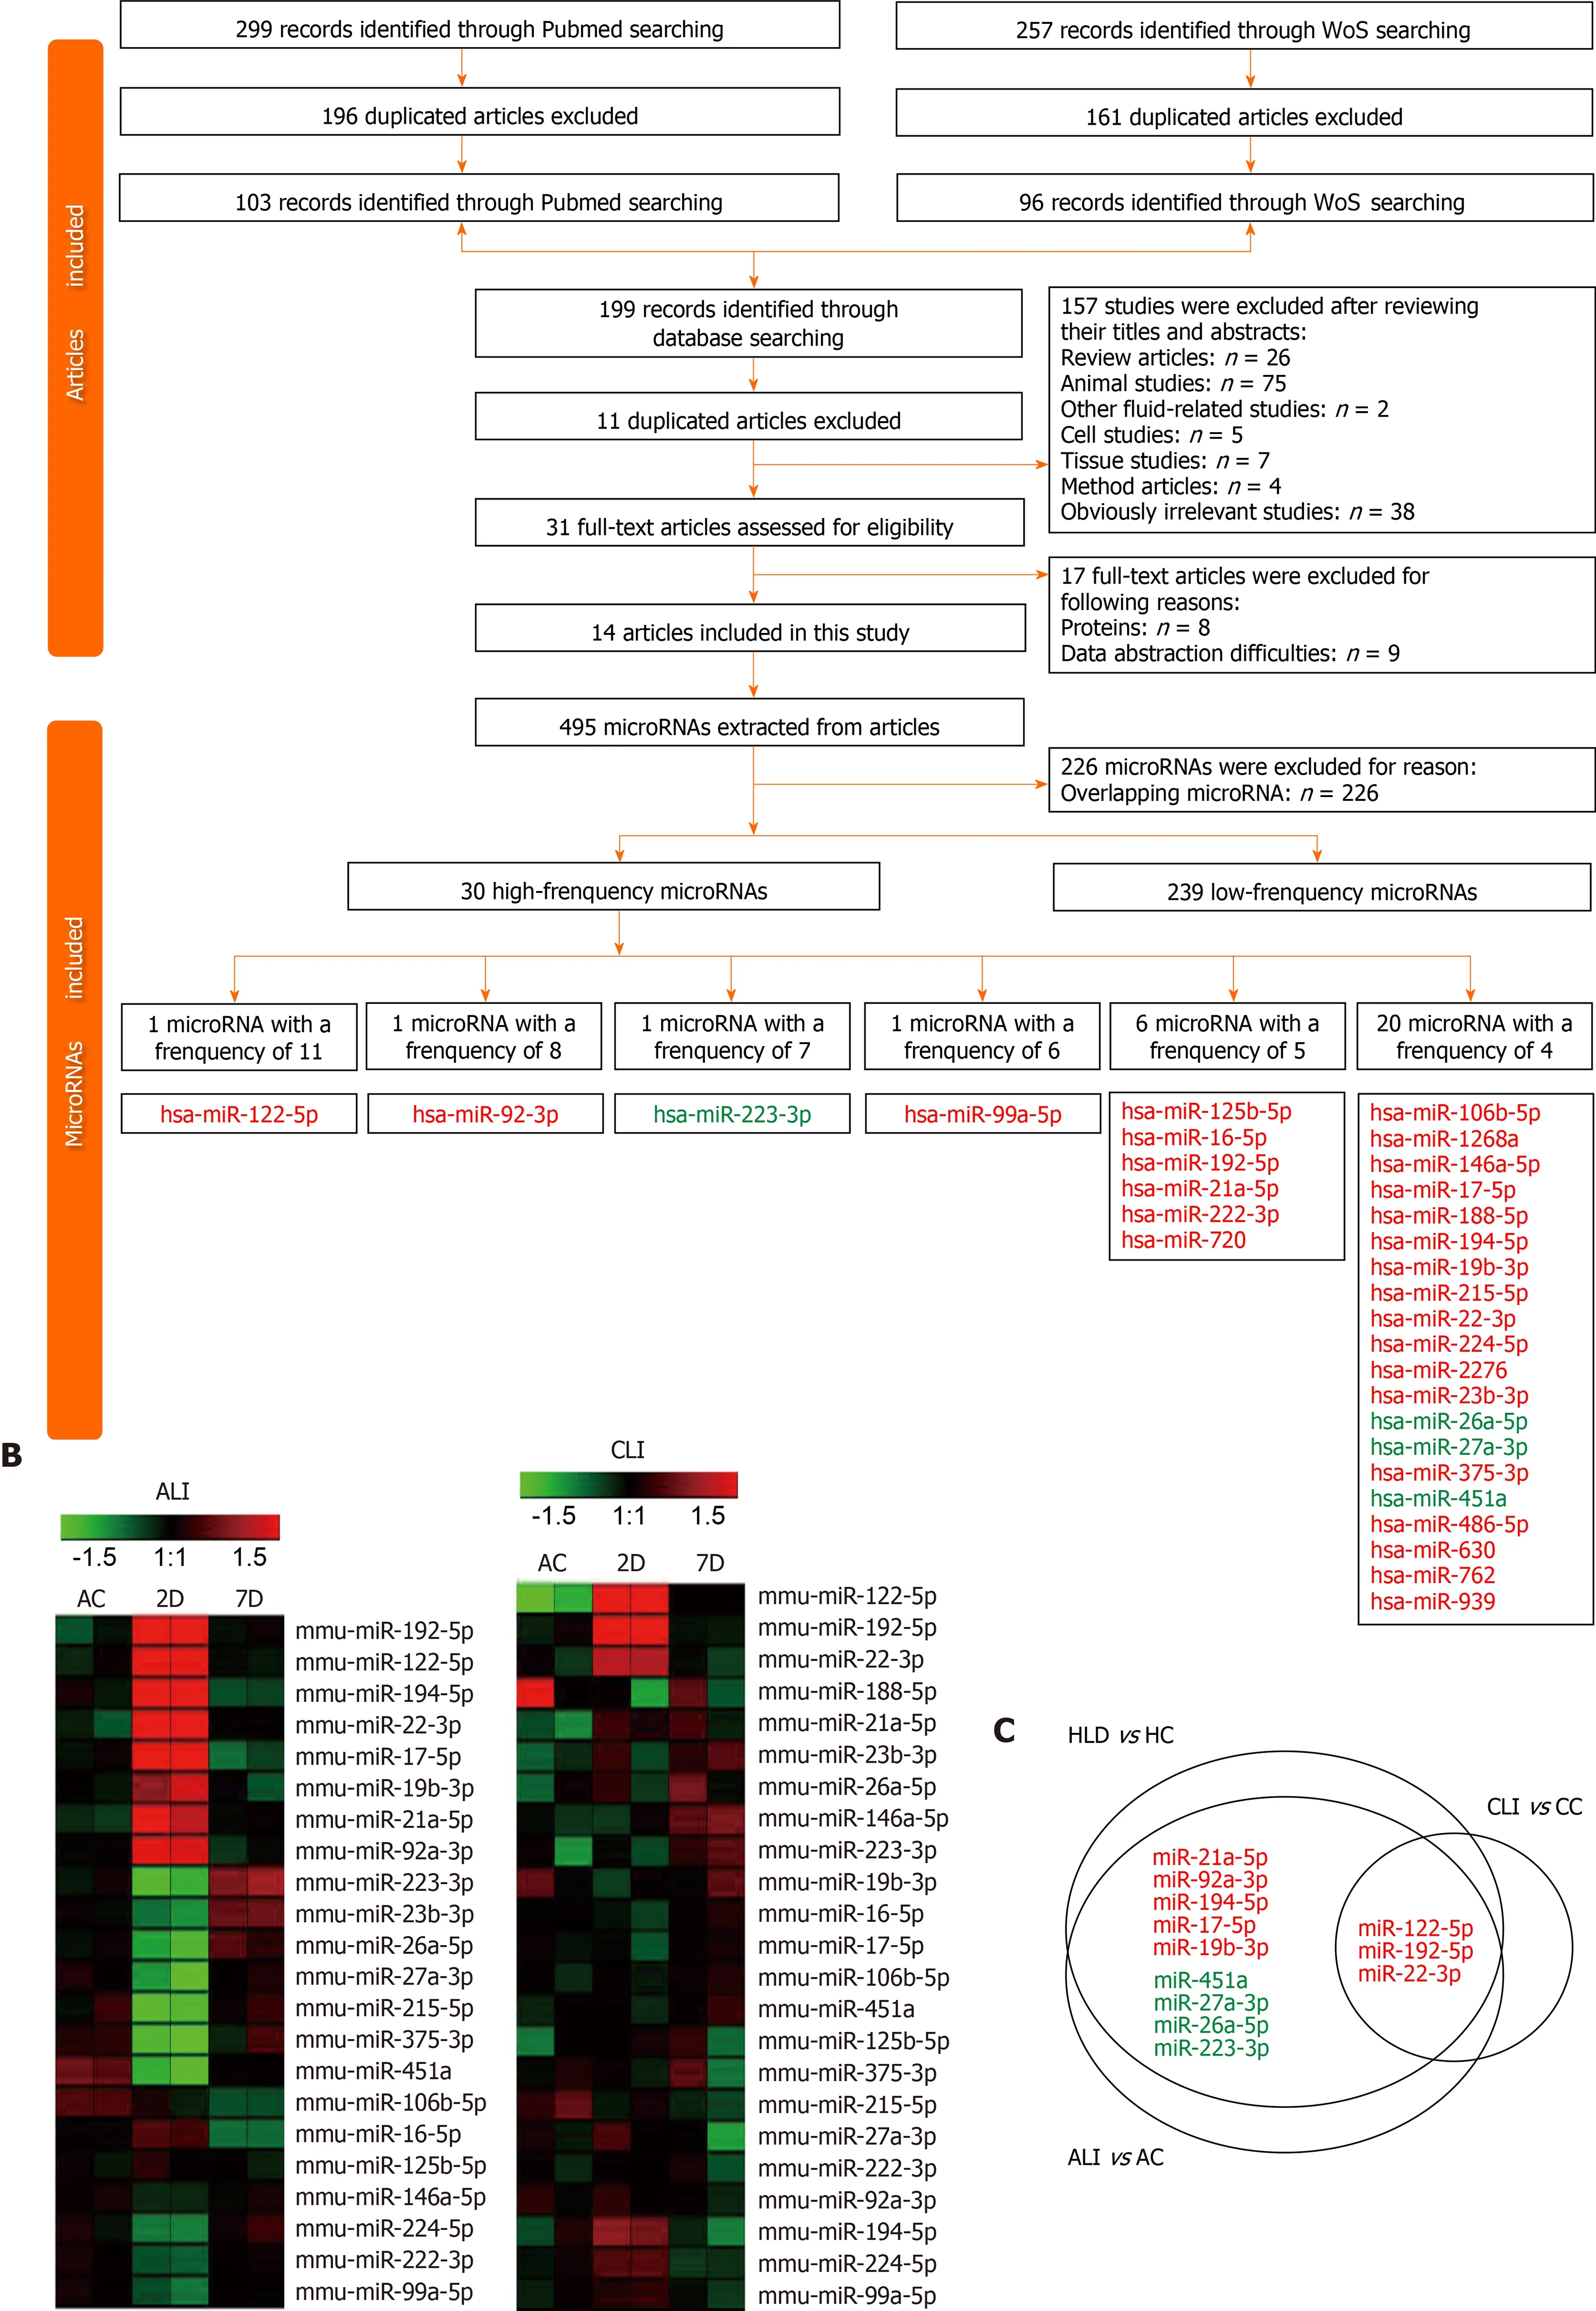
Figure 6 Differentially expressed circulating microRNAs in human liver disease and common microRNAs in mice. A: Flow chart of study selection and microRNA (miRNA) screening; B: Heatmap for the expression of high-frequency human liver disease (HLD)-related circulating miRNAs in acute liver injury (ALI) and chronic liver injury (CLI) serum small extracellular vesicles (sEVs); C: Common miRNAs in the serum sEVs from mice with ALI and CLI and in the circulation in the context of HLDs. Red font: Upregulated miRNAs; Green font: Downregulated miRNAs; HC: Healthy control; AC: Acute liver injury control; CC:Chronic liver injury control; WoS: Web of Science; D: Day; W: Week.
Then, we showed that ALI and CLI altered the sRNA levels and components in serum sEVs. For ALI, both the total RNA and sRNA levels of serum sEVs increased significantly, and the proportion of miRNAs in sRNA also increased. Although there were no significant increases in RNA or sRNA levels for CLI, the proportion of miRNAs increased significantly. Compared to CLI, ALI significantly changed more miRNA species (176 vs 19 , fold change ≥ 2 .0 , P < 0 .05 ). The increased proportion of miRNAs upon liver injury was mainly attributable to a few highly abundant miRNAs.To traceback the primary source of the increased serum sEV miRNAs, the highly abundant miRNAs detected in serum sEVs from ALI and CLI mice were evaluated in the livers of normal male C57 BL/6 mice. The miRNAs with the highest abundance were all liver-enriched miRNAs (Table 1 ). We propose that the liver is the main contributor to the elevations in miRNAs in serum sEVs for both ALI and CLI. Thus,serum sEVs carry the miRNA messages released from the injured liver, and examining the serum sEV miRNAs could be a reliable way to monitor either ALI or CLI.
By comparing the expression profiles of serum sEV miRNAs in various stages of ALI and CLI, we obtained a list of miRNAs that can be used as common liver injury signatures as well as the miRNA signatures for ALI, CLI and the recovery stages.However, these signatures were obtained from mouse models and need to be validated in human patients. Hence, we carried out a systematic review of previously published studies and obtained 30 miRNAs that were highly correlated with HLD,including drug-induced liver injury, chronic hepatitis B, chronic hepatitis C,nonalcoholic fatty liver disease, nonalcoholic steatohepatitis and liver cirrhosis(Figure 6 ). Of these 30 miRNAs, 3 miRNAs (miR-122 -5 p, miR-192 -5 p and miR-22 -3 p)were identified as common injury signatures that were increased in both ALI and CLI mice. Although these three miRNAs have been studied separately[24 ,36 ,38 ,39], here,for the first time, they were combined as a universal signature for either ALI or CLI.Nine miRNAs were identified as ALI signatures. Along with the five increased miRNAs (miR-21 a-5 p, miR-92 a-3 p, miR-194 -5 p, miR-17 -5 p and miR-19 b-3 p), four miRNAs were decreased (miR-451 a, miR-27 a-3 p, miR-26 a-5 p and miR-223 -3 p): the same four miRNAs that are frequently reported to be decreased in HLD (Figure 6 ).Although the human data were mostly from patients with CLI, the overlapping ALI signatures might reflect active lesions. Based on serum sEV miRNAs, we established common signatures for liver injury and specific signatures for acute/active liver injury.
The biological significance of the alterations in sEV miRNAs upon liver injury was explored by Ingenuity Pathway Analysis. The top hepatotoxicity-related functions of the altered serum sEV miRNAs in ALI were hepatic steatosis and liver inflammation,while the altered miRNAs carried by serum sEVs from CLI were linked primarily to HCC, followed by liver hyperplasia. These findings are consistent with the clinical findings that ALI mainly causes inflammation and that sustained damage increases the risk of carcinoma[40 ,41]. Hepatic steatosis reflects fatty degeneration that is typically caused by CCL4[42]. These findings reveal the pathological importance of serum sEVs during the processes of ALI and CLI.
It has been reported that hepatic macrophages can take up serum sEVs and play essential roles in the clearance of intravenously injected sEVs from the systemic circulation[43 ,44]. We were interested in determining the effects of liver injury-related serum sEVs on hepatic macrophages and whether these effects could aggravate liver damage or play a protective role. We found thatin vitro, ALI serum sEVs could be taken up by hepatic macrophages and promote macrophage adhesion. Furthermore,ALI serum sEVs tended to decrease M1 -like gene expression, such as IL-1BandTNFAexpression, and increase M2 -like gene expression, including CD163 expression.However, the trends were not consistent. Considering that hepatic macrophages are heterogeneous populations composed of two subgroups, including resident macrophages and circulating monocyte-derived macrophages[34], we propose that macrophages of different origins might react inconsistently to ALI serum sEVs. The expression of M1 (CD86 ) and M2 (CD206 ) polarization signatures on the two subgroups of hepatic macrophages was examined by flow cytometry. ALI serum sEVs induced depolarization of CD11 b+F4 /80Lowmonocyte-derived macrophages but induced M2 differentiation of CD11 b+F4 /80Highresident macrophages. We propose that the changes in serum sEVs upon ALI might alleviate liver damage by depolarizing monocyte-derived macrophages and educating resident hepatic macrophages to transform into M2 -like cells.
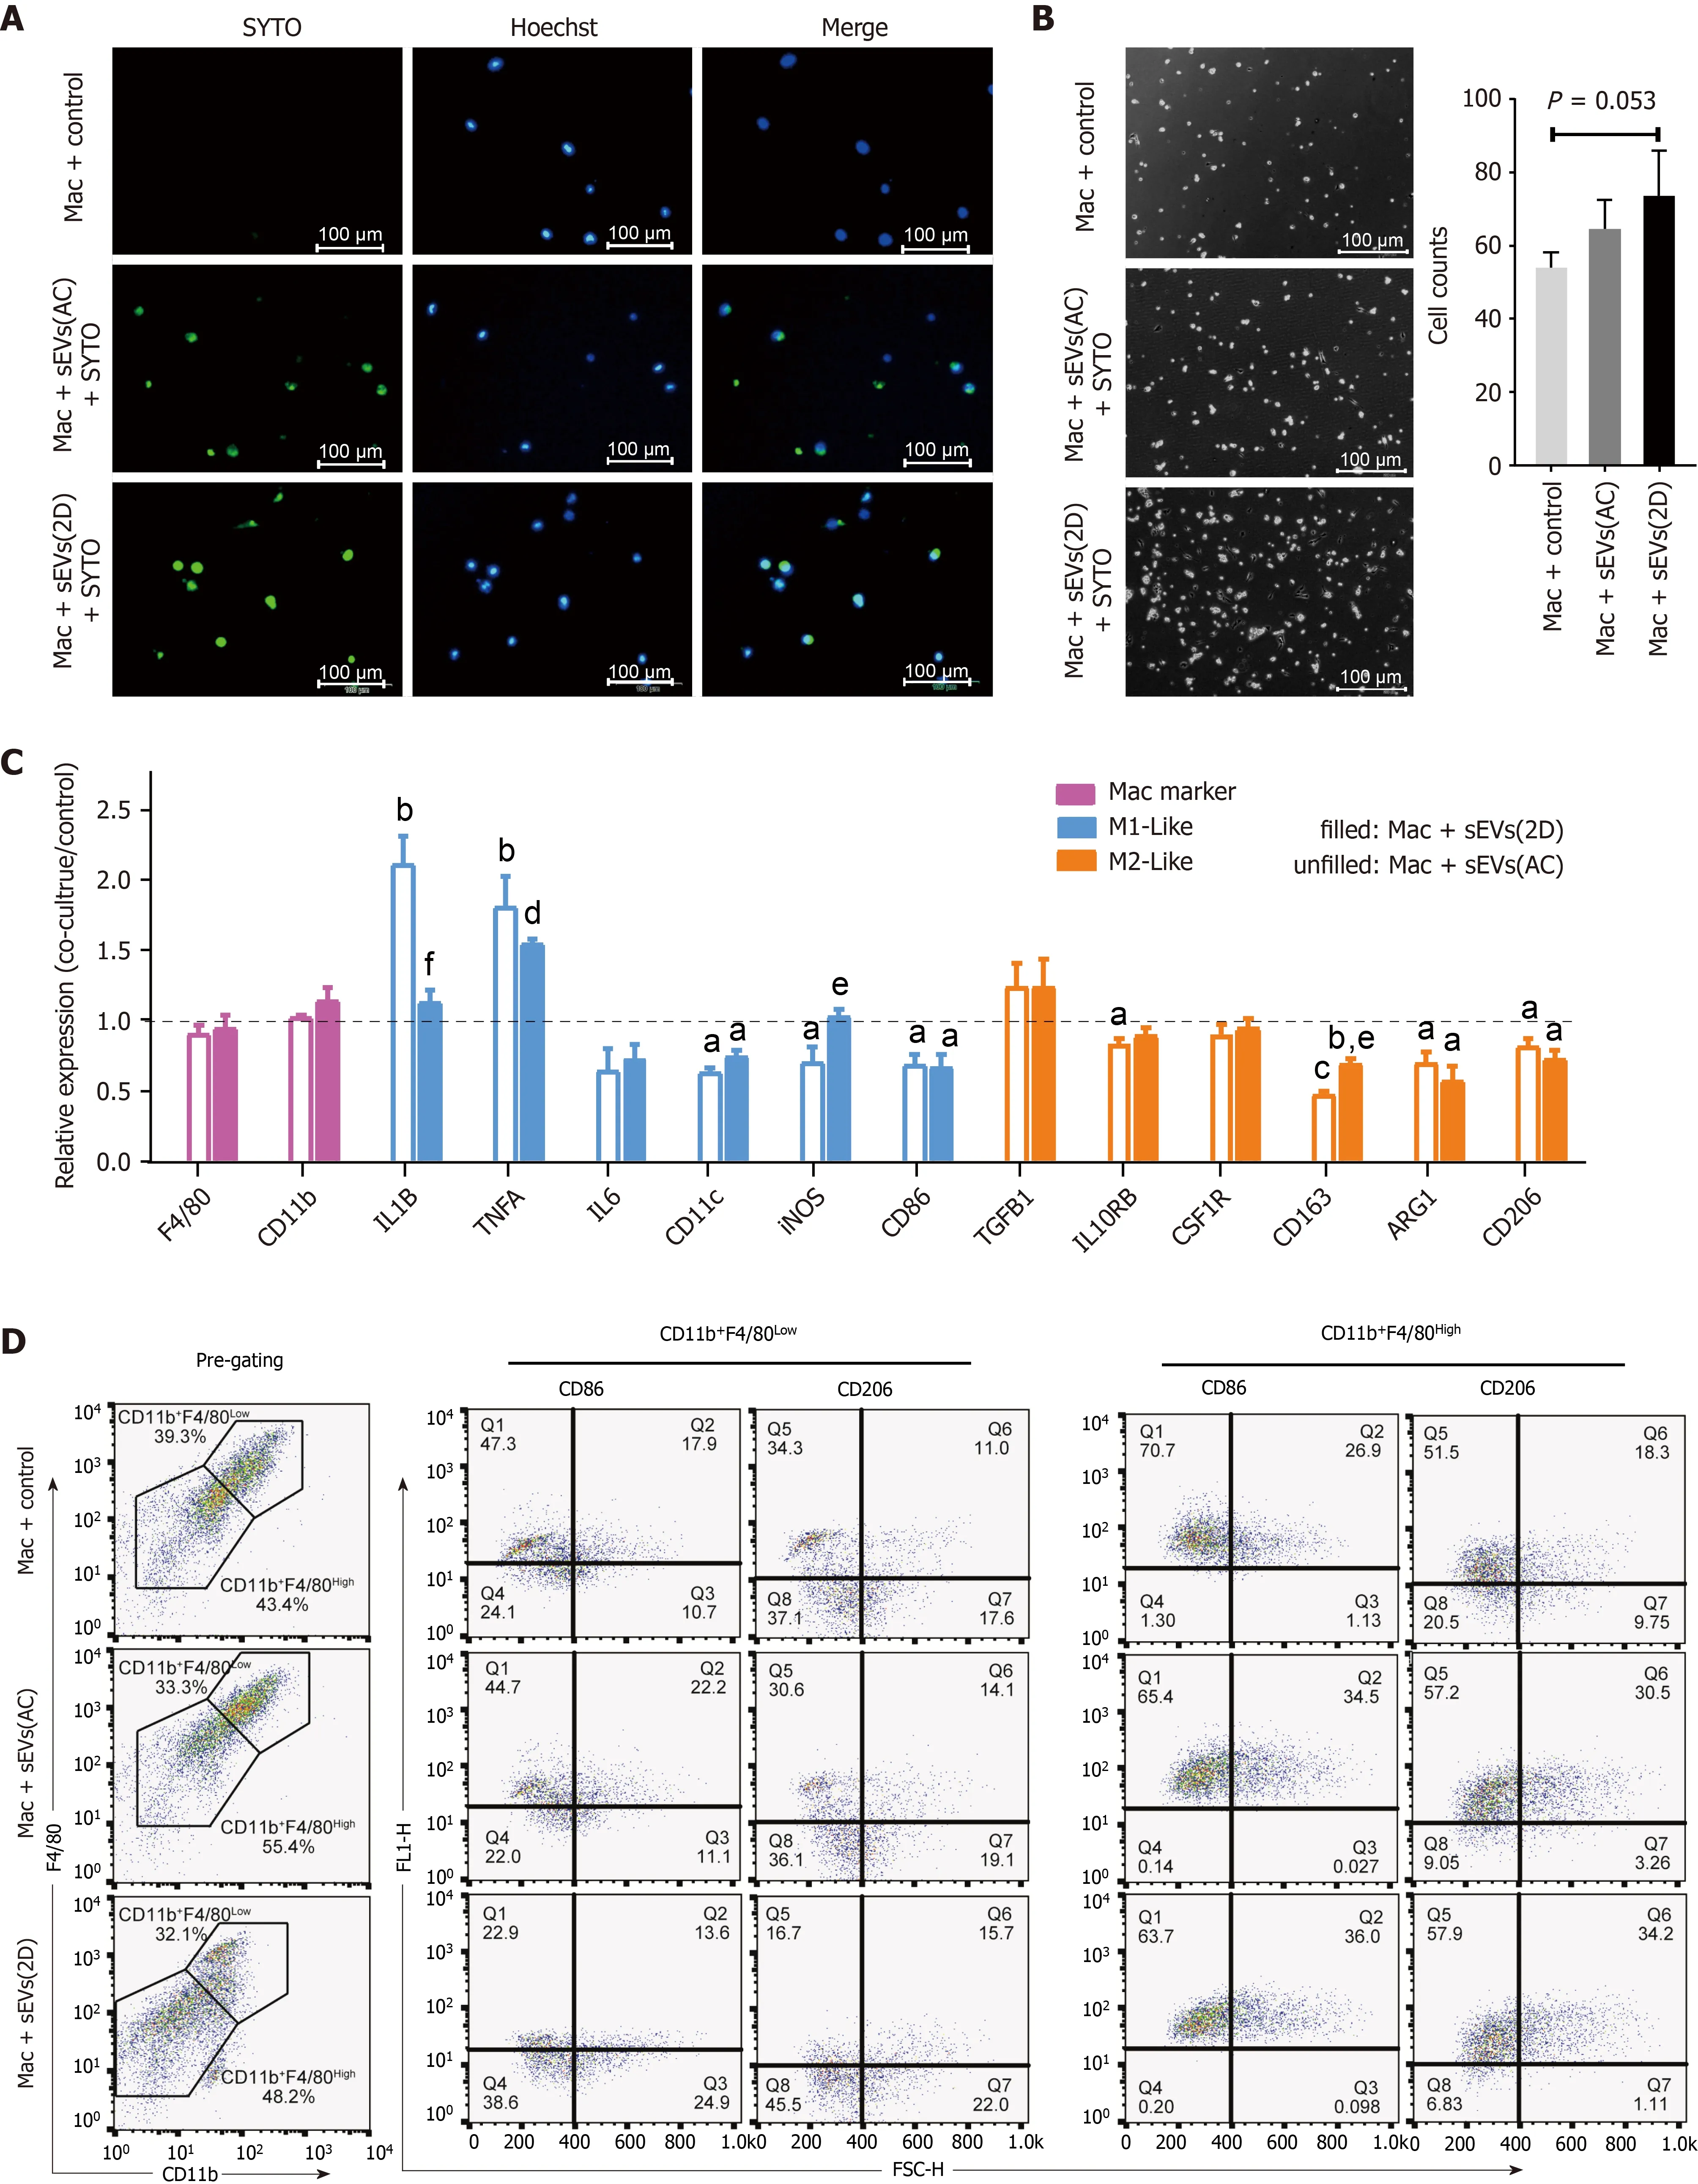
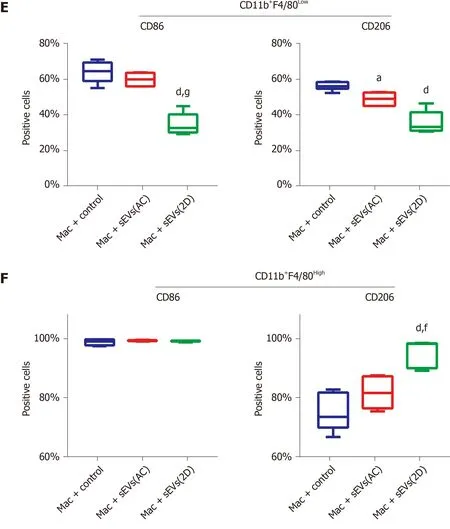
Figure 7 Uptake of serum small extracellular vesicles by hepatic macrophages and subsequent reprogramming. A: Uptake of SYTO-labeled serum small extracellular vesicles (sEVs) from normal (AC) or acute liver injury (ALI) (2 D) mice by primary hepatic macrophages; B: Hepatic macrophages were incubated with AC or 2 D serum sEVs for 24 h. The number of attached cells per 200 × field is shown; C: Expression of M1 - and M2 -like cell surface markers and cytokines in hepatic macrophages incubated with mice serum sEVs. The unfilled column represents macrophages incubated with AC sEVs, and the filled column represents macrophages incubated with 2 D sEVs. Compared with the untreated control group, aP < 0 .05 , bP < 0 .01 , cP < 0 .001 , dP < 0 .0001 ; compared with the AC sEV treatment group, eP < 0 .05 , fP < 0 .01 ; D: Macrophages were defined as CD11 b+F4 /80 Low and CD11 b+F4 /80 High subgroups. The representative images show the percentage of CD86 -and CD206 -positive cells in each subgroup subjected to the control, AC sEV and 2 D sEV treatments; E: CD86 - and CD206 -positive cells in each subgroup. Compared with the control group, aP < 0 .05 , dP < 0 .0001 ; compared with the AC sEV treatment group, fP < 0 .01 , gP < 0 .0001 . Scale bar = 100 μm. Mac:Macrophage; D: Day; AC: Acute liver injury control; sEVs: Small extracellular vesicles.
CONCLUSION
In conclusion, we found that the concentration, size and morphology of serum sEV particles were essential features for liver injury. We established specific serum sEV miRNA signatures for different liver injury stages and created a list of miRNAs that can be used as common liver injury biomarkers. The altered ALI and CLI serum sEV miRNAs were connected to diverse liver pathological processes. ALI serum sEVs reprogrammed hepatic macrophage subgroups differently. Serum sEVs not only have good diagnostic potential but also could be used to ameliorate liver injury. However,the diagnostic and therapeutic potential of these altered serum sEVs upon liver injury deserves further study.
ARTICLE HIGHLIGHTS
ACKNOWLEDGEMENTS
The authors would like to acknowledge Shen Y for the statistical review.
 World Journal of Gastroenterology2021年43期
- World Journal of Gastroenterology的其它文章
- Survivin-positive circulating tumor cells as a marker for metastasis of hepatocellular carcinoma
- Minimum sample size estimates for trials in inflammatory bowel disease: A systematic review of a support resource
- Immunoglobulin G in non-alcoholic steatohepatitis predicts clinical outcome: A prospective multi-centre cohort study
- Genome-wide map of N6 -methyladenosine circular RNAs identified in mice model of severe acute pancreatitis
- Hepatitis B: Who should be treated?-managing patients with chronic hepatitis B during the immunetolerant and immunoactive phases
- Recent advances in artificial intelligence for pancreatic ductal adenocarcinoma