Serum vitamin E concentration is negatively associated with body mass index change in girls not boys during adolescence
Xiao-Dong Zang ·Qing-Hui Hu ·Xiao-Xu Liu ·Min Da ·Zhao-Cong Yang ·Ji-Rong Qi ·Xu-Ming Mo
Abstract
Background Vitamin E is the most abundant lipid-soluble antioxidants present in plasma; however, the relationship between serum vitamin E and change in body mass index (BMI)-for-age Z scores in adolescents has not been well described.
Methods This study is a cross-sectional study.Data were analyzed from 4014 adolescents who participated in the National Health and Nutrition Examination Survey.The nutritional status was calculated by BMI Z scores and was classified into normal weight, overweight, and obese.Multivariable-adjusted logistic regression was used to examine the association between serum vitamin E levels with overweight/obesity.Besides, the interaction effects between potential confounders and vitamin E on obesity were further evaluated.
Results After adjusting potential confounders, serum vitamin E levels were negatively associated with overweight/obesity in girls but not in boys.Per standard deviation increment in vitamin E concentrations was associated with a 92% decreased risk of obesity in females.Besides, lower quartiles of serum vitamin E were associated with a higher risk of overweight/obesity in girls.Moreover, the inverse association between serum vitamin E levels and obesity was also found in most subgroups through subgroup analysis.
Conclusions Our study supports the negative association between serum vitamin E levels and overweight/obesity in adolescents.A higher serum vitamin E level may be associated with a reduced probability of obesity in girls, but not in boys.
Keywords Adolescent health ·Body mass index Z scores ·Obesity ·Overweight ·Vitamin E
Introduction
Childhood obesity is a severe global public health challenge,with more than 170 million children categorized as obese[1– 4].Obesity in adolescents is a significant risk factor contributing to obesity-induced diseases, including diabetes,hypertension, and dyslipidemia [5, 6].However, practical approaches to preventing obesity development in children remain limited.
Causes of childhood obesity are a multifactorial health problem resulting from genetic, environmental, and lifestyle variables, and nutritional factors.The deficiency of one or various vitamins and minerals may be a risk factor for the development of childhood obesity [7, 8].Obese children were shown to have lower serum vitamin E and beta-carotene levels [9].Vitamin E is a lipid-soluble vitamin that cannot be synthesized in the body and plays a recognized role in protecting cellular components from oxidative damage [10, 11].Recently, vitamin E has been revealed to regulate the expression of genes involved in glucose and lipid metabolism [12, 13].Experimental animal studies have shown that adequate supplementation of vitamin E can help prevent obesity [14– 16].However, whether or not vitamin E is an effective medicine for preventing obesity is a matter of much dispute.In a randomized controlled trial, vitamin E supplementation for two months does not significantly affect lipid profiles and adiponectin levels in obese children [17].Therefore, the relationship between vitamin E and obesity is complicated and requires further investigation.
Recent data suggest that girls were more likely to develop obesity than boys among children [18, 19].However, the specific mechanism underlying this phenomenon is still unclear.Moreover, studies have shown that females had lower vitamin E concentrations, and higher serum triacylglycerols and insulin concentrations than males [20].Therefore, this evidence suggests that there may be a gender difference in both vitamin E metabolism and its effect on the development and progression of obesity.However,this phenomenon has not yet been reported anywhere in the literature.Hence, the primary objective of this study was to evaluate adolescents' serum vitamin E levels and their correlation with obesity.The second aim was to explore the gender-specific relationships between vitamin E and obesity.
Methods
Study population
The present study was performed as a cross-sectional descriptive study.Data were obtained from the National Health and Nutrition Examination Survey (NHANES,1999–2002), in which a stratified multistage probability sampling approach was used to enroll civilian, non-institutionalized adults, and children in the USA [21].The source population consisted of 4902 adolescents (12–19 years) at the time of examination.The exclusion criteria were age(under 12 and over 19 years), pregnancy, and those who took insulin or antidiabetic pills.We finally excluded 888 participants (finaln= 4014).This study was in accordance with Strengthening the Reporting of Observational Studies in Epidemiology guidelines for observational investigations.All the participants gave informed consent, and the study was approved by the Centers for Disease Control and Prevention Institutional Review Board.
Assessment of serum vitamin E
The serum concentration of vitamin E was measured using high-performance liquid chromatography with photodiode array detection (Waters Chromatography Division, Milford,MA, USA).A small volume (100 μL) of serum was mixed with an ethanol solution containing two internal standards.Then the micronutrients were extracted from the aqueous phase into hexane and dried under vacuum.The extract was redissolved in ethanol and acetonitrile.An aliquot of the filtrate was isocratically eluted with a mobile phase consisting of equal parts of ethanol and acetonitrile.The absorbance of these substances in solution is linearly proportional to concentration.Three wavelengths were simultaneously monitored, and chromatograms were recorded [22].More experimental details are available in the laboratory data of NHANES [22].
Definitions of outcomes
Body mass index (BMI)-for-ageZscores (BAZ) were calculated for all participants, who then were classified as obese,overweight, or normal weight, according to the World Health Organization (WHO) cutoff s.Normal weight was defined as a BAZ between -2 standard deviations (SD) and 1 SD;overweight as BAZ > 1 SD, and obesity as BAZ > 2 SD[23].2007 WHO growth standards for children at the age of 5–19 years were adopted to calculate the age-and sexspecific height-for-age, weight-for-age, and BAZ using the software WHO Anthro Plus for personal computers (version 1.0.3, 2010) [23].
Covariates
Detailed data and information on potential confounders associated with obesity were reported elsewhere [24].Variables were as follows: age (years), sex (male or female),race/ethnicity (non-Hispanic white, non-Hispanic black,Mexican American, or others), education levels (< high school, = high school, > high school), family poverty-income ratio (PIR).Self-reported cigarette use and serum cotinine cutoff were used to define smoking status: smokers included self-reported current smokers and those with serum cotinine levels > 10 ng/mL, and non-smokers were those who were not “current smokers” and those with serum cotinine levels ≤ 10 ng/mL [25].Alcohol drinking status was excluded because alcohol drinking status was only assessed among respondents over 20 years [24].
According to the National Cholesterol Education Program guidelines, standard cutoff values were used for levels of high-density lipoprotein cholesterol (HDL-C, < 35 mg/dL)[26], total cholesterol (TC, ≥ 200 mg/dL) [25], low-density lipoprotein cholesterol (LDL-C, ≥ 130 mg/dL) [27], glycated hemoglobin (GH, > 5.7%) [28], and fasting blood glucose(FBG, ≥ 100 mg/dL) [29] to define abnormal values [30– 33].Additionally, the abnormal value of the homeostasis model assessment of insulin resistance (HOMA-IR) was defined as ≥ 3.29 [24, 34, 35].
Statistical analysis
Sampling weights were used in all analyses to account for the complex survey design and clustering.We calculated the sample weight for 4 years of data from 1999 to 2002,where WT99-02 is the variable WTMEC4YR from the NHANES 1999–2000 and NHANES 2001–2002.Besides,statistical analysis was performed using the “survey” package for analysis of complex survey samples in R software(version 3.4.3).Baseline clinical characteristics were compared using population-weighted parametric and nonparametric tests.Multivariable logistic regression models were performed to evaluate the association between serum vitamin E and obesity/overweight.The implementation used was the svyglm() function in the R programming environment.The non-adjusted and multivariable-adjusted models were listed as follows: the crude model without any covariate adjustment; Model 1: adjusted for age (years), sex, race/ethnicity (non-Hispanic white, non-Hispanic blacks, Mexican Americans, and others); Model 2: model 1 plus family PIR, education levels, serum cotinine status; Model 3:model 2 plus TC, HDL-C, LDL-C, HOMA-IR score, GH,FBG, as the full model.Further analysis was conducted by categorizing vitamin E in quartiles based on the study sample's distribution (1st quartile: referent).Besides, the generalized additive model (GAM) was used to identify the non-linear relationship.According to the clinical cut point,continuous variables were converted into categorical variables and then performed an interaction test.ThePvalues for multiplicative interaction were assessed using a multiplicative interaction term in the multivariable logistic regression model.The subgroup analyses were performed using stratified logistic regression models.Due to its non-normal distribution, serum vitamin E was natural-log transformed for continuous analyses.SAS version 9.2 (SAS Institute Inc.Cary, NC, USA), Empower Stats ( www.empow ersta ts.com , X & Y solutions, Inc., Boston, USA), and the statistical software packages R 3.4.3 ( http://www.R-proje ct.org ,The R Foundation) were used for all statistical analyses and the NHANES complex sample design and weights.Code is available online ( https://datad ryad.org/stash/share/yv7_feGNG HkA_ k3yq6 EHrO3 YMxqz 0TNCh veSHG-mtAg ).
Results
General characteristics of the study participants
The final study population included 4014 patients, 2039 men, and 1975 women (Fig.1).The participants' average age was 15.42 ± 0.05 years.Baseline characteristics are listed in Table 1.Among these subjects, the prevalence of normal weight, overweight, and obesity in the total population was 60.24 ± 1.23%, 21.13 ± 1.04%, and 16.97 ± 0.92%, respectively.With regard to vitamin E status, mean total vitamin E concentrations were significantly higher in females than in males (759.29 ± 8.48 vs.784.74 ± 6.72 μg/dL).

Fig.1 Flowchart of the population included in our final analysis.NHANES National Health and Nutrition Examination Survey, BMI body mass index, PIR poverty-income ratio, FBG fasting blood glucose, HDL-C high-density lipoprotein cholesterol, LDL-C low-density lipoprotein cholesterol, TC total cholesterol, HOMA-IR homeostasis model assessment of insulin resistance
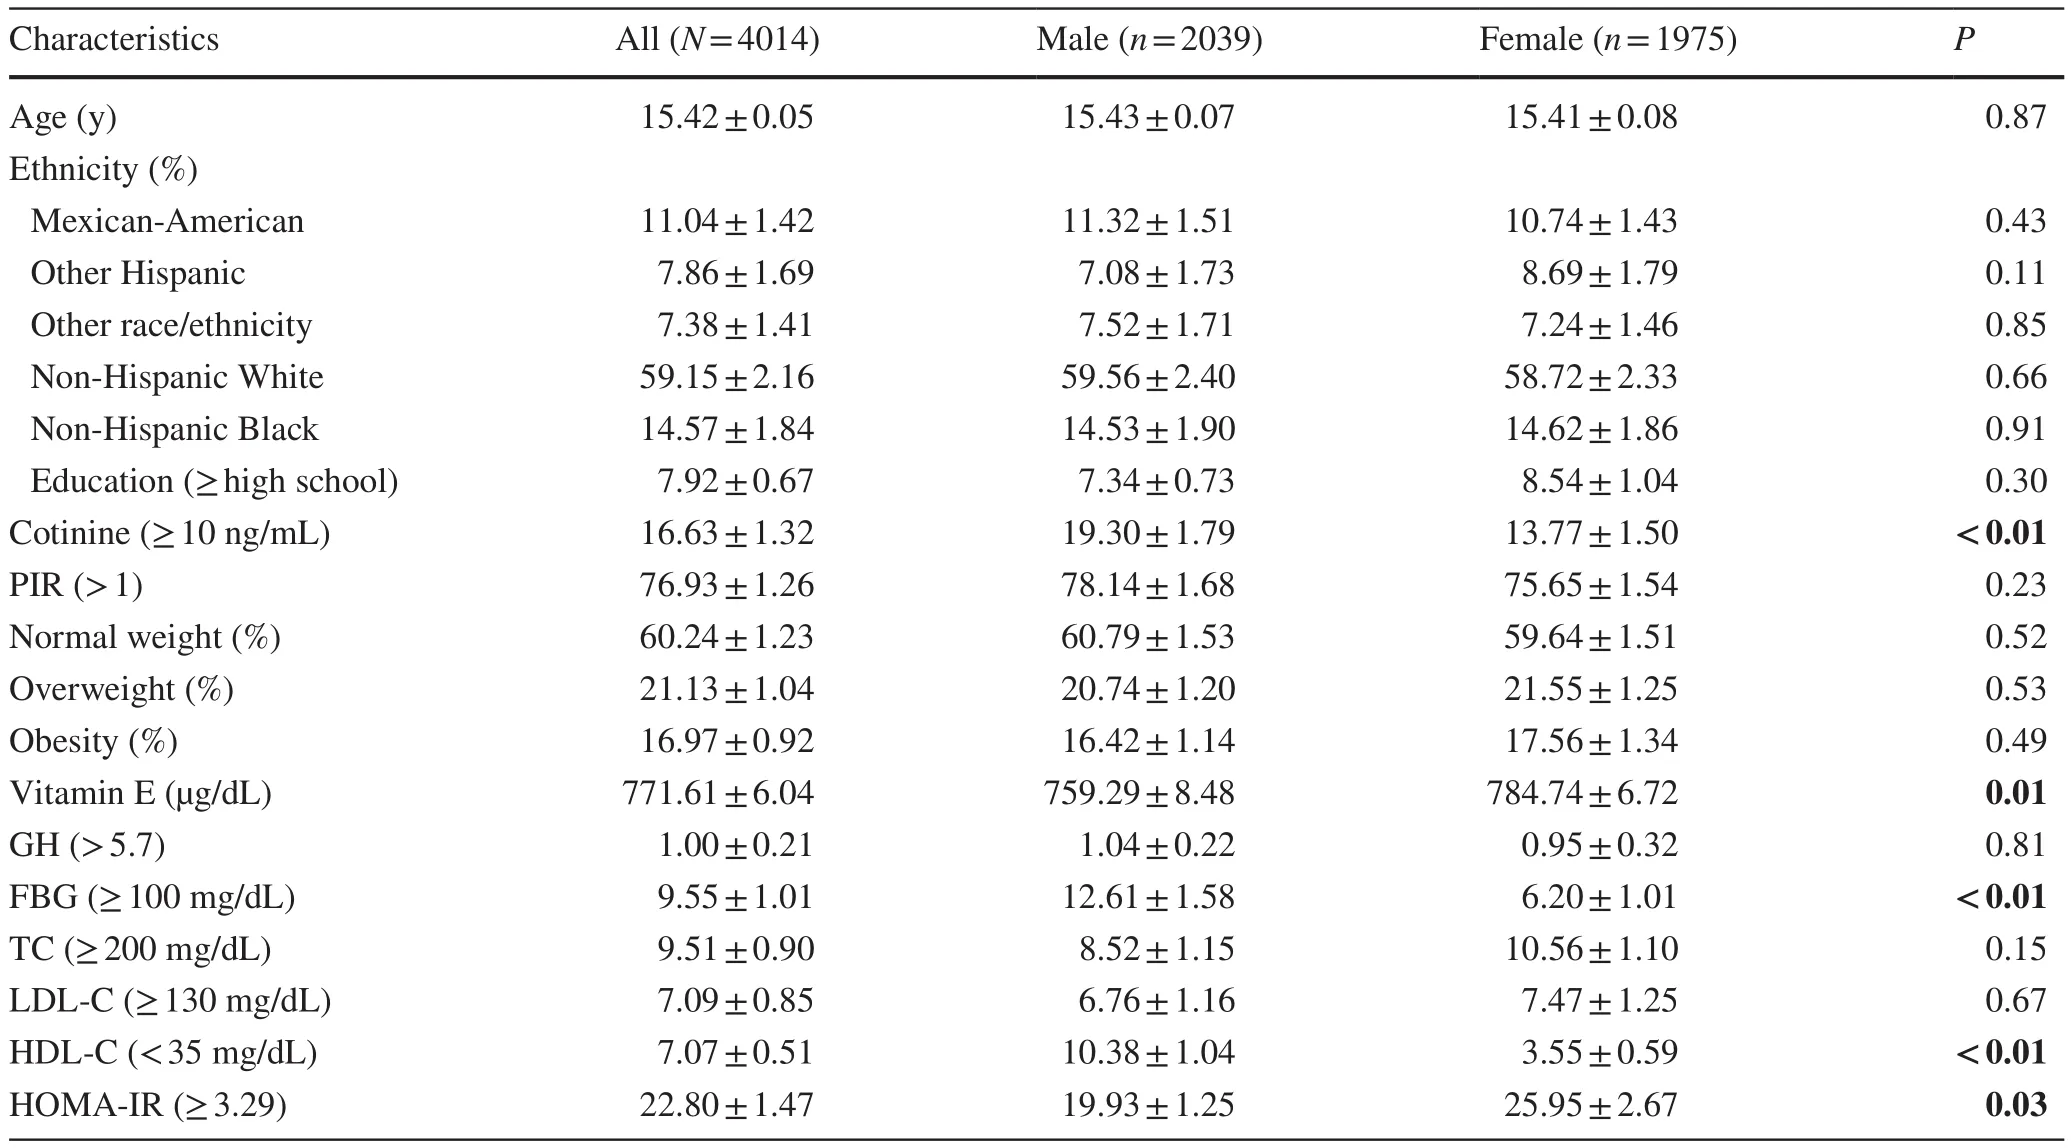
Table 1 Demographic characteristics of the United States adolescents aged 12–19 years a
No statistically significant differences were detected in the race, education levels, PIR, GH, TC, and LDL-C (allPvalues > 0.05).The proportion of females in individuals with TC ≥ 200 mg/dL and HOMA-IR score ≥ 3.29 was higher than that of males.The opposite patterns were observed in GH, FBG, and HDL-C.
The relationship between serum vitamin E and obesity
Non-adjusted and adjusted models are shown in Table 2.In the crude model, serum vitamin E levels were negatively correlated with obesity [odds ratio (OR) = 0.45, 95% confidence interval (CI) 0.27–0.75] in girls.The result did not show apparent changes in the adjusted model 1 (adjusted for age, sex, race/ethnicity) (OR = 0.46, 95% CI 0.28–0.78).Besides, a negative association was still observed in the fully adjusted model(adjustment variables: age, sex, race/ethnicity, family PIR,education levels, serum cotinine status, diabetes, TC, HDLC, LDL-C, HOMA-IR score, GH, FBG) (OR = 0.08, 95% CI 0.02–0.29).Interestingly, a significant interaction was found between serum vitamin E levels and gender (P< 0.01) (Fig.2 a).
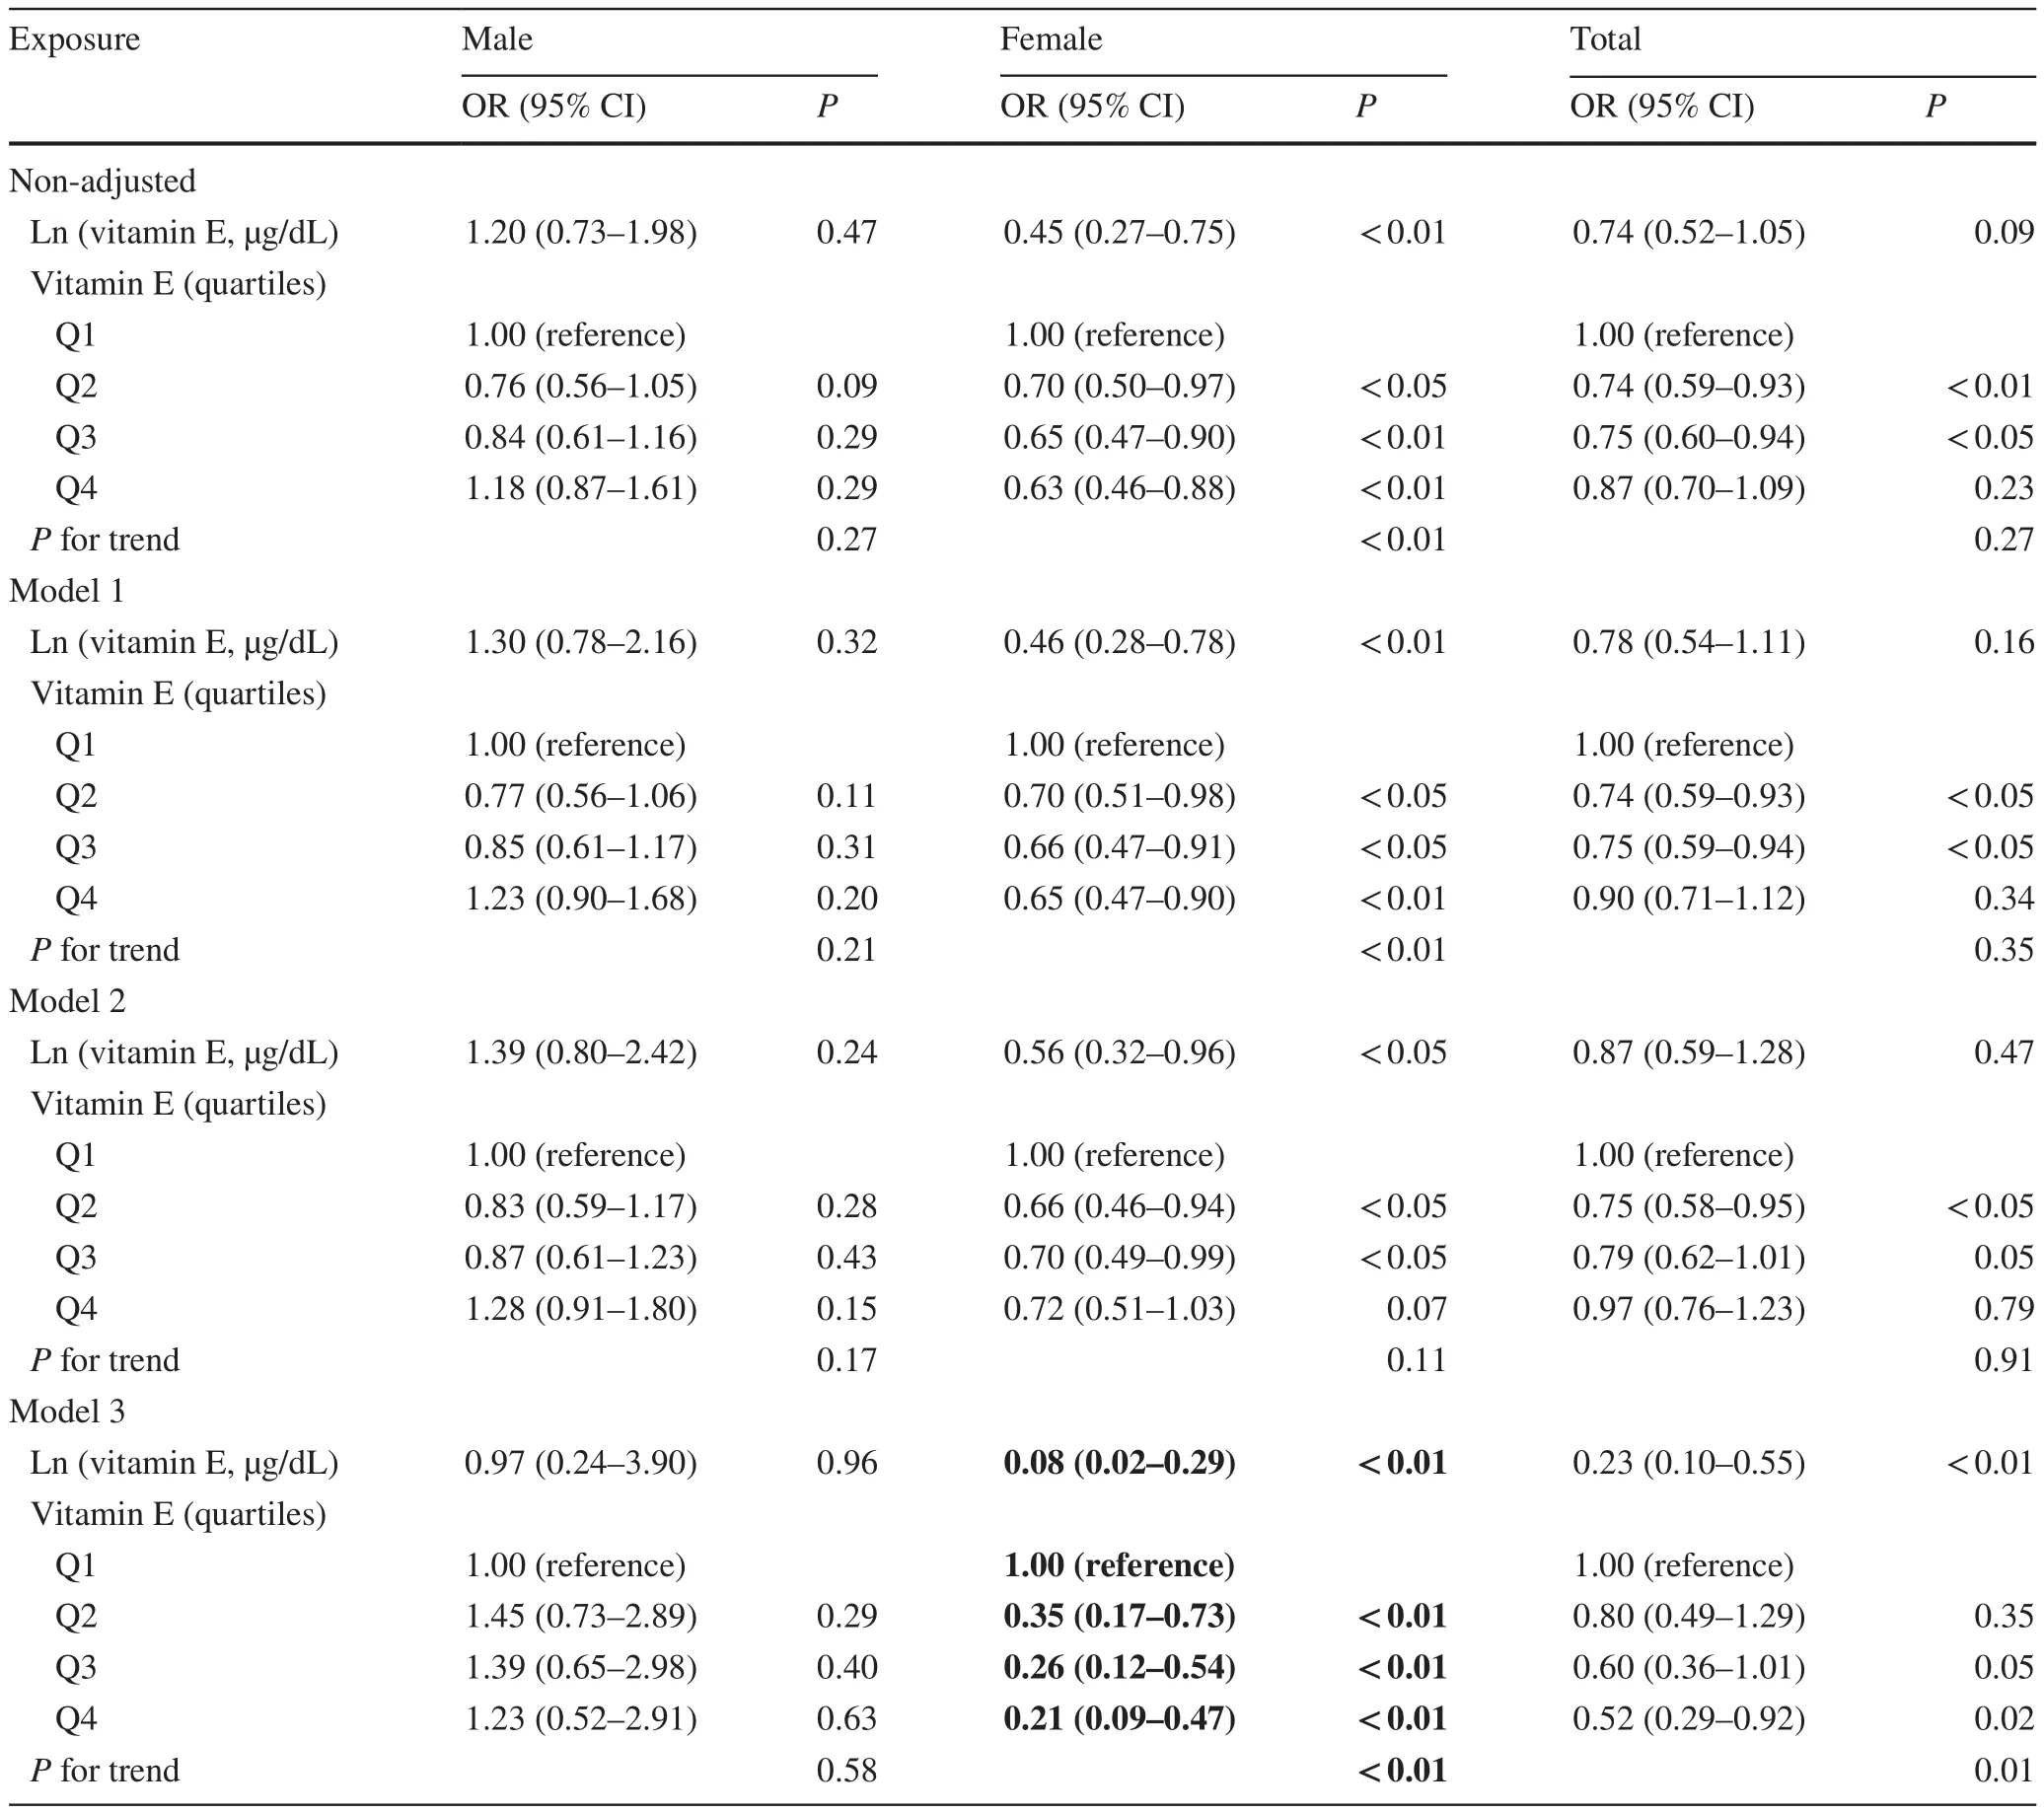
Table 2 Association between serum vitamin E and obesity in multivariable logistic regression analysis
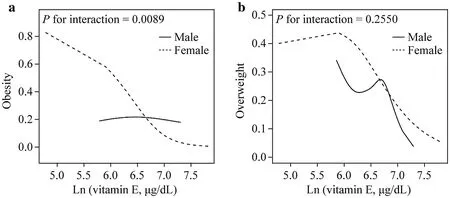
Fig.2 The relationship between vitamin E and obesity.a Smooth curve fitting of vitamin E levels with obesity between the two gender groups; b smooth curve fitting of vitamin E levels with overweight between the two gender groups.The above model adjusted for age, race/ethnicity (non-Hispanic white, non-Hispanic blacks,Mexican Americans, and others), family PIR, education levels,serum cotinine status, TC, HDL-C, LDL-C, HOMA-IR score,GH, FBG).PIR poverty-income ratio, TC total cholesterol, HDLC high-density lipoprotein cholesterol, LDL-C low-density lipoprotein cholesterol, HOMA-IR homeostasis model assessment of insulin resistance, GH glycated hemoglobin, FBG fasting blood glucose
The relationship between serum vitamin E and overweight
In Table 3, the serum vitamin E levels in girls had a significant negative correlation with overweight (OR = 0.32;95% CI 0.13–0.80), while in boys, vitamin E level did not significantly affect obesity (OR = 0.74, 95% Cl 0.26–2.15).For sensitivity analysis, higher serum vitamin E levels were significantly negatively correlated with obesity in girls(compared to 1st quartile, 2nd quartile: OR = 0.74, 95% CI 0.44–1.25; 3rd quartile: OR = 0.43, 95% CI 0.25–0.74; 4th quartile: OR = 0.46, 95% CI 0.26–0.82).By contrast, such a pattern was not observed in boys.However, no significant interaction was found between serum vitamin E levels and gender (P= 0.25) (Fig.2 b).
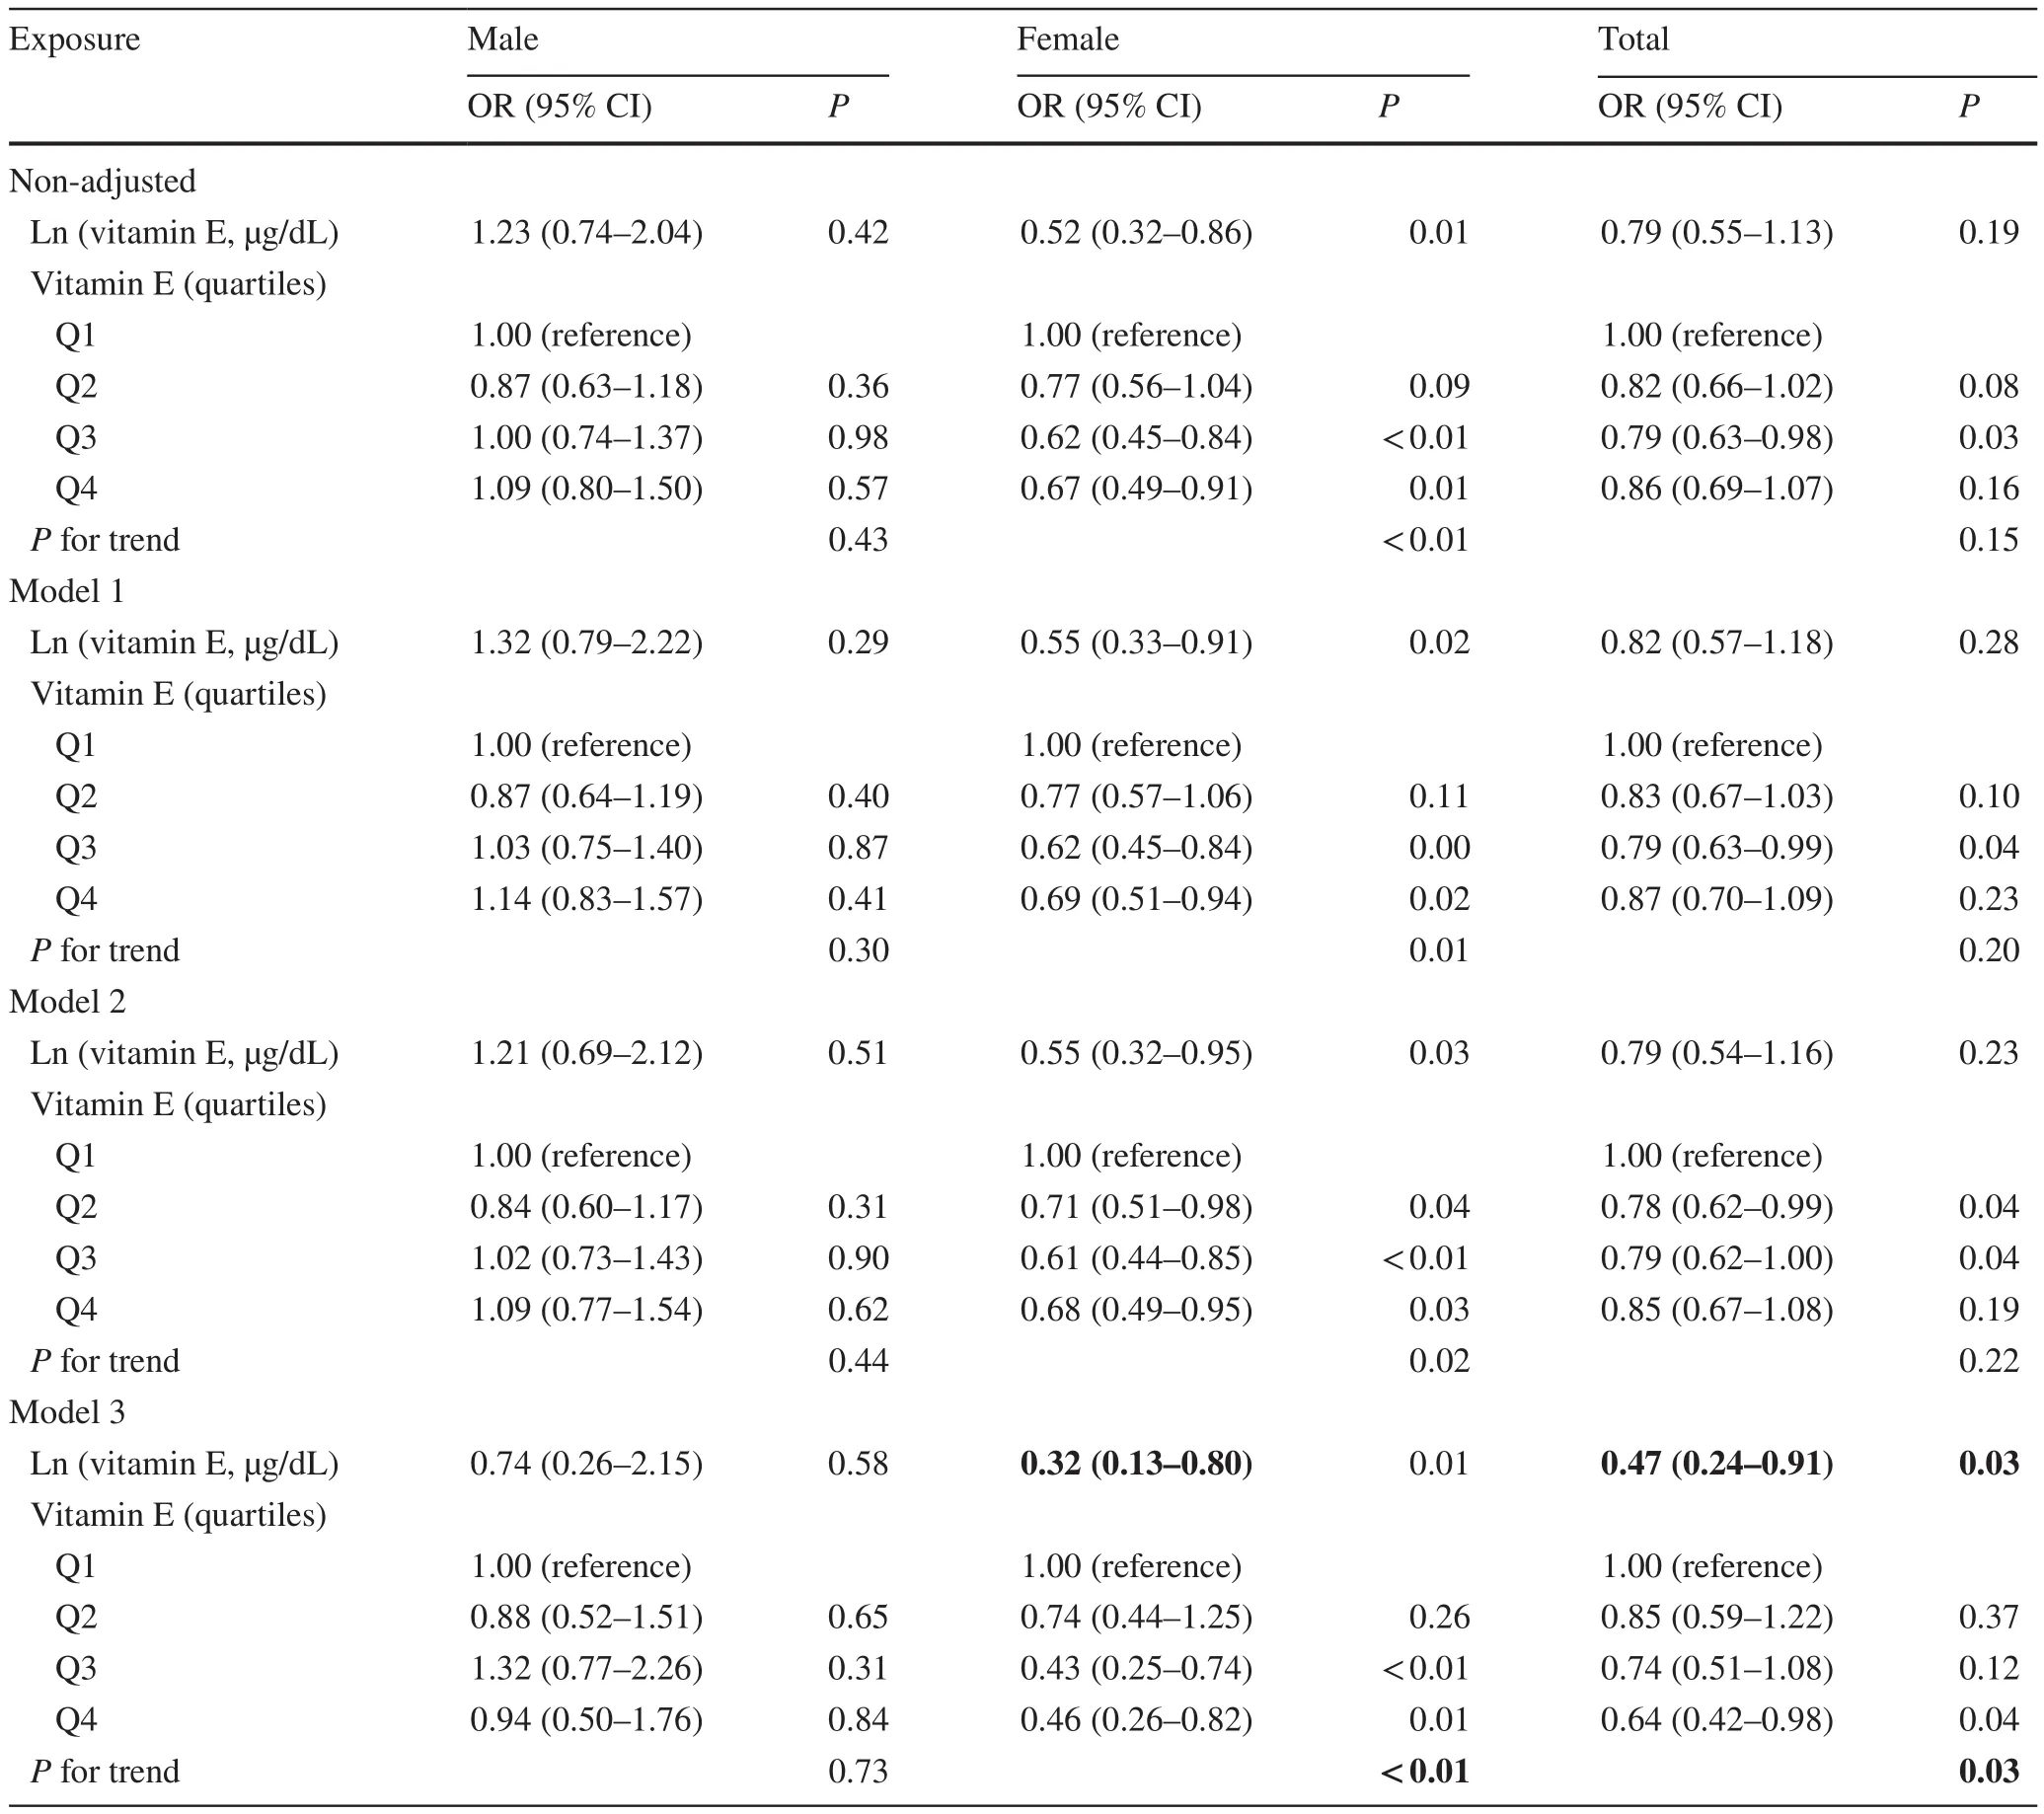
Table 3 The effect sizes of serum vitamin E on the risk of overweight between two gender groups
The analyses of the non-linear relationship
It is essential to analyze non-linear relationships for continuous variables.To solve the non-linear problem, GAM was used to elucidate the non-linear relationship.After correction for confounding factors, the relationship between serum vitamin E levels and obesity was linear in girls (Pfor likelihood ratio test = 0.17) (Fig.2 a).Besides, the relationship between serum vitamin E levels and BAZ was visualized in a scatter plot with a fitted line and the 95% CI (Fig.3).
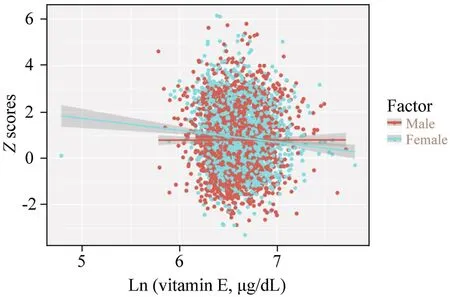
Fig.3 A scatters plot with a fitted line and 95% CIs showing the relationship between vitamin E concentrations and BMI Z score.CI confidence interval, BMI body mass index
The subgroup analyses
To examine the robustness of our findings, subgroup and interaction analyses were then conducted to study these correlations (Table 4).The test for interactions was not statistically significant for age, race, education levels, serum cotinine, PIR, GH, FBG, TC, HDL-C, LDL-C, and HOMA-IR score (Pfor interaction = 0.13, 0.19, 0.06, 0.12, 0.89, 0.18,0.76, 0.72, 0.11, 0.12, and 0.40, respectively).Besides, after stratifying for covariates, a stronger association can be found in the group of individuals with HOMA-IR ≥ 3.29.
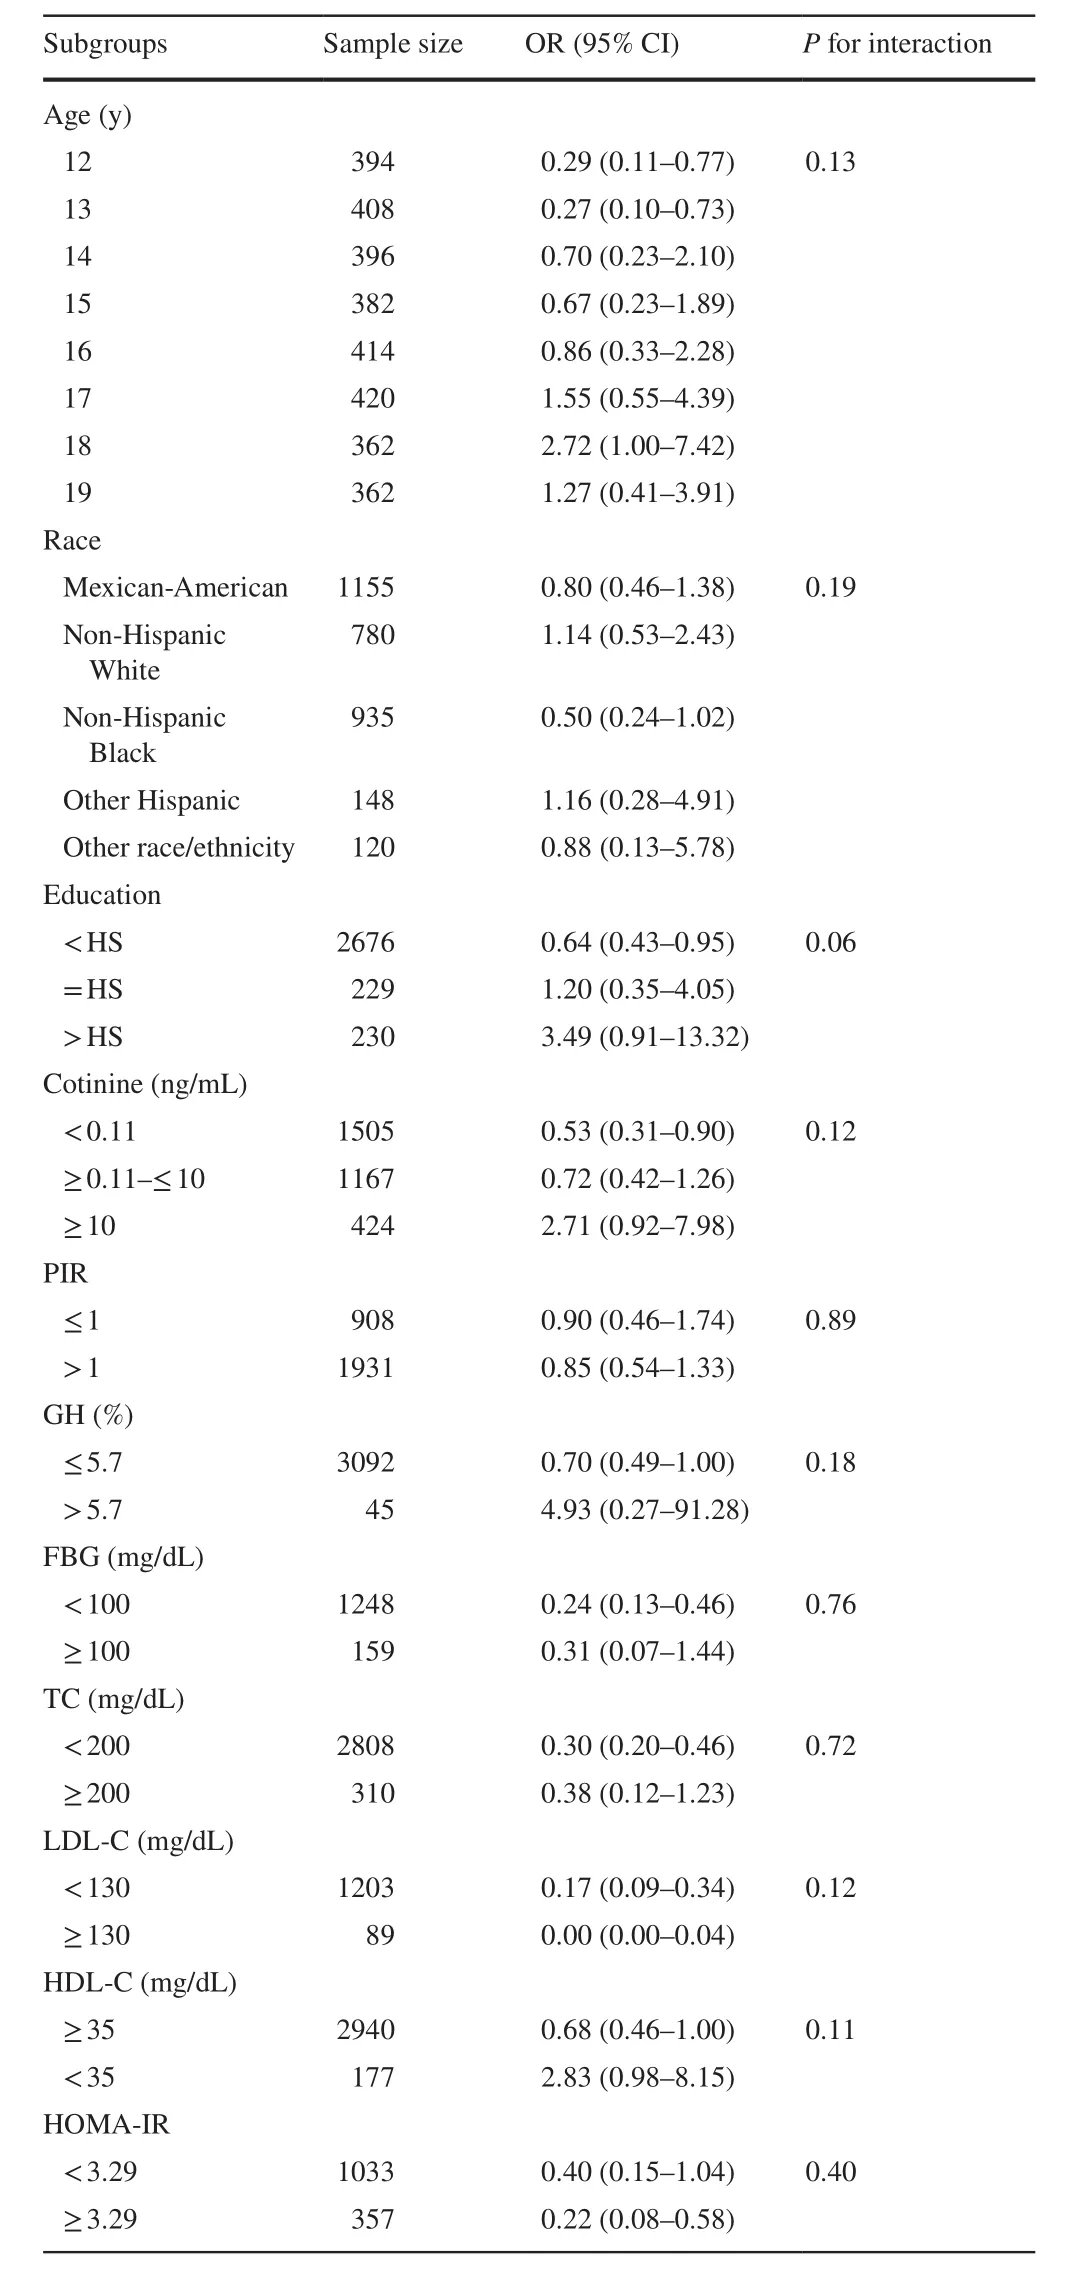
Table 4 Multivariate analysis of the association of vitamin E and obesity stratified for covariates
Discussion
This cross-sectional study indicated that serum vitamin E levels were inversely correlated with obesity/overweight in adolescents.We also find that the association between serum vitamin E levels and obesity is sex-specific.Among females, serum vitamin E levels were negatively correlated with obesity in a linear manner rather than in a non-linear manner.Besides, the negative association was only found in women but not in men.Each 1-SD increment in vitamin E concentrations was significantly associated with a 92% decreased risk of obesity in females.
Although the specific mechanism by which serum vitamin E levels regulate obesity is still unclear, previous studies have shown that serum vitamin E levels are highly correlated with obesity and metabolic syndrome.The study by Davi et al.showed that vitamin E supplementation could reduce lipid peroxidation [36].An essential mechanism of vitamin E forms is non-enzymatic antioxidants, as they scavenge radicals by donating hydrogen from the phenolic group on the chromanol ring [37].This ability promotes vitamin E as a potent free radical scavenger, interacting with active free radicals and converting lipid peroxides into hydroxy lipids [38].
Our results on the association between serum vitamin E levels and obesity in the total sample are differed from another study using data from NHANES 2001–2004 [39],in which serum vitamin E levels were found significantly inversely associated with obesity in Mexican–American children.By contrast, we did not find correlations between serum vitamin E levels and obesity among Mexican-American girls (OR = 0.80, 95% CI 0.46–1.38).This discrepancy may due to the different study populations.Besides,we add new insights to find that serum vitamin E levels were differentially associated with obesity between boys and girls.This result illustrates that gender plays a signifi-cant role in the relationship between vitamin E and obesity in adolescents.No such case, to our knowledge, has been reported in the literature.
It is unclear why vitamin E may “target” obesity differently between boys and girls.We speculate that this may be related to different-sex hormonal reactions to vitamin E by gender [40, 41].Increased sex steroid levels in the pubertal state, especially estrogen, may explain this finding.As reported, estrogen (estradiol) can donate a hydrogen atom of the OH group at its aromatic ring to tocopherol, thus reducing the oxidation of vitamin E and delaying the oxidation process of LDL [42].The combination of vitamin E and estrogen, therefore, resulted in a synergistic effect [43,44].In contrast, men's response to obesity did not show any change in plasma cortisol levels, while cortisol levels doubled in women's plasma, indicating the differential sensitivity of the hypothalamus–pituitary–adrenal axis between the two sexes [45].This speculation needs confirmation, and further examination is also needed to explore the relationships between vitamin E, sex hormone levels, and obesity.
Interestingly, our study observed that non-Hispanic black populations had lower serum vitamin E concentrations in relation to other racial/ethnic groups (736.1 ± 151.2 vs.771.3 ± 195.4 μg/dL;P< 0.01).These disparities may be related to differences in diet breadth between the different ethnicities/races.For instance, more non-Hispanic whites than non-Hispanic black youth consumed nuts, a rich source of antioxidants, such as selenium and vitamin E[46].Besides, we also found a striking inverse association between serum vitamin E levels and obesity risk in female adolescents with a lower education level.As reported, vitamin E has been shown to increase the participants' lymphocytes following endurance exercises [47].In contrast, a study demonstrated that physical activity was negatively associated with education level [48].School-age youth spend a significant amount of sitting time indoors [49].Therefore, one possible explanation is that the decrease in physical activity leads to a low level of vitamin E, which may be a critical factor in the prevalence of obesity.We also found a significant negative association between vitamin E and obesity risk in the population with lower cotinine exposure.Cotinine is a biomarker of active and passive smoking, which can increase inflammation and oxidative stress.However, both passive and active smoking can deplete serum vitamin E [50].The antioxidant effect of vitamin E, therefore, may be partially off set by elevated serum cotinine levels.
Our study has some strengths: (1) our sample size was relatively large compared with related studies; (2) a linear relationship was observed between vitamin E and obesity using the smooth curve fitting; (3) although potential confounding factors cannot be entirely ruled out, we used strict statistical adjustment to minimize residual confounding; (4) in this study, the effect modifier factor analysis makes better use of the data and yields a stable conclusion in different subgroups.
There are several limitations to this study.First, the causal inferences could not be drawn due to the cross-sectional design.Second, our studies focused on the intricate relationship of gender, vitamin E, obesity, and did not address the value of other molecules (e.g., vitamins A, C, D, carotenoids, lycopene).Third, other potential confounding factors(such as dietary structure, physical exercise, and lifestyle choices) possibly influenced the results.Fourth, using BAZ as the indicator of childhood obesity could be another limitation.The best method of obesity is based on the percentage of body fat but requires special tools to assess it.However,the tools needed to measure body fat may not be completely accurate and can-not be widely used in epidemiology.The BAZ introduced by the WHO is a generally accepted and commonly used evaluation tool for obesity in children and adolescents [51, 52].Finally, as the study population only contains children in the US, study results may not apply to other populations.
In conclusion, our findings support a possible negative association between serum vitamin E levels and obesity/overweight in adolescents.A higher serum vitamin E level may be associated with a reduced probability of obesity in girls, but not in boys.Ultimately, these could have signifi-cant implications for sex-based therapeutic strategies to prevent the adverse consequences of obesity in early life.
AcknowledgementsThe authors gratefully acknowledge the Centers for Disease Control and Prevention, USA, for access to the NHANES public release date.This study’s findings and conclusions do not necessarily represent the official position of the Centers for Disease Control and Prevention.
Author contributionsZXD, HQH, and LXX contributed equally to this work.ZXD, HQH, and LXX contributed to investigation, methodology, and writing of the original draft.DM and YZC contributed to resources, software, and supervision.QJR contributed to validation and visualization.MXM contributed to conceptualization, data curation, review and editing.
FundingThis research was supported by the China Postdoctoral Science Foundation (2019M651904); the Key Project supported by the Medical Science and Technology Development Foundation, Nanjing Municipality Health Bureau (ZKX19039); the National Key Research and Development Program of China (2017YFC1308105,2016YFC1101001); and the National Natural Science Foundation of China (81970265, 82000303).
Compliance with ethical standards
Ethical approvalThe National Center for Health Statistics Ethics Review Board at the Centers for Disease Control and Prevention approved the collection of the NHANES data and posting of the documents online for public use through the ethical approval code Protocol#98-12.Available online: http://www.cdc.gov/nchs/nhanes/irba98.htm.
Conflict of interestNofinancial or non-financial benefits have been received or will be received from any party related directly or indirectly to the subject of this article.The authors have no conflict of interest to declare.
Data availabilityAll data relevant to this work are available from https://datad ryad.org/stash/share/yv7_ feGNG HkA_ k3yq6 EHrO3 YMxqz 0TNCh veSHG-mtAg.
 World Journal of Pediatrics2021年5期
- World Journal of Pediatrics的其它文章
- Acute generalized exanthematous pustulosis as a manifestation of Kawasaki disease
- Febrile infants: written guidelines to reduce non-essential hospitalizations
- Rising serum potassium and creatinine concentrations after prescribing renin–angiotensin–aldosterone system blockade:how much should we worry?
- Role of ultrasound in the diagnosis of cervical tuberculous lymphadenitis in children
- Nasogastric or nasojejunal feeding in pediatric acute pancreatitis:a randomized controlled trial
- Pediatric upper extremity firearm injuries: an analysis of demographic factors and recurring mechanisms of injury
