Customer Tiered Purchase Forecast by Mobile Edge Computing Based on Pareto/NBD and SVR
Yan Li,Ying Zhang,Fei Luo,Wei Zou,Yu Zhang,Kaijun Zhou
1School of Business and Management,Shanghai International Studies University,550 Dalian Rd.(W),Hongkou District,Shanghai,200083,China
2Institute of Mineral Resources,Chinese Academy of Geological Sciences,No.26,Baiwanzhuang Street,Xicheng District,Beijing,100037,China
Abstract:Mobile edge computing is trending nowadays for its computation efficiency and privacy.The rapid development of e-commerce show great interest in mobile edge computing due to numerous rise of small and middle-sized enterprises(SMEs)in the internet.This paper predicts the overall sales volume of the enterprise through the classic ARIMA model,and notes that the behavior and arrival differences between the new and old customer groups will affect the accuracy of our forecasts,so we then use Pareto/NBD to explore the repeated purchases of customers at the individual level of the old customer and the SVR model to predict the arrival of new customers,thus helping the enterprise to make layered and accurate marketing of new and old customers through machine learning.In general,machine learning relies on powerful computation and storage resources,while mobile edge computing typically provides limited computation resources locally.Therefore,it is essential to combine machine learning with mobile edge computing to further promote the proliferation of data analysis among SMEs.
Keywords:e-commerce;customer behavior;Pareto/NBD model;SVR model;ARIMA model;mobile edge computing
I.INTRODUCTION
In recent years,mobile edge computing has attracted a considerable amount of attention from both academia and industry through its many advantages such as low latency,computation efficiency and privacy caused by its local model of providing storage and computation resources.In addition,machine learning has become the dominant approach in applications such as industry,healthcare,smart home,and transportation.All of these applications heavily rely on technologies that can be deployed at the network edge.For the SMEs in e-commerce,they gradually notice the importance of data analysis locally to run a better operation.
Data from the“Internet Plus consumer development analysis”released by the National Bureau of Statistics show that the total amount of online consumption is expanding,however,the customer’s repurchase rate is still very low.With the homogenization of enterprise products and services in society,many enterprises realize the importance of customer relationship management and gradually move from productcentric to customer-centric.In 1990,Frederick F.Reichheld and W.Earl Sasser have a study on the cost and value of new and existing customers in Harvard Business Review(Zero Defections:Quality Comes to Services)that shows that the cost of developing a new customer is five times the cost of retaining an old customer.Therefore,although the proportion of old customers in the consumer group of e-commerce is very small,but this value of old customers is still can not to be ignored.Unlike the traditional 2-8 law under the management model,Internet consumption is more in line with the long tail theory.Therefore,looking at the source of online customer consumption in small and medium-sized enterprises,more than 80
In view of the above,the issue of predicting the number of new users and maintaining the continuity of existing customers is of great concern in today’s booming e-commerce industry.Based on this,this paper predicts the overall sales volume of the enterprise through the ARIMA model,and then apply the SVR(Support Vector Regression)model and the Pareto/NBD model into real situation to make layered predictions of the arrival of new and old customers by dividing the new and existing customer groups,and further to provide advice for the enterprise to divide the customer structure and then do marketing prediction more accurately.
II.REVIEW OF RELEVANT LITERATURE
Because of the non-contractual random trading behavior characteristics of online shopping customers,the Pareto/NBD model has a good probability description of the customer’s repeated buying behavior.In this area,Ehrenberg first proposes a negative two-item allocation model(NBD model)to suit the customer’s trading behavior and to predict when the customer will re-purchase over time in the future[1].But this model assumes that the customer has always been active,and it is clear that customer churn is inevitable in the real world,and it also runs counter to the customer life cycle theory.In 1987,Schmitt,Morrison and Colombo extended the original hypothesis on the basis of the NBD model,presenting the Pareto/NBD model,also known as the SMC model,consisting of the initials of the three founders’names[2].The SMC theoretical model has more stringent assumptions,as the designers of the model say,“not necessarily suitable for all industries”and require extensive validation.They then proposed an improved model of the Pareto/NBD model in 1994 and tested it in the industrial sector[3].At present,there are also studies on the application and revision of SMC models.
For Chinese scholars,In 2003,Qi Jiayin,Li Waizu,Shu Huaying and Qin Liangxuan carried out empirical research on the application of SMC model in THE IT distribution industry,and the results verified the validity of this model[4].And further they put forward that the customer churn rate and customer stability are different in the early stage,development,maturity and recession period of the customer life cycle,which is different from the simple trading behavior of the model.In 2006,Ma Shaohui and Liu Jinlan also carried out empirical tests on the Pareto/NBD model,and they present a method to calculate the purchase value of customers in combination with the Pareto/NBD model and the purchase amount expectation model,and set up the early warning point of customer churn in turn[5].In 2008,Ma Shaohui proposed the extended model of Pareto/NBD,and obtained the post-test distribution sample of the Pareto/NBD model by the Markov chain Monte Carlo simulation method[6].The hypothesis that the secondorder Erlang distribution is used instead of exponential distribution which originally used in SMC,while there are scholars who directly use the NBD model in 2015 to analyze the customer group on widely used social software webo in China[7].
For the prediction model,SVR time series prediction has a good performance in lots of areas.Tay F E and H.Cao L Compare SVR to Multi-Layer BPNN,through 5 Real Futures Contracts data verification in the Chicago Commercial Market,SVR Predictive accuracy is significantly better than multi-layer BPNN[8].Chen Rong,Liang Changyong,Xie Fuwei summarizes SVR in finance,power,transportation,tourism and other fields,which shows SVR model is robust and stable[9].In the paper,we will apply the SVR model in the e-commerce industry to predict newcomers based on the historic newcomer data.
III.MODEL AND DISTRIBUTION CHARACTERISTICS OF CUSTOMER PURCHASE BEHAVIOR
Based on the long-tail theory in e-commerce,this paper explores the repeated purchase behavior of old customers in non-contract random transactions through the use of Pareto/NBD model,and explores the arrival of new customer base through SVR,and states the idea of customer layering prediction may be better than the classic ARIMA sales forecast.
3.1 Pareto/NBD Model
The Pareto/NBD model is a probability model in which many assumptions are made about the customer’s arrival are obedience to Poisson distribution,the customer’s purchase interval obeys the exponential distribution,the different customer churn rate is independent of each other and is obeyed to the gamma distribution[10].By extracting the customer’s purchase number in the observation period x,the customer’s first purchase time t1,the customer’s last purchase time t_x which are the three main customer purchase data,and then through the maximum likelihood method of parameter estimation,we finally calculate the customer activity,customer’s future purchase expectations and other different values[11].Then we provide enterprises customer churn probability for enterprises to establish customer churn early warning.
Here are the Pareto/NBD models with detailed assumptions and key results:
(1)At the entire stage of the transaction with the enterprise,there are two states in which the customer exists:active or drained[12].
(2)When the customer is active,the individual customer repeats the purchase follows the Poisson distribution of the purchase rate λ.Therefore,the probability of an x purchase in the observation period(0,T)satisfies the following formula(1)[13].

(3)The customer’s unobservable “life span”is long τ(it is later considered inactive)subject to exponential distribution,with a loss rate of μ,showing as formula(2).

(4)The purchase rate λ is subject to Γ(r,α)distribution among different customers,which is the distribution parameter.The former is the shape parameter,and the latter is the scale parameter,showing as formula(3).

(5)The rate of loss is subject to distribution Γ(s,β)among different customers;s and β are the distribution parameter,showing as formula(4)[14].

(6)Customer purchase rates λ and churn rates are independent u of each other.
The main results of the Pareto/NBD model are as follows
A likely function of a randomly selected individual with a history of purchase(X x,t_x,T)is as formula(5):
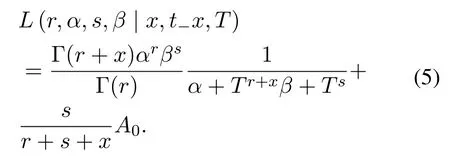
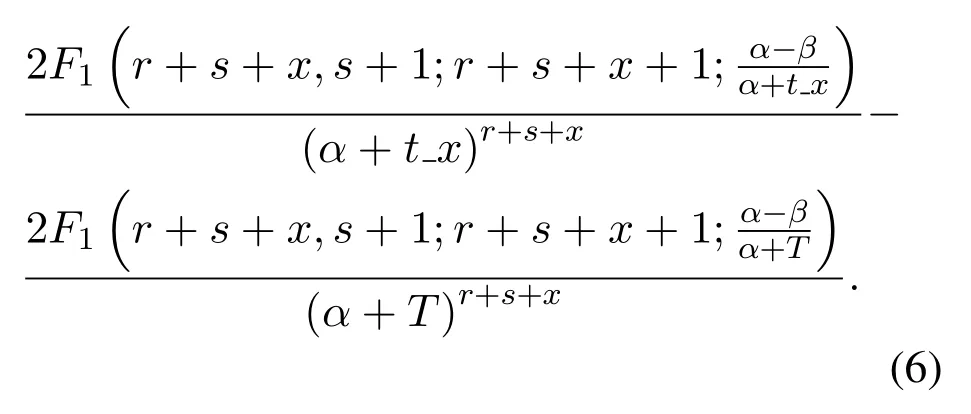
While α>β,the result is as formula(6):
while α<β,the result shows as formula(7):
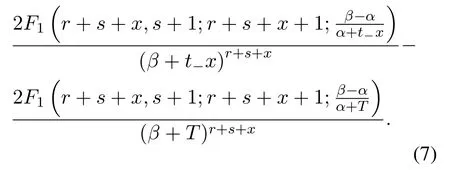
Where F1(′)is the Gaussian geometry function.
The four parameters(r,α,s,β )in the Pareto/NBD model can be identified by the method of maximum likely estimation as follows.Suppose we have a sample of N customers,the customer i made xipurchase during the transaction of(0,Ti)and the last time they made the purchase is txi,the positive function of this sample is as formula(8)[15]:
The calculation formula for customer activity is as formula(9):

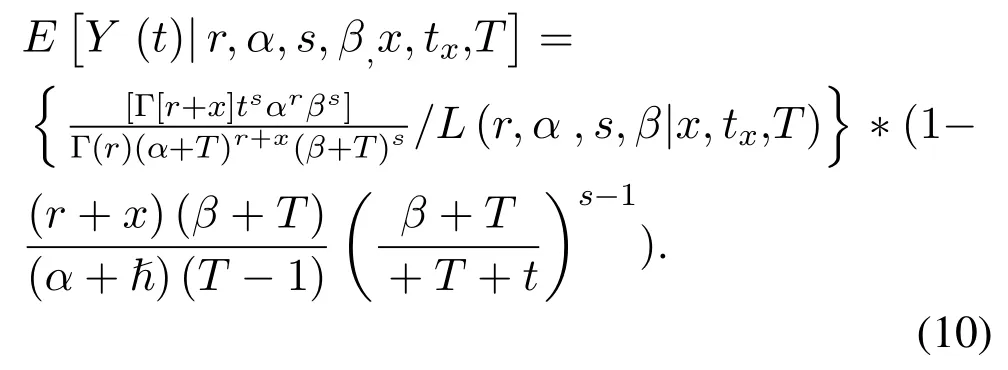
Pareto/NBD Model Random Customer Purchase Expectations as formula(10):
The analysis of the old customers in this paper will be based on MATLAB software operation model data,code reference Peter S.Fader et al.2005.3 published the paper“A Note on The Implementation the Pareto/NBD Model in MATLAB”.Peter S.Fader,Bruce G.S[16].Hardie and Kaloko Lee also proposed a simplified implementation of Pareto/NBD in 2003,the BG/NBD model,an excel replacement way to apply the Pareto/NBD model to analyze customer retention,observe customer maintenance time and other areas[17].
3.2 SVR Model
SVR is an important branch of application that supports vector machines(SVMs).The SVM’s unique loss function is fitted with an area where we consider the prediction to be correct,and we calculate the loss outside of that.Model can be built through the SVR module inside R,the regression type we select EPS regression(type=eps-regression)[18],and the core function selects the radial base function(Base Radial Function).
In linear cases,the support vector machine function fitting first considers the linear regression function:f(x)=w*χ+b(xi,yi),i=1,2,3......n,xi∈Rnis the input amount,yi∈R is the output amount
The standard support vector machine uses the sensitivity function,which assumes that all training data is fitted with a linear function with ε-precision[19].That is,the following conditions are as the formula(11):

ξi,ξi*are relaxation factors.When there is an error in the division,ξiand ξi*are greater than 0[20].At this time,the problem is transformed into the problem of minimizing the objective function of optimization,and then through convex optimization,the pair change,the solution finally comes to the linear fit function.In nonlinear cases,the SVR maps the input vector to the high-dimensional space,then achieves the downdimensional reduction through the use of the nuclear function,and finally the convex secondary planning solution solves the problem[21].
IV.EMPIRICAL ANALYSIS
This article is based on sales data from Taobao Tmall store from January 2014 to December 2017 of a Shanghai cosmetics company,which details the purchase time,payment amount,purchase quantity,evaluation and other data for each product customer.
4.1 ARIMA Model Operation Process and Results Analysis
To collate the monthly sales data of a cosmetics company in Shanghai from January 2014 to December 2017,we take logarithms and then take a first-order difference,and then observe the ACF and PACF charts of its differential sequence[22],and after the time series becomes smooth,an ARIMA(p,1,q)model is established for the original sequence.After repeated testing,the estimated sequence of the fitted residuals is examined by LB to determine that the residuals are the Gaussian white noise sequence[23].Finally,we determinethat the model is ARIMA(1,1,4)
From the model results,R squared is 0.584,AR and MA coefficients are-0.903 and-0.801,respectively.
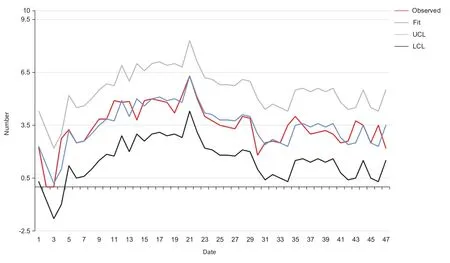
Figure 1.ARIMA sales forecast.
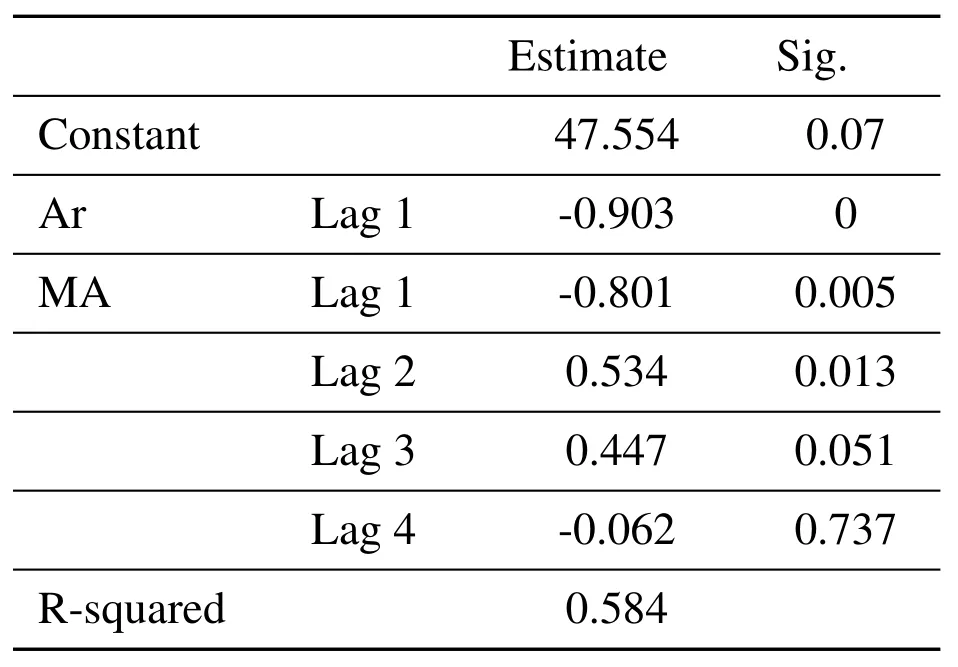
Table 1.ARIMA model parameters.
The significance level is less than 0.01,so the coefficients is significantly not 0.MA’s 2-order differential coefficient is 0.534.sig=0.013,3-order difference is divided into 0.447,sig=0.051,and then look at the residual ACF and PACF graph,you can see that both are stable,so ARIMA(1,1,4)is reasonable.Therefore,the ARIMA model results is as follows:

4.2 Pareto/NBD Application and Results Analysis in E-Commerce Cosmetics Industry
4.2.1 Choice of observation period
We know that the K-means algorithm is an unsupervised machine learning algorithm,we only need to determine the number of cluster categories K in advance,and then randomly select the initial point as the center,calculate the distance between the sample and each center point,classify the sample into the most similar class,and then re-select the center,again calculate the distance between the sample and each center point,so repeated until the center point does not change[24].Based on the above assumptions,when N data points need to be divided into K clusters,k-means wants to optimize the target function[25]:
So we put the customer ID,the amount of consumption,purchase date and other data through the weka software k-means algorithm to cluster,by trying to set different k values,comparative analysis of its mean,variance,and the number of samples in each category after we finally determined the cluster into 3 categories,the results show that the customer purchase data concentrated in 2014.10-2016.11.
Looking at the clustering results of data purchase times,we found that the data intensity was greater in 2015-2015.5,so we were able to analyze a relatively concentrated customer group and a large number of groups when we chose T1 to 2015.3-2015.5.The overall idea is that after the purchase behavior occurred in T1,the purchase situation before 2016.3,and then use the model to predict the purchase situation in 2016.3-2016.12,and compare the test model effect with the real value.
4.2.2 Model Run Results Analysis
In terms of parameter values,when the customer is active,the average purchase rate is α/r=0146/week,i.e.0.7592 purchases per year.The average trading time for the client and the company to maintain is β/s=119.1883 weeks.
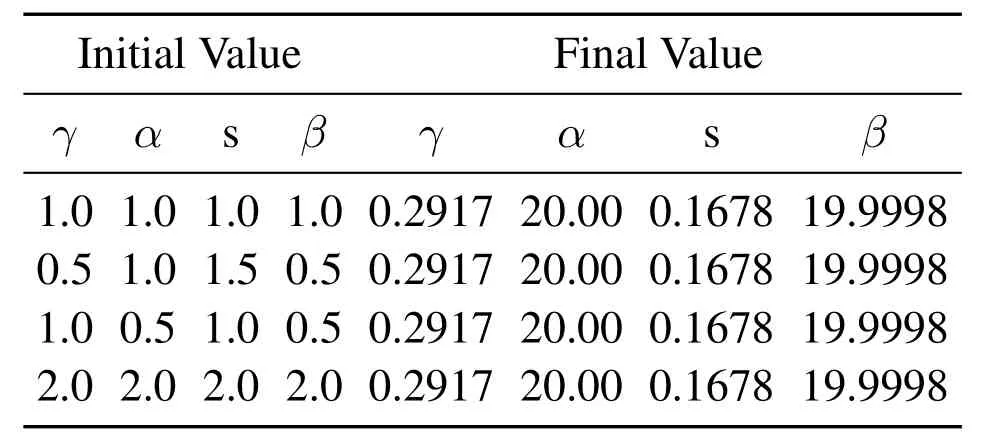
Table 2.Model parameter values.
Randomly select customers from customers to verify the rationality of the model(Table 3):
Compared with customer code 61 and 63,x and T are the same,t_x value means that the last purchase time is later,the corresponding customer activity value is also greater.
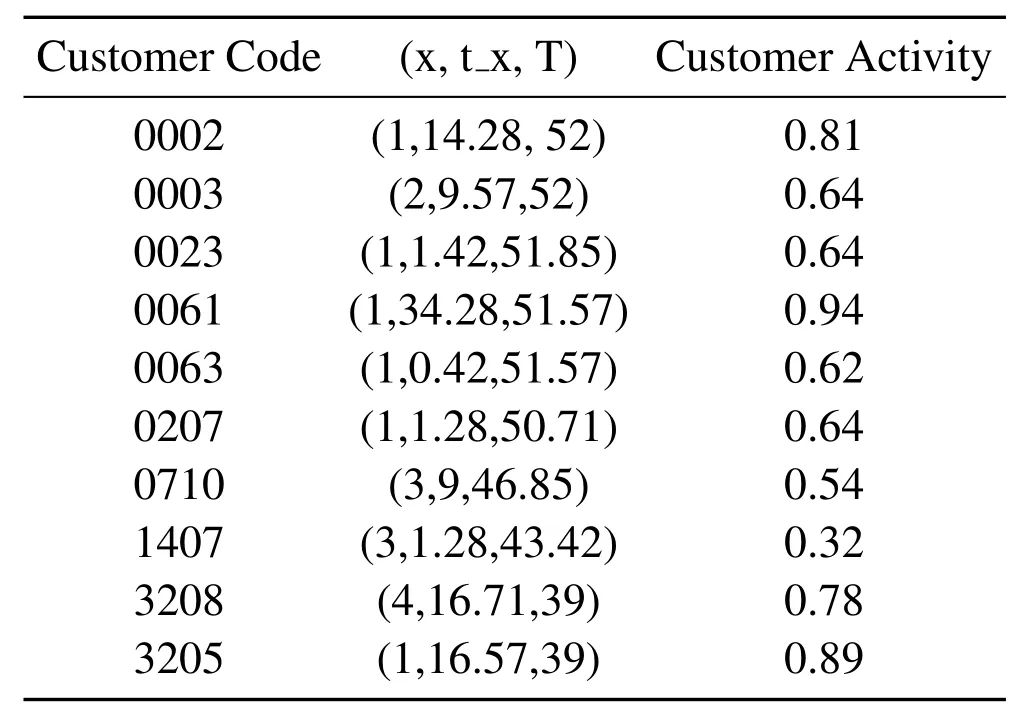
Table 3.Individual instances of customer activity.
Customer code 207,1407 and customer code 3205,3208,the last purchase time is the same and are relatively high,the customer activity of customers who buy more times is less,which means that it is more likely to lose.
By comparing customer codes 2,3,23,710,we can feel that the last purchase time has a greater impact on customer activity than the number of repeat purchases.
These results are consistent with the original theoretical assumption of the SMC model[26–28],which is:
(1)The same number of trades,the farther the most recent trading time,the lower the customer’s activity
(2)The last time a transaction was the same,the more times the customer actually made a transaction,the less active the client was
(3)Recent trading hours have a greater impact on customer activity than the number of times customers have
By analyzing the value of customer activity and comparing the actual purchase,see Table 4:
Comparing data activity with actual customer purchases during the forecast period,we found that the total number of customers who occurred in the forecast period was very small,with only 3.71%,so regardless of the range toanalyze the customer’s purchase,the forecast period purchase volume is the majority of 0.So we choose p2x not 0 in the customer group to analyze customer activity and the number and proportion of purchases corresponding,see Table 5.
That is,we know that among customers who have another purchase during the forecast period,customers who are less than 0.77 are less likely to make a purchase,and customers with activity greater than 0.77 are much more likely to make another purchase.Therefore,the probability of a transaction is positively related to the size of the activity,we judge whether the customer is lost based on the size of the activity is feasible.But we only need to be cautious when judging based on activity,because this purchase data is characterized by only a small number of people in the forecast period occurred to buy,so the model calculation activity value is very high,but the actual possibility of not buying is also very large,this may be because in the e-commerce industry,the number of old customers is very small,Most purchases are made by new users.
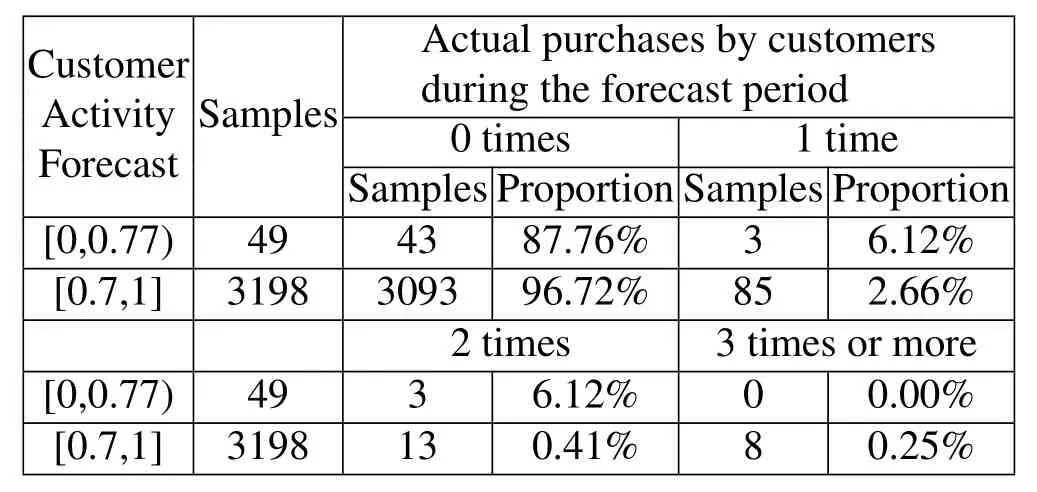
Table 4.Actual purchases of customers during the forecast period.

Table 5.Customer activity forecast vs purchases.
V.PARETO/NBD IS USED TO ANALYZE CUSTOMER RETENTION
5.1 Determining the Observation Period
We got sales data from the online Tmall flagship store of a Shanghai cosmetics brand 2014-2017.Extract the customer ID required for model analysis,customer purchase time and purchase amount.Then through descriptive statistical analysis we found that sales in 2015 were overall higher than in 14 years(see Figure 2),with sales soaring in August and September 2015,and we tried to portray their future survival times and buying behavior for this segment of customers.Due to the price reduction in August,September due to the price reduction,the number of new customers is more,choose the most concentrated data of August,September as the initial observation period t1,that is,in 2015-8-1 to 2015-9-30,the first purchase of customers,and then observe their repeated purchase behavior before 2016-4-31,And record the number of repeat purchases at this stage and the time when the last purchase occurred,and finally predict their purchase behavior from 2016-5-1 to 2016-12-31.
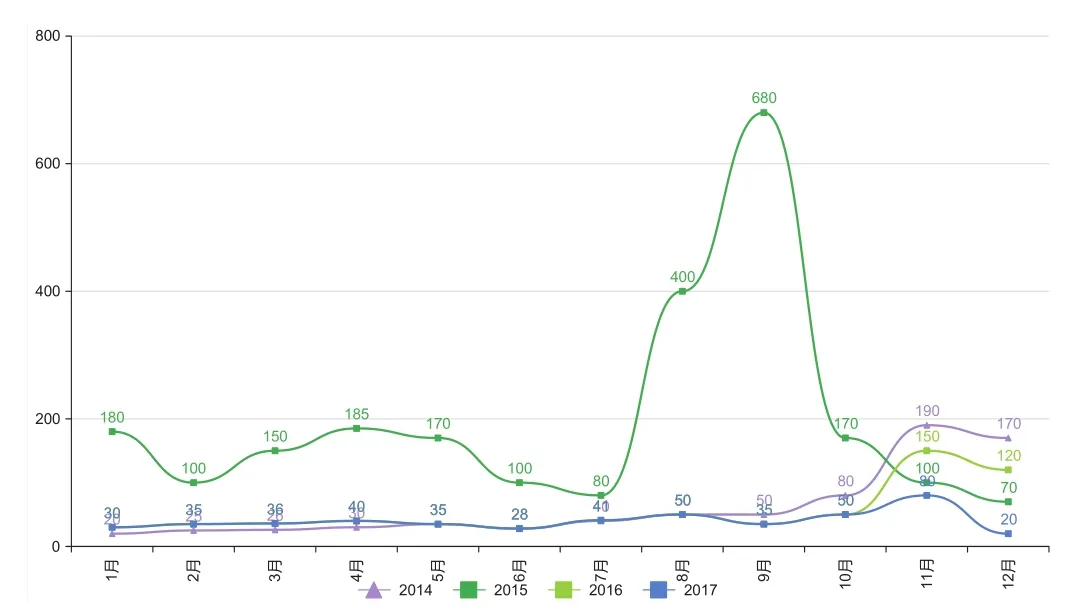
Figure 2.Historical monthly sales.
Unlike the previous K-means cluster,we will combine the product’s life cycle with the selection of this observation period.The choice of observation period t2 is determined based on the life cycle of the customer who has made a repeat purchase for such cosmetics[29]:(53 x 94%+12)/(53 x+12)=0.951076923.From this formula we can be seen that setting the observation period to 8 months ensures that more than 95% of repeat purchases of the customer’s repeat purchase behavior is calculated during our observation period.
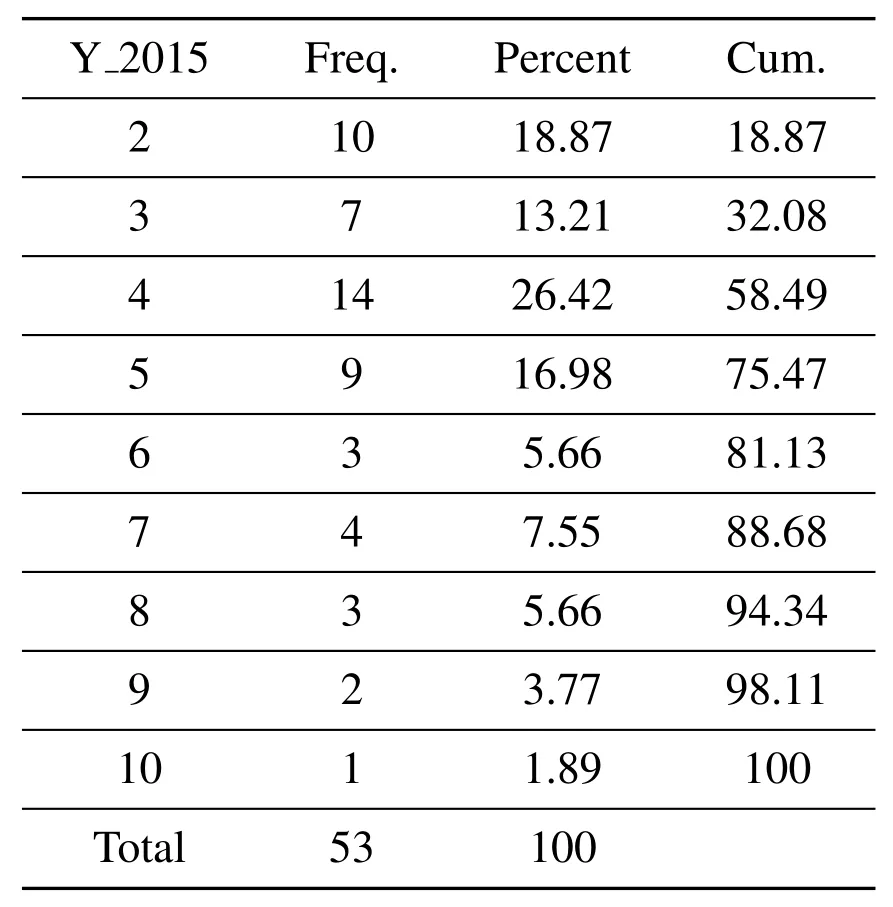
Table 6.Cosmetics life cycle 2015.
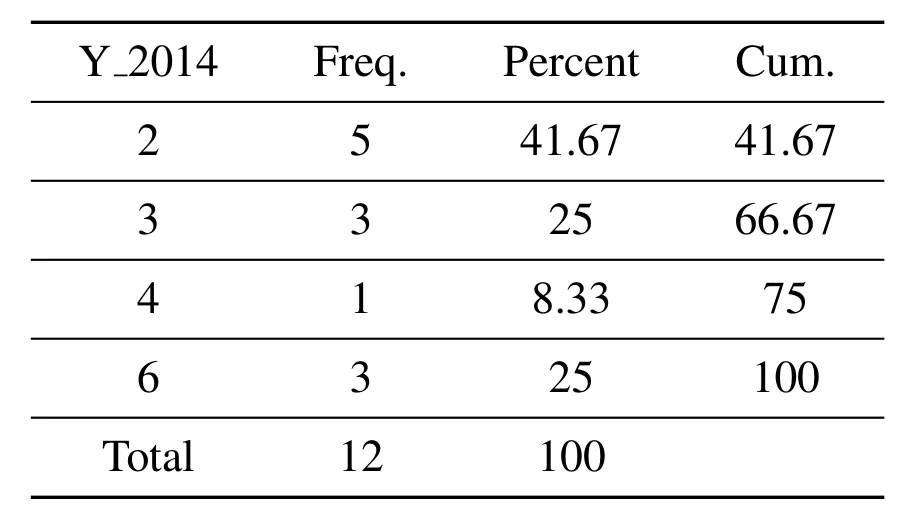
Table 7.Cosmetics life cycle 2014.
5.2 Data Processing
Prior to the use of model predictions,there were 1037 samples during t1 observation period obtained through data filtering,PivotTable,multi-table connection queries,and a total of 1648 purchases between 2015-8-1 and 2016-4-31 with 611 additional data.There were 53 repeat purchases twice or more,25 of which were purchased from the t1 period,and the 25 customers generated a total of 70 purchases,meaning that the number of repeat purchases before 2016-4-31 was 45.
5.3 Results Analysis
The following estimates are obtained from the Analysis of customer behavior of a brand of cosmetics by the Pareto/NBD model:
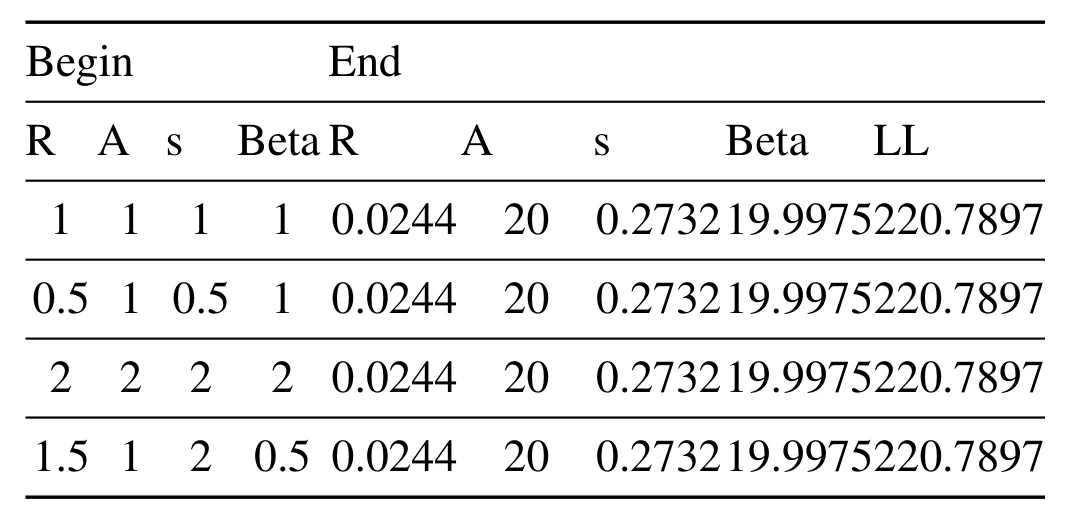
Table 8.Estimates of retention analysis parameters.
From the trading process parameters,we see that when the customer is active,the average purchase rate is r/a=0.00122 per week.You can see that even the model predicts that customers who are more active buy products 1 to 2 times every two years.In today’s online shopping is very convenient era,at the same time,fast food is a competitive market,their substitutes are numerous.Customers in the choice of products will be compared and try the psychology,so that even if the use of the product cannot reach two years,but for customers beyond their consumption cycle of long-term observation is very necessary,because customers after the use of the product is very likely to temporarily transfer to other similar products,and then through their own experience to compare their preferred,and then retain their own consumption choices.
We should emphasize that even a simple statistic like this cannot be calculated directly because we don’t know when a client will leave.R value 0.0244 represents a medium-level heterogeneous level of transaction rates across customers(Schmittlein et al.1992).The estimated average drop-out rate is S/β=0.01366.For customers with this ratio,the probability that the account will become inactive next month is 1-(-0.056)=0.946819476,considering that the account has not become inactive.Such an account is unlikely to “survive”for more than a year.However,the second characteristic of the drop-out rate distribution indicates that few customers are really close to the average drop-out rate of 0.72.Recall that S is the homogeneity index of the dropout rate:the value of S is very small.(For example,this gamma distribution has a much fatter tail than the exponential distribution.)As a result,some customers have very small dropout rates(and may remain in the company for long periods of time),while others have significant dropout rates and become inactive within the first few months of the initial trial.At least for long-term customers,these inferences seem reasonable.Even a cursory examination of the database reveals the existence of a large number of early dropouts.This chart does not exclude the first purchase.From this chart we can see a surge in customer purchases in the first 10 weeks,i.e.the promotion brought a large number of new users.But we can also see clearly from the graph that this new user’s future repeat purchases stopped at about 45 weeks.During week 10 and week 15,the estimated effects and actualities of the Pareto/NBD model were largely in line with the actual situation.We can see that for the average month,the model and the real value already have a better fit effect.For individual monthly display anomalies,we guess that the new customer growth is due to the enterprise’s marketing,so in the model use,the next step we will take into account the enterprise promotion,customer purchase reviews and other factors,and then through non-linear SVR fitting,the new customer base volume reach edgy effect.
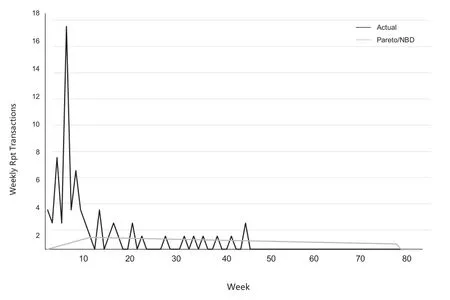
Figure 3.Repeat purchase forecast verification.
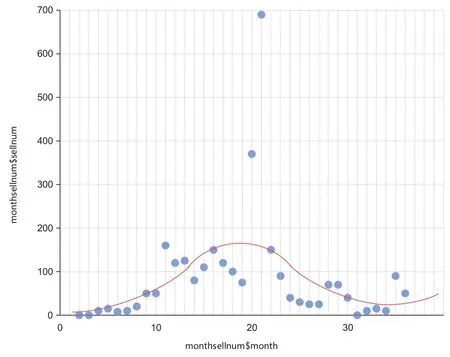
Figure 4.New user sales SVR fit.
VI.CONCLUSION
Machine learning models in mobile edge computing provide a new and safe way to do the data analysis about their operation data.And we show a vivid analysis process in the real practical situation.
The customer tiered forecast proposed in this paper starts with the different consumption habits of new and old customers and based on their different behavior and percentage we separate the arrival of the new customer to improve the prediction accuracy.At the same time,we still pay attention to the value of old customers.Through the Pareto/NBD model,we hope to provide some useful suggestion to help SEMs prevent customer churn and prolong the customer life cycle.
Future research will take into account the impact of the introduction of new users, such as promotions,customer purchase reviews,store ratings,etc.With the Pareto/NBD model applied,we assume that each customer’s buying cycle is constant,we may less consider the market campaign’s influence on Repeat customers arriving.Therefore,we can adjust model’s parameter to have a more accurate prediction of when the customer will buy again.
ACKNOWLEDGMENT
The work presented in this study was supported by the National Natural Science Foundation of China(Grant No.71402097),“Research on the impact of board heterogeneity on the results of reverse cross-border M & A–Based on big data analysis technology”of the 4th tutor academic leadership program of Shanghai International Studies University.
- China Communications的其它文章
- A Key Management Scheme Using(p,q)-Lucas Polynomials in Wireless Sensor Network
- Pilot Allocation Optimization Using Enhanced Salp Swarm Algorithm for Sparse Channel Estimation
- Put Others Before Itself:A Multi-Leader One-Follower Anti-Jamming Stackelberg Game Against Tracking Jammer
- DCGAN Based Spectrum Sensing Data Enhancement for Behavior Recognition in Self-Organized Communication Network
- On Treatment Patterns for Modeling Medical Treatment Processes in Clinical Practice Guidelines
- Hybrid Recommendation Based on Graph Embedding

