Hybrid Recommendation Based on Graph Embedding
Cheng Zeng,Haifeng Zhang,Junwei Ren,Chaodong Wen,Peng He,*
1School of Computer Science and Information Engineering,Hubei University,Wuhan 430000,China
2Hubei Province Engineering Technology Research Center for Software Engineering,Wuhan 430000,China
3Hubei Engineering Research Center for Smart Government and Artificial Intelligence,Wuhan 430000,China
Abstract:In recent years,online reservation systems of country hotel have become increasingly popular in rural areas.How to accurately recommend the houses of country hotel to the users is an urgent problem to be solved.Aiming at the problem of cold start and data sparseness in recommendation,a Hybrid Recommendation method based on Graph Embedding(HRGE)is proposed.First,three types of network are built,including user-user network based on user tag,househouse network based on house tag,and user-user network based on user behavior.Then,by using the method of graph embedding,three types of network are respectively embedded into low-dimensional vectors to obtain the characterization vectors of nodes.Finally,these characterization vectors are used to make a hybrid recommendation.The datasets in this paper are derived from the Country Hotel Reservation System in Guizhou Province.The experimental results show that,compared with traditional recommendation algorithms,the comprehensive evaluation index(F1)of the HRGE is improved by 20% and the Mean Average Precision(MAP)is increased by 11%.
Keywords:graph embedding;hybrid recommendation;collaborative filtering;tagging
I.INTRODUCTION
In recent years,rural hotel industry has become increasingly popular,and the online reservation systems are consequently more and more popular.As a result,providing the personalized recommendation for users is the crucial part of reservation system,which enables users to quickly and accurately find the houses they really need.The recommendation system is mainly designed to find the latent needs of users and helps them make decisions[1,2].However,the traditional recommendation algorithms cannot solve some problems,such as data cold start and data sparsity[3–5].
Therefore,in order to solve these problems,we construct three types of networks:(1)user-user network based on user tag,aiming to solve the problem of user cold-start;(2)house-house network based on house tag,aiming to solve the problem of house cold-start;(3)user-user network based on user behavior,aiming to solve the problem of personalized recommendation.At the same time,in the process of building these three networks,the first-order and second-order relationship of nodes in the network are fully considered to solve the problem of data sparsity.
After three networks are established,the method of graph embedding is used for mapping the nodes in these networks into low-dimensional dense vectors,and finally the vectors are used for hybrid recommendation to meet user demands.The rest of paper is organized as follows:Section II summarizes the related work.Section III introduces the overall flow of the HRGE method proposed in the paper. Section IV gives a detailed description of the HRGE method for hybrid recommendation,including the modeling and embedding learning of three types of networks;In Section V we describe the datasets,the experimental setup and results,and discuss on the reported results.Finally,the work is concluded in Section VI.
II.RELATED WORK
At present recommendation algorithms are important information filtering methods,among which Collaborative Filtering(CF)is widely used in large-scale recommendation engines due to its high efficiency,accuracy and scalability[6].But it cannot perfectly solve the problem of user-cold-start or item-cold-start.
In order to enhance the performance of personalized recommendation,social relations were utilized.Jiang et al.[7]took users’social relations into account,and proposed a recommendation method to analyze familiarity and preference similarity between users.Xue et al.[8]introduced a mathematical model of recommendation,which took advantage of the network structure based on social community and considered the individual bias in social networks.To solve the problem of decreasing ranking performance,Rafailidis and Crestani[9]proposed a model to learn personalized ranking functions collaboratively,using the notion of Social Reverse Height.Experiments showed that the model performed better than the state-of-the art CF models.
In recent years,the network embedding method[10,11],also known as network representation learning,is adopted in the process of recommendation.Representation learning is a kind of feature representation of data in a broad sense,while network embedding method is more focused on the representation of network,aiming to restore the relationship of nodes in original space as much as possible in a more intuitive and efficient way.It is to map each node in network into a low-dimensional dense real vector,which can not only reduce the computational overhead in time and space,but also improve the performance of node vectors in various tasks of network analysis.
Yang et al.[12]proposed a semi-supervised learning method based on graph embedding,but it only learns node vectors on one graph.Xie Min et al.[13,14]applied network representation learning to the field of location recommendation.Paul Covington et al.[15]proposed a method of representation learning based on deep neural network for recommendation on YouTube.Google’s recommendation for apps on Google Play use the Wide and Deep model, which uses a combination of DNN and traditional generalized linear models[16].Paul Covington et al.[17]describes that video recommendations in YouTube are modeled using DNN to validate the nonlinear interactions of hundreds of features.Perozzi et al.[18]proposed DeepWalk method and used the word2vec for the representation of the first-order similarity of graph nodes.Grover et al.[19]proposed the node2vec method,which can adjust the direction of random walk to a certain extent.He X et al.[20]add the information of the user-commodity network into the NCF model,and then use the multi-layer perceptron to obtain the nonlinear relationship between the user and the commodity,and finally calculate the similarity among users to recommend.Liu et al.[21]uses the node access sequence as the input of skip-gram and obtains the node vector.However,these methods mentioned above all use a single or double network structure and do not make full use of the node’s auxiliary information.
Shi et al.[22]used heterogeneous graph neural networks to gather neighbors based on multi-hop metapaths to inject high-order semantics into node embeddings,and used the attention mechanism to fuse the semantics of multiple meta-paths to obtain rich highlevel semantics.Bi et al.[23] first tried to learn more effective user and item latent features in both source and target domains.In the source domain,they use Gated Recurrent Unit(GRU)to module users’dynamic interests.In target domain,given the complexity of insurance products and the data sparsity problem,an insurance heterogeneous information network is constructed,which uses three levels of attention aggregation(relationships,nodes and semantics)to obtain insurance product representations.After obtaining the latent features of overlapping users,the feature mapping between the two domains is learned through the multi-layer perceptron(MLP).In the process of building the three networks,the first-order and secondorder relationship of nodes in the network are fully considered to solve the problem of data sparsity.
After three networks are established,the method of graph embedding is used for mapping the nodes in these networks into low-dimensional dense vectors,and finally the vectors are used for hybrid recommendation to meet user demands.
III.OVERALL SOLUTION
The overall flow of the HRGE method proposed in the paper is shown in Figure 1.
(1)The user-user network and the house-house net-work are respectively constructed through user tag and house tag,and the vector representation of the nodes in two types of networks is calculated by the graph embedding method.The node vector is used to calculate the similarity between users and the house.Therefore,the problem of user cold-start and house cold-start in recommendation can be solved.
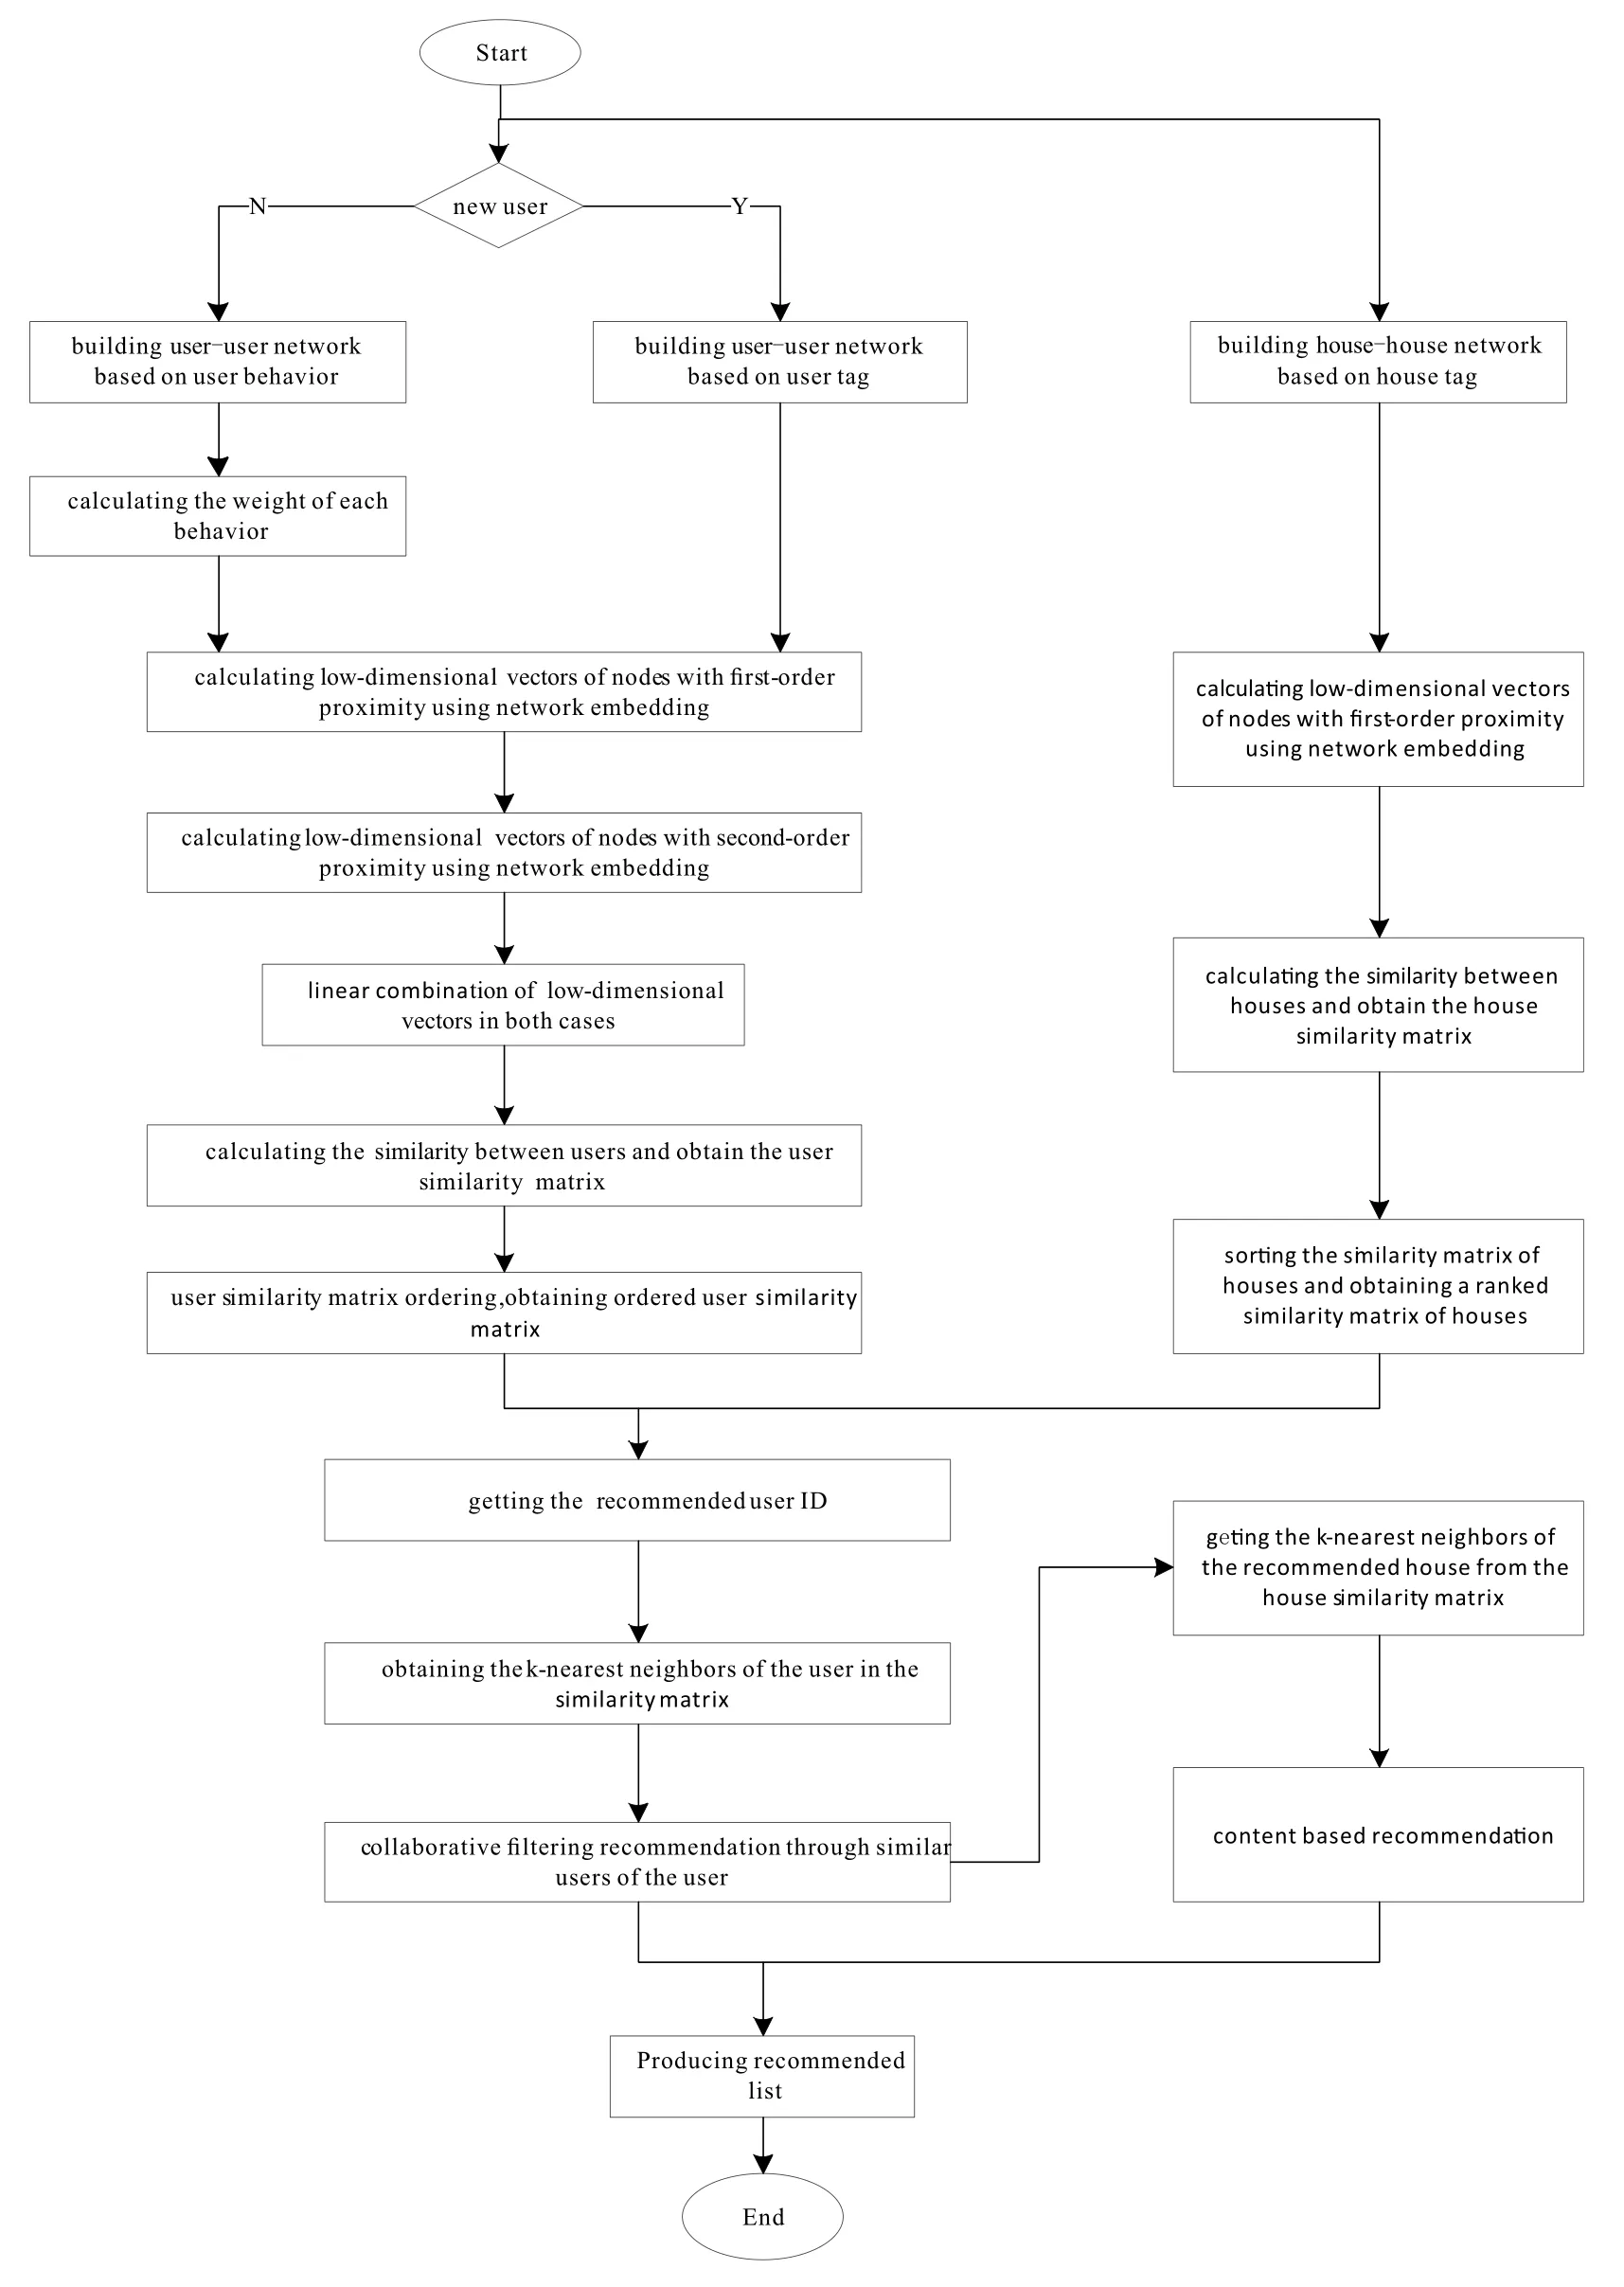
Figure 1.Recommended flow chart.
(2)Use the contrast scale weight method to calculate the weight value of each user’s behavior,and build a user-user network from user behavior data.
(3)In order to solve the sparse problem of user tag data and user behavior data,the paper not only considers first-order proximity between nodes,but also second-order proximity between nodes,that is,by increasing the high-order nodes neighbors(such as neighbors’neighbors)to extend the neighbors of these nodes,thus solving the sparse problem caused by the scarcity of user data.
(4)Calculate the similarity between users by the feature vector of user node,and calculate the similarity between houses by the feature vector of the house node.Finally,using a hybrid recommendation algorithm,the Top-N house is recommended to users.The structure and definitions used in the algorithm are introduced for ease of reading.
Definition 1.user tag:The user has his or her own hobby tag.For user u,the user tag set Tucan represent user u’s own tag set<u,t>,and the data set T1={Tu:u∈U}is the collection of tags record for all users.
Definition 2.user behavior:When users use the hotel reservation system,they will produce various behaviors,such as browsing,collecting,purchasing and so on.The behavior b generated by a user u on the property h can be represented by the triplet<u,h,b>,and the triple is called Bu.Dataset B is a collection of behavioral data generated by all users.
Definition 3.user co-occurrence:When two users have the same tag or have behavior for the same house,then they are called co-occurrence.
When data set of user tag is given,the number of cooccurrences between the user pairs is first counted by user’s tag to determine the weight between two users;If user behavior data is used,the weight of each user’s behavior needs to be calculated first.Then two types of user-user networks are built through data sets T and B.The definition of the user-user network is described below.
Definition 4.user-user network:The user-user network is mainly constructed by extracting co-occurrence information between user pairs.The user-user network can be represented as a weighted undirected graph NETu-u=(U,E),where U={u1,u2,u3,...,um}is the set of users,E={eij|i=1,2,3,...,m;j=1,2,...,m},where eij=wijrepresents the co-occurrence information between users.The weight wijbetween the uiand ujis the number of co-occurrences between the user tag set T and the user behavior set B.
According to the above definition, two types of useruser networks can be constructed through user tag set T and user behavior set B.Figure 2 is a user-user network based on user tags.In the process of constructing user-user network through user tag,whether each user in the user tag and other users have the same tag is analyzed,thereby the weight of user-user network is obtained.In this example,both User 1 and User 2 have Label 1 and Label 2,so in the user-user network,the weight of the edge of the corresponding node of User 1 and User 2 is 2.
Figure 3 is a user-user network based on user behavior.In the process of building a user-user network through user behavior,whether users and other users generate behaviors for the same house is analyzed.The weights corresponding to the various behaviors are calculated by using the contrast scale weight method.The weight between two user nodes in network is the sum of behavior weights generated by two users for the same property.The weight between user_1 and user_2 in Figure 2 is the weight of user_1’s behavior on h_2 and h_3 plus the weight of user_2 on h_2 and h_3.
Definition 5.house tag: When the background administrator adds housing information in the background management system,the property will be tagged.For the house h,the house tag set Thcan represent the tag collection of the house h itself<h,t>,the data Set T2={Th:h∈H}is a collection of tag records for all houses.
Definition 6.house-house network:It is built by finding co-occurrence information between the pair of houses from house tag data set.The house-house network can also be expressed as a weighted undirected graph of NETh-h=(U,E)where U={u1,u2,u3,...,um} is the set of house,E={eij|i=1,2,3,...,m;j=1,2,...,m},and eij=wijrepresents the degree of similarity between the houses.
Finally,the user-user network is built separately through user behavior and user tags.When the system determines that the user is a new user,the useruser network will be constructed through user tag information,and the vector representation of the user is represented by graph embedding method.Then user similarity matrix is calculated,and the Top-N recommendation is finally completed,thereby solving the cold start problem of users.If the user is not a new user,then user’s behavior data in system will be used to build user-user network.User similarity matrix can be then got in the same method,and finally users will be provided with Top-N recommendation.
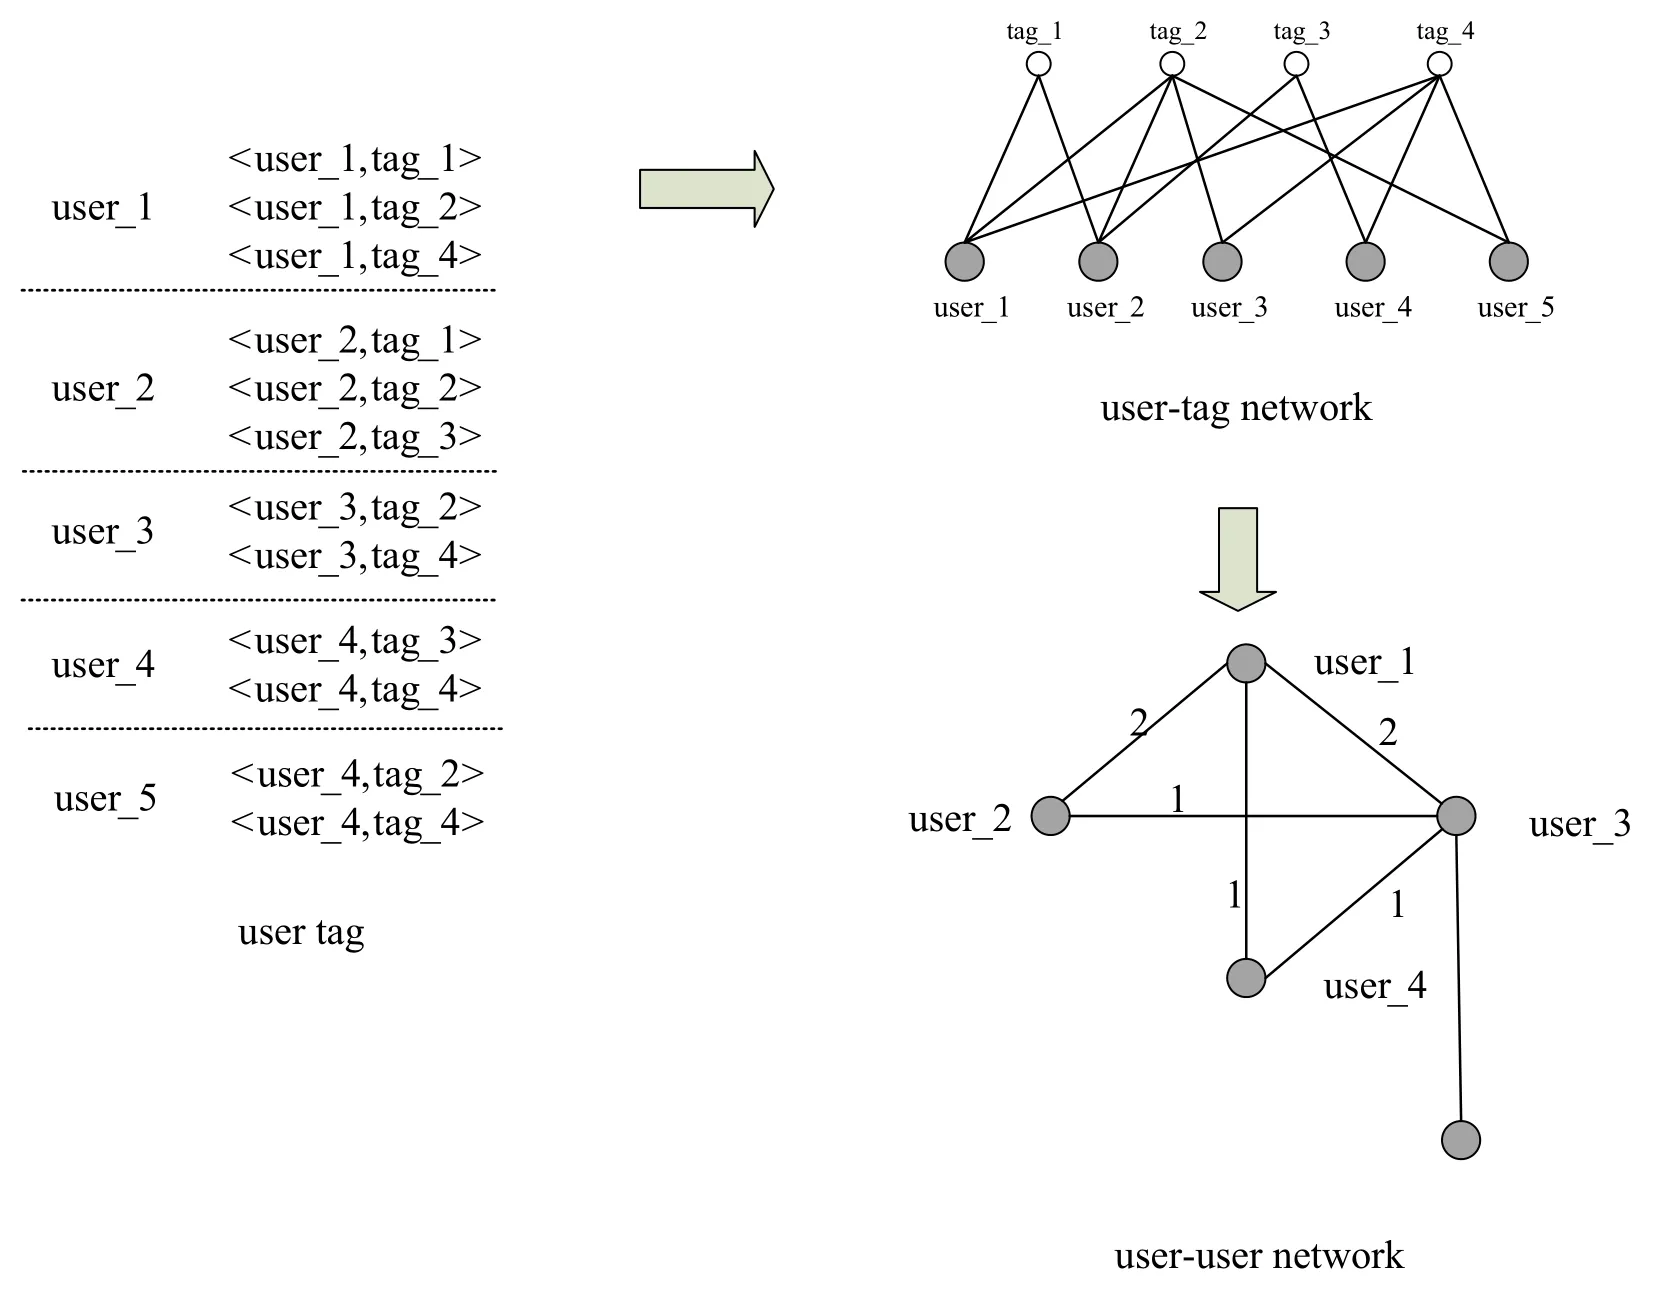
Figure 2.User-user network based on user tag.
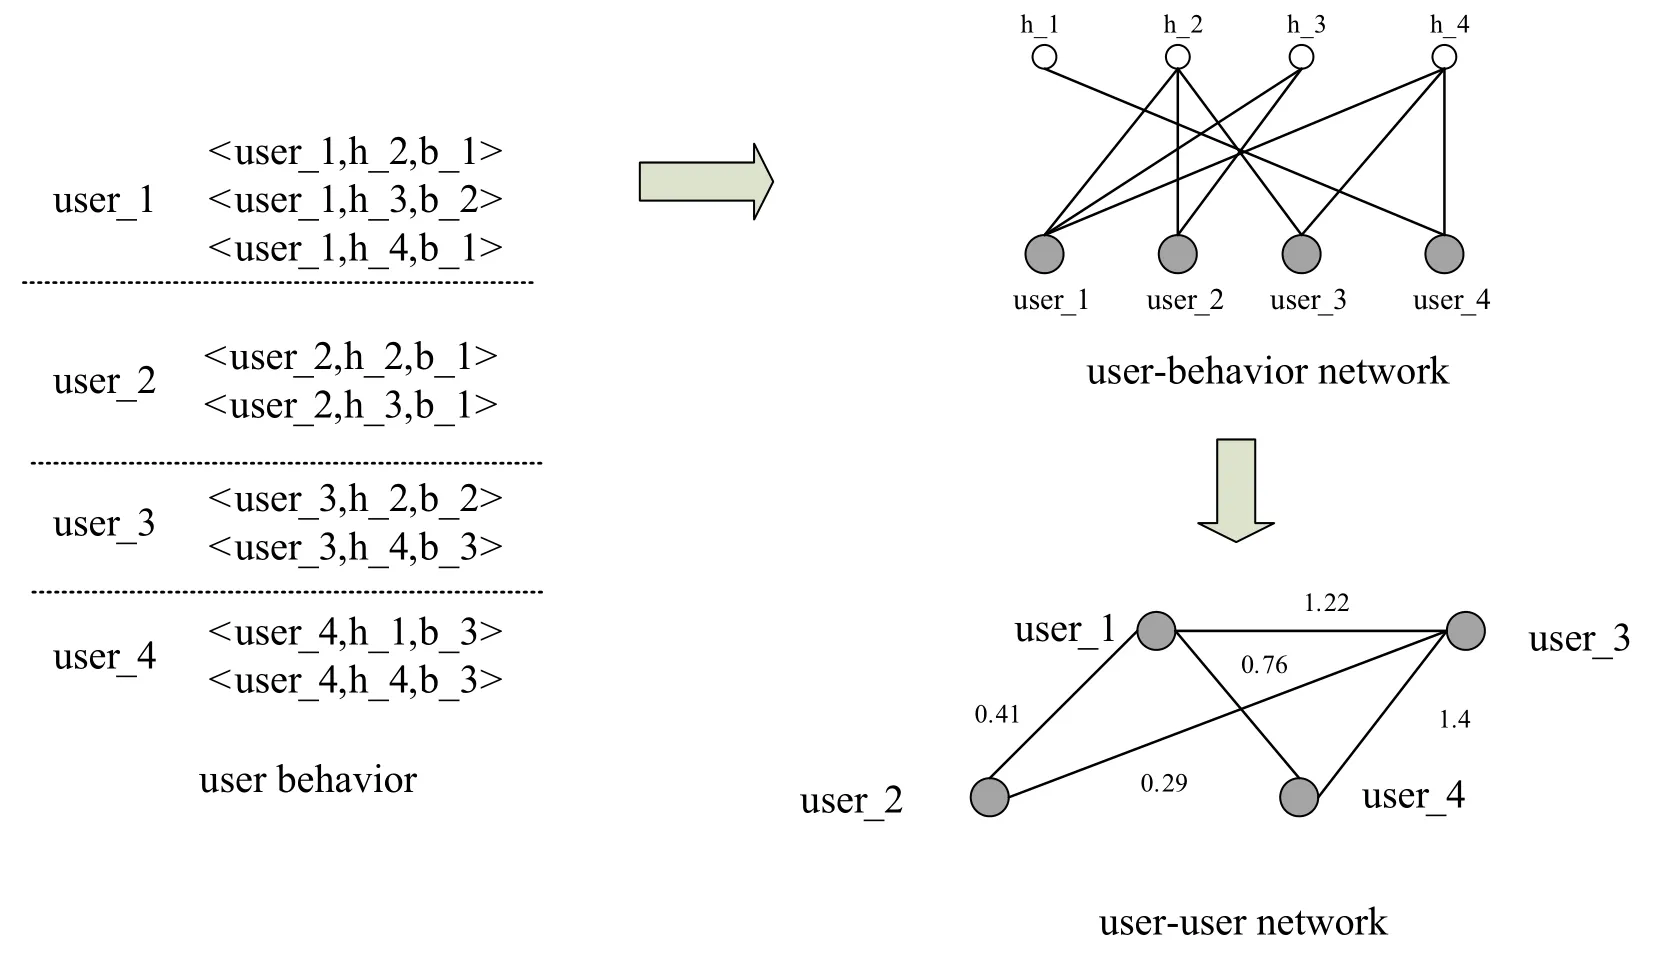
Figure 3.User-user network based on user behavior.
IV.RESEARCH METHODS
4.1 First-order Proximity and Second-order Proximity of Graph Embedding
First order proximity:The model is only applicable to undirected graphs.For an undirected edge(i,j)in the user-user network,define the sharing probability of two nodes uiand ujas follows:

uiand ujin formula(1)are vectorized representations of nodes i and j in network,which is equivalent to describing the degree of intimacy between nodes from the perspective of Embedding.The measure of the intimacy of two nodes will be gained from the data structure of network.

In formula(2),wijis the weight of the edge between nodes i and j,and W is the P sum of weights of all edges in network,that is,W=(i,j)∈Ewij.To ensure the reliability of first-order proximity,the smaller the distributing differences of p1andare,the better.The optimization of objective function is as follows:

The distributing differences between two probabilities is measured by the d()function.In this paper,KL divergence is chosen,and(3)can be optimized as:


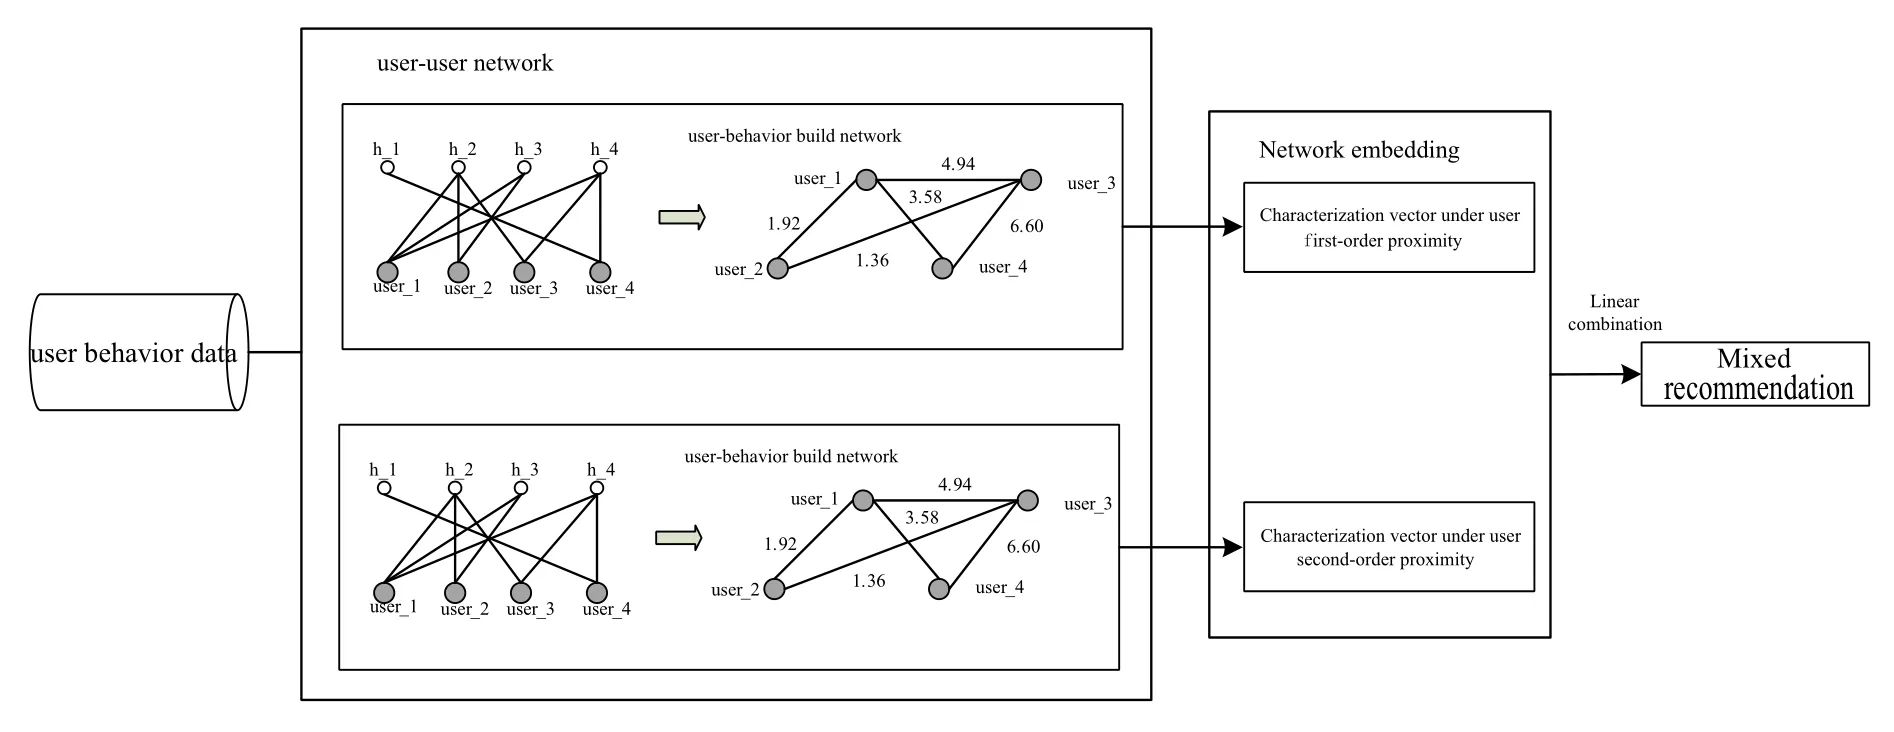
Figure 4.Application of graph embedding method.
4.2 Hybrid Recommendation Based on Graph Embedding
4.2.1 Application of Graph Embedding Method.
In the house recommendation,it is necessary to consider not only the first-order proximity of the nodes in the network,but also the second-order proximity.Figure 4 takes the user behavior data as an example to describe the application of the graph embedding method in the house recommendation.
4.2.2 HYBRID Recommendation
The content-based and collaborative filtering recommendation algorithm are two popular algorithms in the current recommendation system.Each has its own advantages and disadvantages.Combining the two algorithm ideas can make up for the advantages.As shown in Figure 5,this article is recommended to use a streamlined design,based on collaborative filtering,supplemented by content-based recommendations.The recommendation based on the user graph embedding method is to obtain the user similarity matrix through the user-user network,and to perform the housing recommendation among the users with the same preferences.Based on the above calculation,the eigenvector→uiof each user can be obtained.In this paper,the cosine similarity is used to calculate the similarity between users,and a similar user set S(u)is obtained.

Whether the user u selects the listing h or not depends on the user selection in the similar user set.For the listing h,the probability that the user u chooses it is calculated as follows:

Where rvhrepresents the degree of likeness of the similar user v of the user u to the house h,and N(h)is the set of users who have selected the house h.Finally,we get a list of the probability that the user u is interested in the houses that have not been paid attention to,and give priority to the houses with high probability.
4.3 Contrast Scale Weight Method
The user behaviors in the hotel reservation system include:browsing,collecting and purchasing.This article uses the comparative scale weight method to determine the user’s preference for the property under different behaviors.It refers to the relationship between things and discrete variables, so the concept of weights can be used on categorical variables.The criteria for quantitative assignments will be determined by different weights for each category of indicators.Firstly,according to the principle of AHP,a categorical variable is assigned according to certain rules,and then according to the importance degree between each class,finally according to the scale method from 1 to 9,one by one to compare the scale,construct the following judgment matrix.

Figure 5.Pipeline hybrid design.
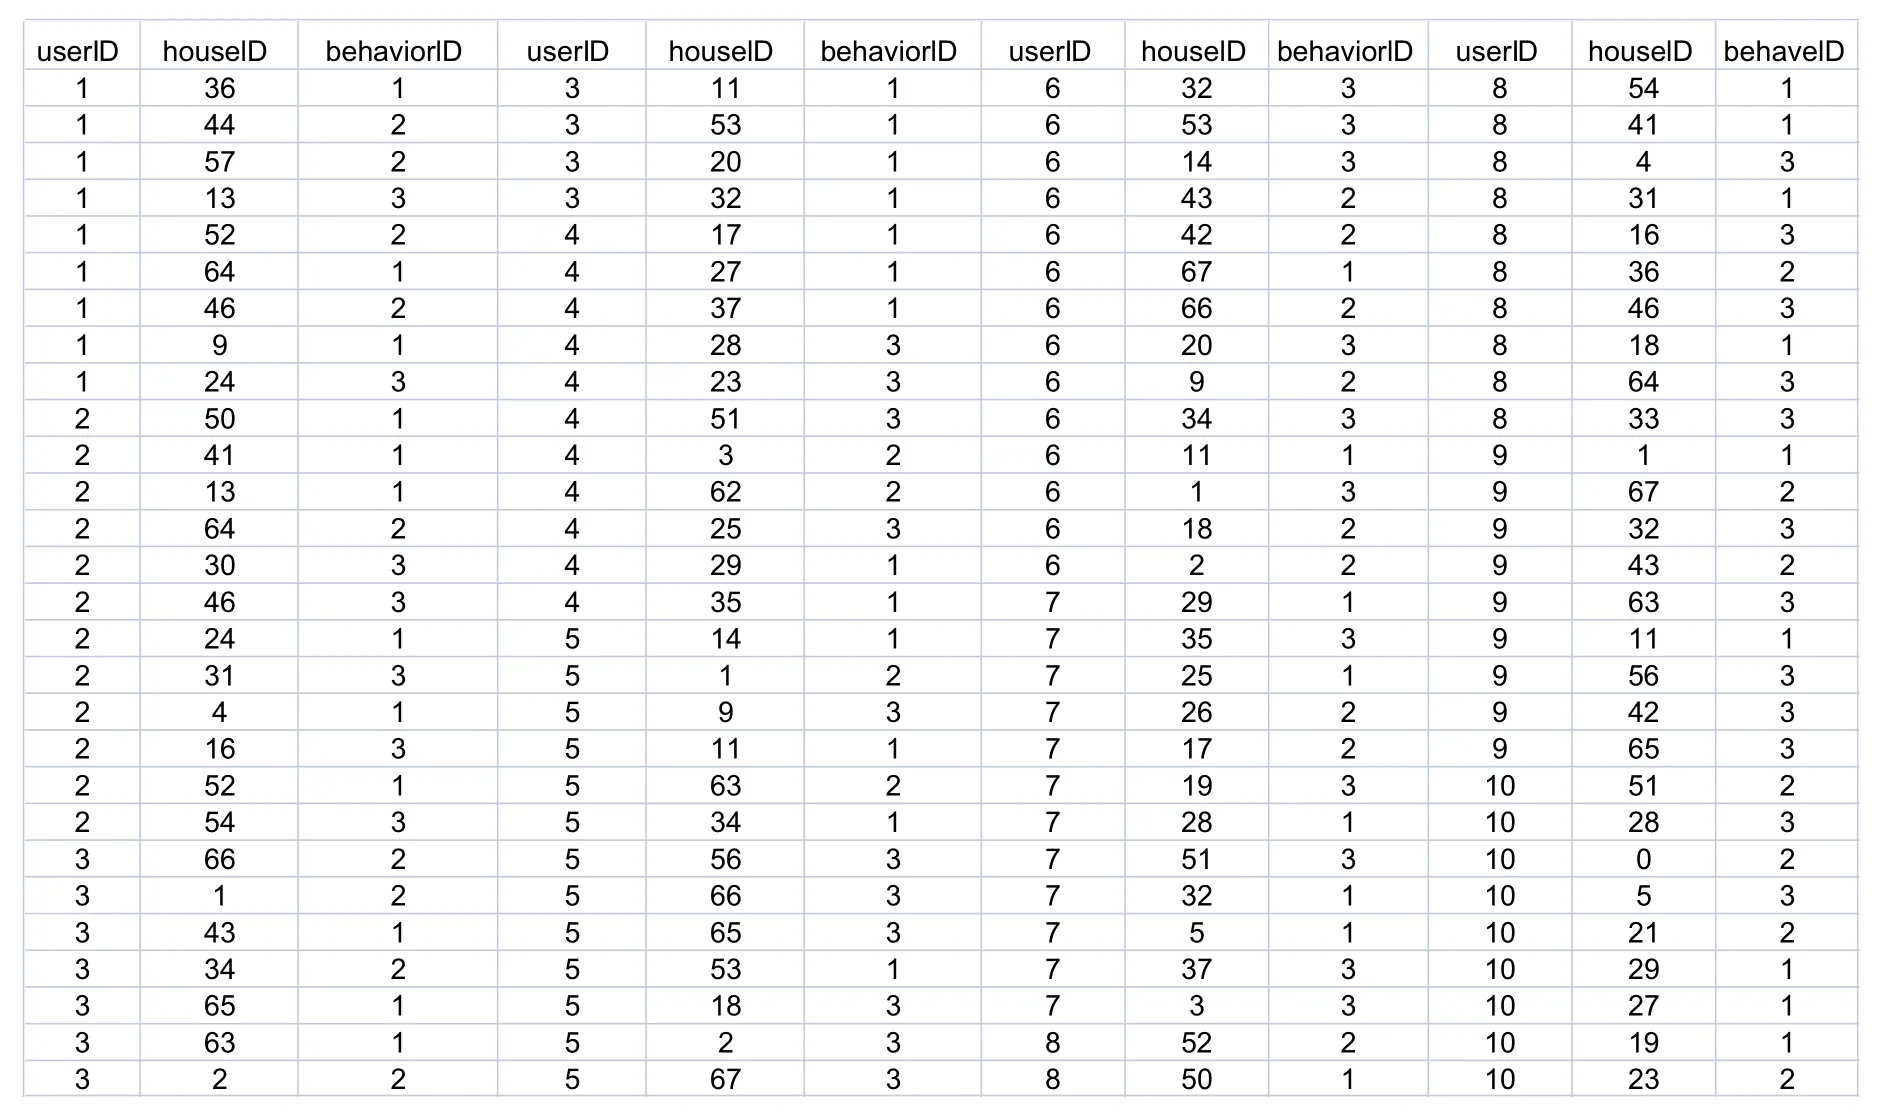
Figure 6.User behavior data set.

4.4 Evaluation Metrics
The following measures are used to evaluate the prediction accuracy.


Precision@K:This measures the fraction of the topk services that are indeed consumed by the target user:

F1@K:This is a comprehensive calculation of the above two evaluation metrics:

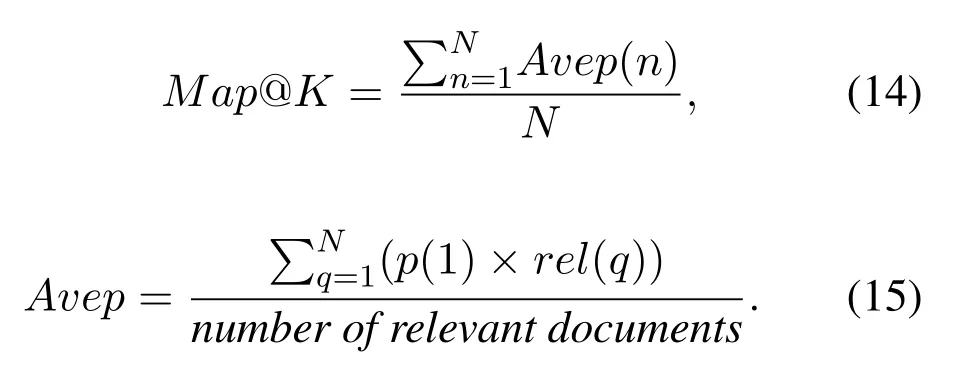
Map@K:In the MAP calculation formula,N is recommended for N users.For the list of recommended recommendations,q represents the ranking of the listings in the recommendation list,rel(q)is 1 when q is recommended for successful listing,otherwise p(q)is the accuracy of the front of the q.
V.EXPERIMENTAL ANALYSIS
5.1 Data Collection
The experimental data of the paper mainly comes from the tag data and behavior data of 200 users and the data of 150 residential houses of Country Hotel Project in Guizhou Province from May 2018 to February 2019,which is a targeted poverty alleviation project implemented by our team.
5.1.1 User Tag Data
The user registration page in house reservation system is designed to allow users to select interest tags.The tag data selected by users at the time of registration is the user tag data set.
5.1.2 User Behavior Data
Three user behaviors are defined in the hotel reservation system,namely browsing,collecting and purchasing.The collection and purchase behaviors of users are clear in the system and easy to obtain.The record of obtaining user’s browsing room in the system is mainly realized by JavaScript code in the page.
5.1.3 House Label Data
When an administrator enters the room source information in the background,the listing label will be recorded into the database at the same time and stored in the room characteristic label table.
5.2 Calculate User Behavior Weights
User behavior(browsing,collecting,purchasing)is a reflection of whether the user is interested in listing.Different behaviors indicate how much users like listing.The weight calculation of each user’s behavior is divided into the following three steps.
According to Table 1 and Table 2,the judgment matrix is constructed.According to Table 3,the two pairs of behaviors are compared to obtain the relative importance between behaviors.
5.3 Building A Network
This section takes user behavior data set as an example to build a user-user network based on user behavior.Figure 6 is a partial data set of user behavior,which is mainly composed of a user number,a house number,and a behavior number.Figure 7 is a data form after converting the data in Figure 6 into a weighted undirected graph.
The data in Figure 7 is calculated by the graph embedding method to calculate its first-order and secondorder proximity,and the user feature vectors of the two neighbors are linearly combined to obtain a vector representation of each user node,as is shown in Figure 8 Shown.
5.4 Parameter Impact Analysis
The user behavior data set is randomly extracted 25% as a test set,and the remaining data is used as a training set.For the determination of the γ value of parameter(8),variable fixing measures are adopted.Keep the similar user set S(u)=5 in the HRGE method,and the parameter γ changes from 0 to 1 in increments of 0.1 each time,recommending 4,6,8 houses for the user respectively,and then calculating the F1 value.The results are shown in Figure 9.When the γ value was 0.7,F1 is the maximum value and the service recommendation is the highest quality.
5.5 Experimental Result
In order to verify the validity of the experiment,the recommendation results of the HRGE method are compared with the results of the user-based collaborative filtering algorithm(UserCF).When γ=0.7,the target user’s similar data set S(u)length is 5,6-10 houses are recommended respectively,and then the accuracy rate,recall rate,Map value and F1 value are calculated.The results obtained by the two recommended methods are shown in Table 4.
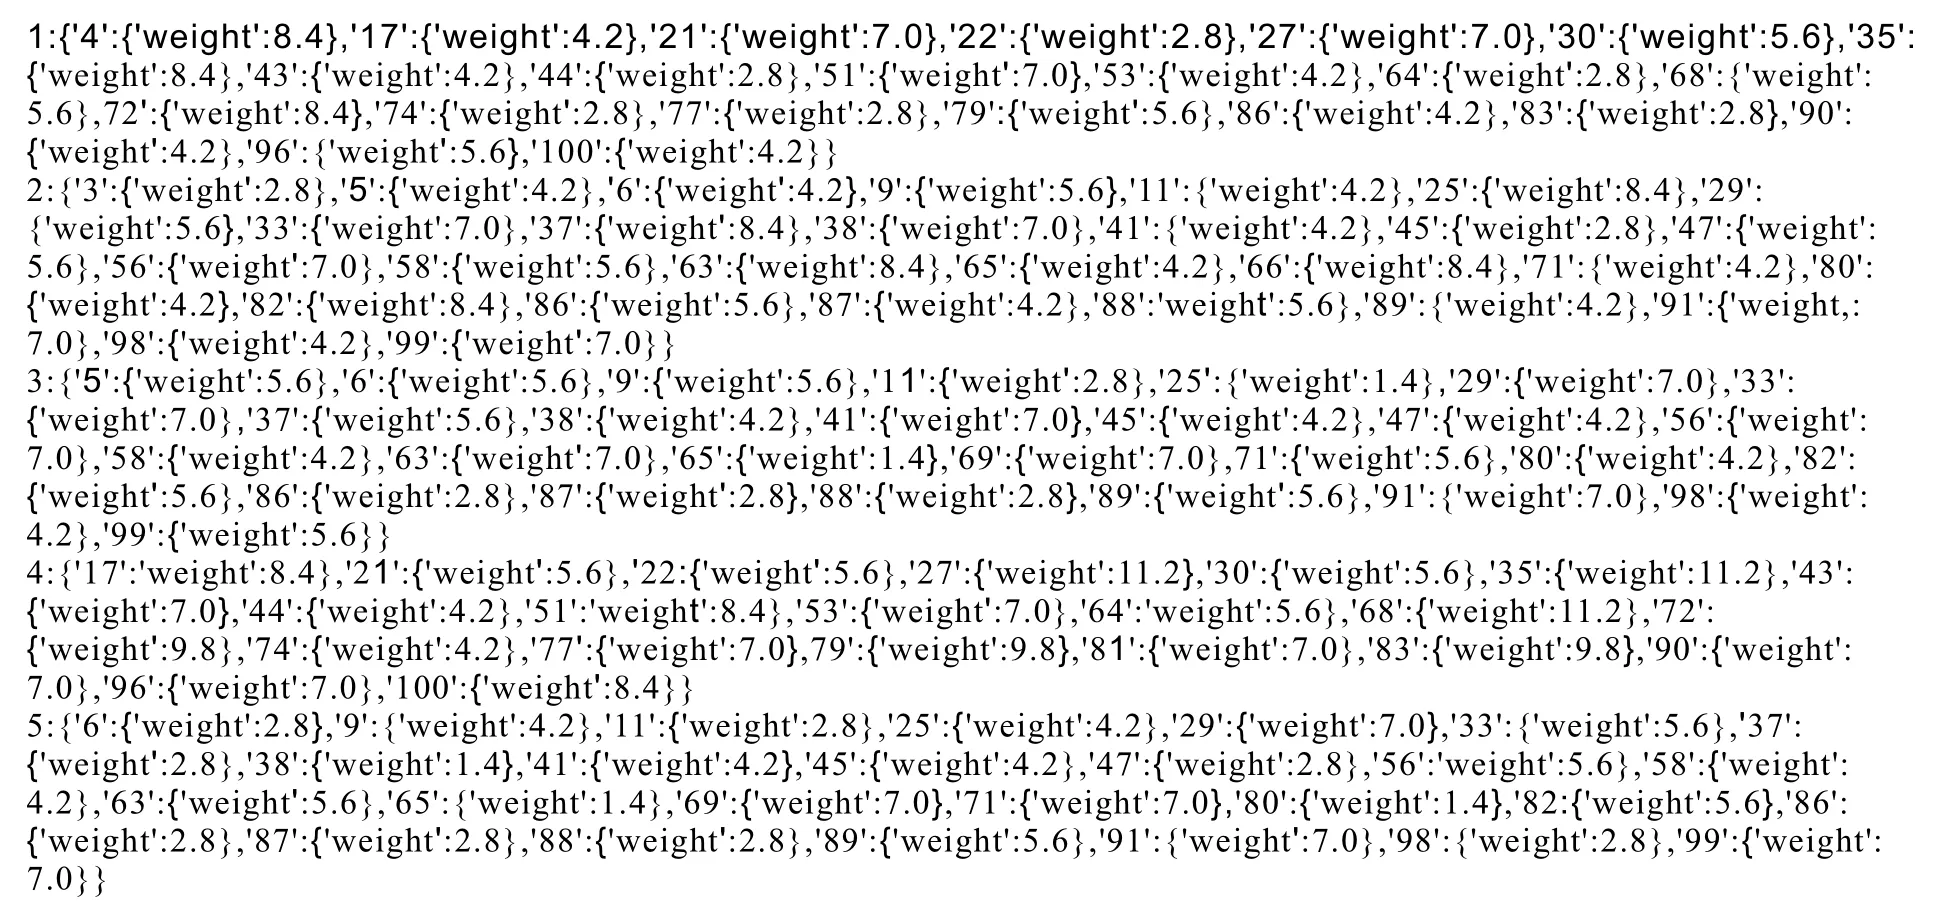
Figure 7.User-user network data form based on user.
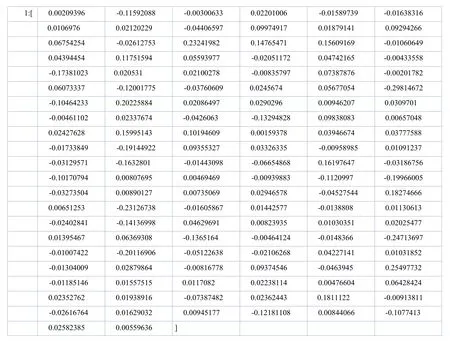
Figure 8.User feature vector.
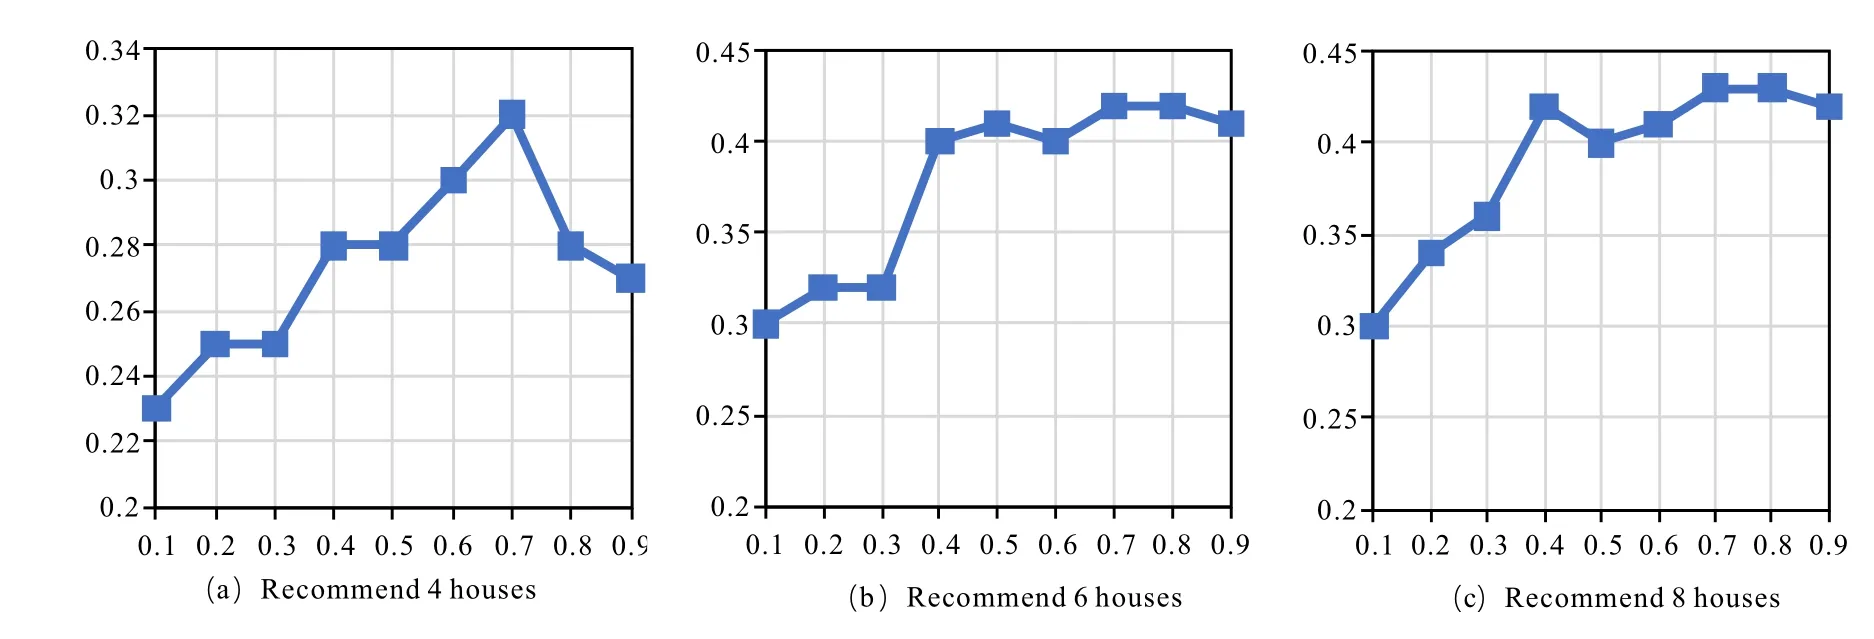
Figure 9.Effect of parameter on recommendation results.
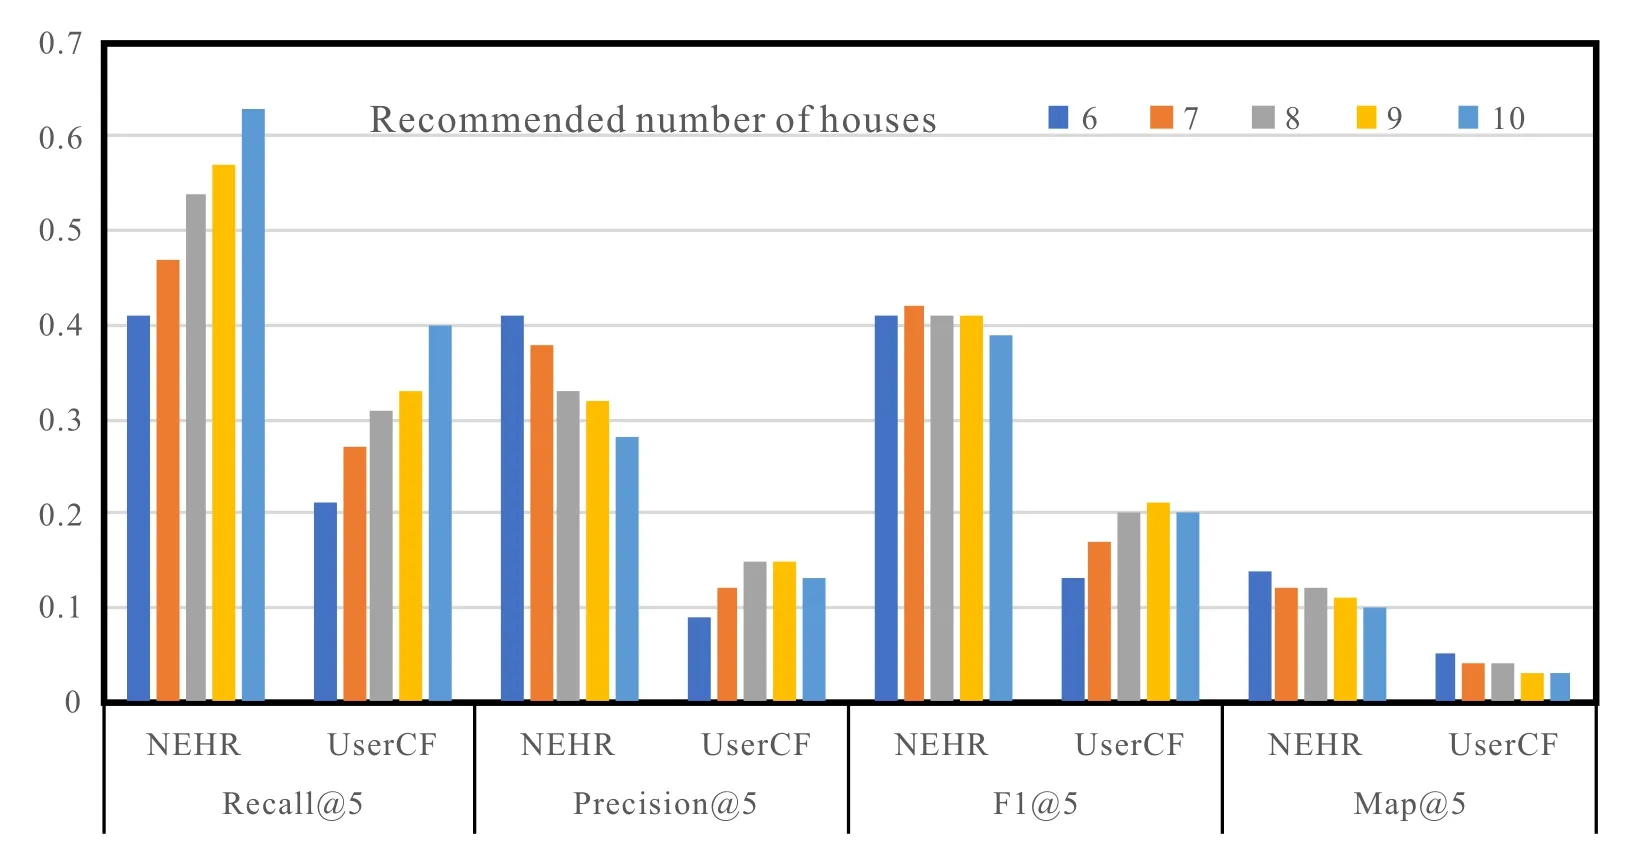
Figure 10.Experimental results(S(U)=5).
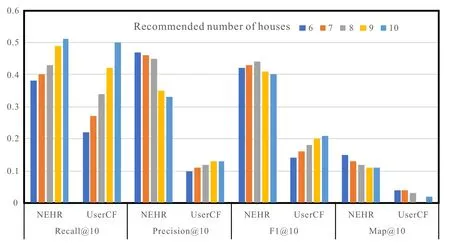
Figure 11.Experimental results(S(U)=10).

Figure 12.Detailed comparison of HRGE and UserCF experiments(S(U)=5).

Figure 13.Detailed comparison of HRGE and UserCF experiments(S(U)=10).
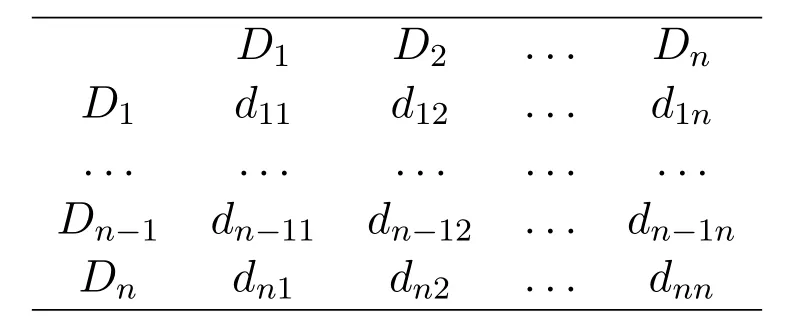
Table 1.Judgment matrix.
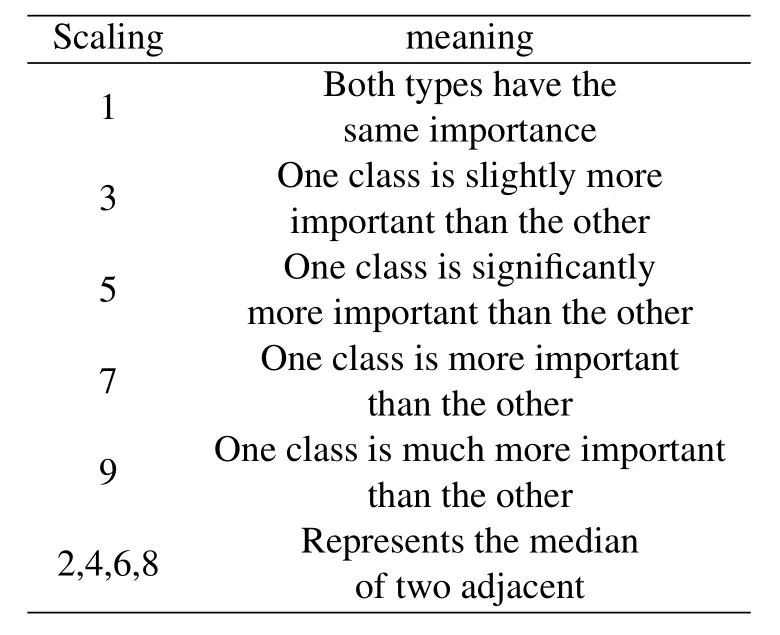
Table 2.Scale value table.
When the length of the similar data set S(u)of the target user is 10,6-10 houses are recommended respectively,and the two recommended methods are compared,as shown in Table 5.

Table 3.Comparison matrix example.
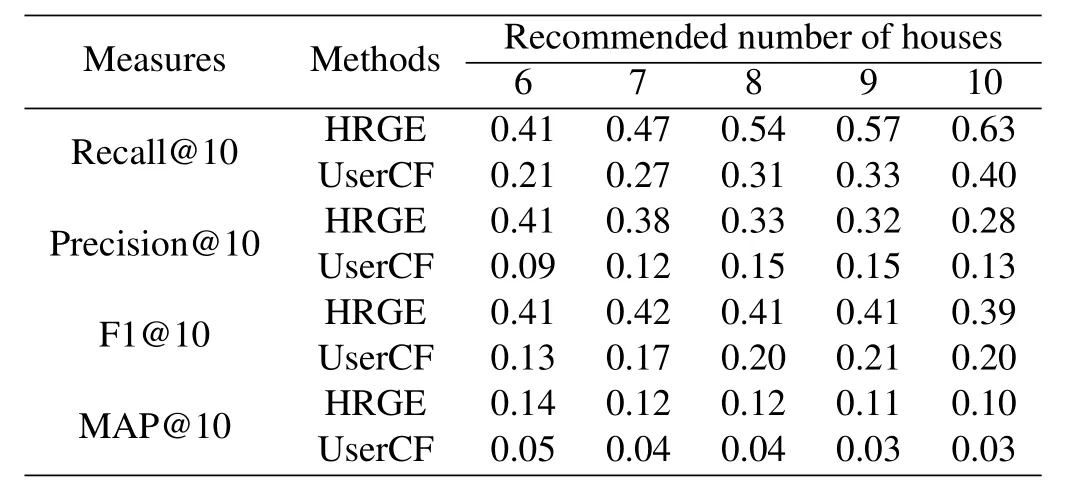
Table 4.Experimental results(S(u)=5).
Tables 4 and 5 are converted into a chart form as shown in Figure 10 and Figure 11.UNER and UserCF are compared under four evaluation indicators when S(u)takes different values.
Figure 12 and Figure 13 show in detail the pros and cons of two recommended methods for recommending 5 and 10 houses for users.
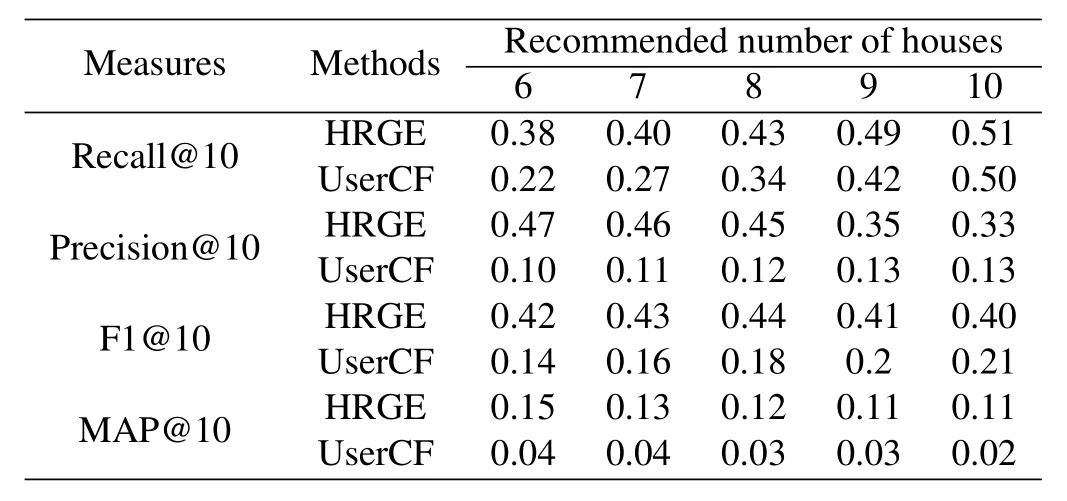
Table 5.Experimental results(S(u)=10).
VI.CONCLUSION
In this paper,we proposed a Hybrid Recommendation method based on Graph Embedding(HRGE).It can be seen from the experimental results that HRGE outperforms the collaborative filtering algorithm in comprehensive evaluation indicators.Compared with the user-based collaborative filtering algorithm,the recommended comprehensive evaluation index(F1value)of the HRGE method can be increased by 20%.
In addition,in order to improve the accuracy of recommendations,users’social network data should be included in later studies. At the same time, more users’implicit behavior data should be combined,such as the time users stay on the page,the evaluation information of users on attributes,and the time users’behaviors take place.Multi-faceted factors should also be considered to determine the weight of behavior,so that more accurate recommend list information can be provided for users.
- China Communications的其它文章
- On Treatment Patterns for Modeling Medical Treatment Processes in Clinical Practice Guidelines
- IoT-Fog Architectures in Smart City Applications:A Survey
- Pilot Allocation Optimization Using Enhanced Salp Swarm Algorithm for Sparse Channel Estimation
- Put Others Before Itself:A Multi-Leader One-Follower Anti-Jamming Stackelberg Game Against Tracking Jammer
- DCGAN Based Spectrum Sensing Data Enhancement for Behavior Recognition in Self-Organized Communication Network
- Organization-Driven Business Process Configurable Modeling for Spatial Variability

