浙贝母配方颗粒的指纹图谱建立及3种成分的含量测定
黄小兰 何旭峰 周浓 阳文武 钱林群


中图分类号 R284.1 文献标志码 A 文章编号 1001-0408(2021)20-2473-06
DOI 10.6039/j.issn.1001-0408.2021.20.07
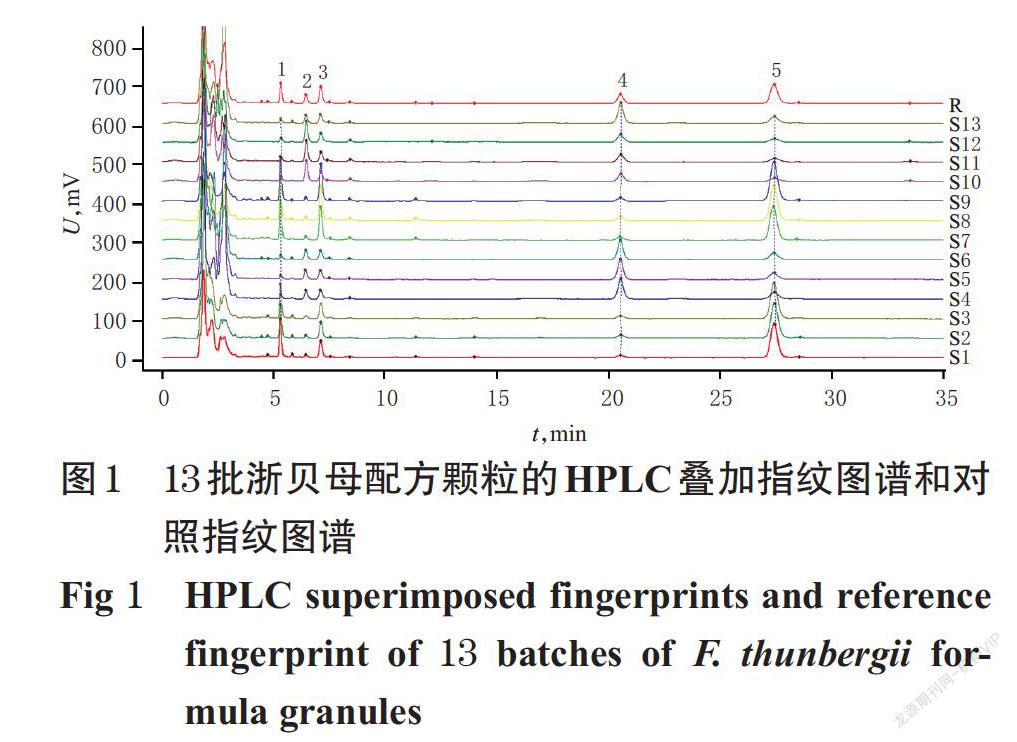
摘 要 目的:建立浙贝母配方颗粒的指纹图谱,并测定其中3种成分的含量。方法:采用高效液相色谱(HPLC)法。以贝母素乙为参照,采用《中药色谱指纹图谱相似度评价系统(2012版)》绘制13批浙贝母配方颗粒的HPLC指纹图谱,并进行相似度评价,确定共有峰;采用相同的HPLC法测定浙贝母配方颗粒中贝母辛、贝母素甲和贝母素乙的含量,并比较不同生产企业样品的质量差异。结果:13批浙贝母配方颗粒中共有5个共有峰,相似度为0.669~0.971;指认了贝母辛、贝母素甲和贝母素乙等3个共有峰。贝母辛、贝母素甲和贝母素乙检测质量浓度的线性范围分别为30.00~180.00 μg/mL(r=0.999 9)、79.58~477.50 μg/mL(r=0.999 6)、97.33~584.00 μg/mL(r=0.999 4);精密度、稳定性(24 h)、重复性试验的RSD均小于3%;平均加样回收率分别为95.82%(RSD=1.17%,n=6)、99.00%(RSD=1.96%,n=6)、95.39%(RSD=2.00%,n=6)。13批样品中,贝母辛、贝母素甲、貝母素乙的含量分别为0.17~1.02、0.52~2.26、0.70~3.50 mg/g,平均总含量为3.62 mg/g。其中,企业C、A样品中上述成分的平均总含量较高,分别为5.02、4.61 mg/g,其次是企业E、B样品,分别为3.48、3.02 mg/g;最低为企业D样品,仅为1.87 mg/g。结论:所建指纹图谱和含量测定方法简便、可行,重复性好,可用于浙贝母配方颗粒的质量评价;不同生产企业样品的含量存在一定差异。
关键词 浙贝母;配方颗粒;指纹图谱;高效液相色谱法;含量测定
Fingerprint Establishment and Content Determination of 3 Components in Fritillaria thunbergii Formula Granules
HUANG Xiaolan1,2,HE Xufeng1,ZHOU Nong2,YANG Wenwu1,QIAN Linqun2(1. Chongqing Wanzhou Food and Drug Inspection Institute, Chongqing 404100, China; 2. College of Food and Biological Engineering/Chongqing Engineering Laboratory for Green Cultivation and Deep Processing of the Three Gorges Reservoir Areas Medicinal Herbs, Chongqing Three Gorges University, Chongqing 404100, China)
ABSTRACT OBJECTIVE: To establish the fingerprint of Fritillariae thunbergii formula granules and determine the contents of 3 components. METHODS: HPLC method was used. Using peiminine as reference, HPLC fingerprints of 13 batches of F. thunbergii formula granules were drawn with Similarity Evaluation System of TCM Chromatogram Fingerprint(2012 edition). Similarity evaluation and common peak identification were conducted. The contents of peimisine, peimine and peiminine in F. thunbergii formula granules were determined by the same HPLC method. The quality difference of samples were compared among different manufacturers. RESULTS: There were 5 common peaks in 13 batches of F. thunbergii formula granules, and the similarity was 0.669-0.971. Three common peaks of peimisine, peimine and peiminine were identified. The linear ranges of peimisine, peimine and peiminine were 30.00-180.00 μg/mL (r=0.999 9), 79.58-477.50 μg/mL (r=0.999 6) and 97.33-584.00 μg/mL (r=0.999 4), respectively. RSDs of precision, stability (24 h) and reproducibility tests were all lower than 3%. The average recoveries were 95.82% (RSD=1.17%,n=6), 99.00%(RSD=1.96%,n=6) and 95.39%(RSD=2.00%,n=6), respectively. In the 13 batches of samples, the content of peimisine, peimine and peiminine were 0.17-1.02 mg/g, 0.52-2.26 mg/g, and 0.70-3.50 mg/g, respectively. Their average total content was 3.62 mg/g. The average total content of manufacturer C and A was higher (5.02 mg/g and 4.61 mg/g), followed by manufacturer E and B (3.48 mg/g and 3.02 mg/g); the lowest was manufacturer D (only 1.87 mg/g). CONCLUSIONS: Established fingerprint and content determination method is simple, feasible and reproducible, which can be used for the quality evaluation of F. thunbergii formula granules. There are some differences in content among different manu- facturers.

