Influences of pulse frequency on formation and properties of composite anodic oxide films on Ti-10V-2Fe-3Al alloy
Xu DAI ,Chen WEN ,Ling WU,c,* ,Lei LIU ,Yulong WU ,Xingxing DING ,Jiho WU,Wenjun CI,Aito TANG,Fusheng PAN,c
a State Key Laboratory of Mechanical Transmission,College of Materials Science and Engineering,Chongqing University,Chongqing 400044,China
b Beijing Spacecrafts,China Academy of Space Technology,Beijing 100094,China
c National Engineering Research Center for Magnesium Alloys,Chongqing University,Chongqing 400044,China
KEYWORDS Composite anodic oxide film;PolyTetraFluoroEthylene(PTFE);Pulse frequency;Titanium alloy;Wear resistance
Abstract A thick composite anodic oxide film was fabricated in an environmentally friendly malic acid electrolyte containing PolyTetraFluoroEthylene (PTFE) nanoparticles on Ti-10V-2Fe-3Al alloys.The influence of pulse frequency on the morphology,microstructure and composition of composite anodic oxide films containing PTFE nanoparticles was investigated using Field Emission Scanning Electron Microscopy (FE-SEM) equipped with Energy Dispersive Spectroscopy (EDS),Atomic Force Microscopy (AFM) and Raman spectroscopy.The tribological properties in terms of the friction coefficient,wear loss and morphology of worn surfaces were measured by ball-ondisc tests.The electrochemical property was evaluated by potentiodynamic polarization.The results indicated that the titanium dioxide of composite anodic oxide films transformed from anatase to rutile with the change of pulse frequency,which could result from the electrochemical dynamic equilibrium.The combination of PTFE nanoparticles and malic acid electrolyte molecules can influence the energy fluctuation of electrochemical equilibrium and formation of composite anodic oxide films.Moreover,composite anodic oxide films fabricated under the condition of 1.0–2.0 Hz exhibited the best wear resistance and corrosion property.The schematic diagram of the film formation and PTFE nanoparticles spreading process under different frequencies was elucidated.
1.Introduction
Titanium (Ti) alloys have attracted considerable attention in aerospace,biomedical and transport industries,which is attributed to their high specific strength,low density and outstanding bio-compatibility.1–3However,the poor wear resistance of Ti alloys leads to severe adhesive wear and low resistance to abrasion.These shortcomings have greatly restricted the large-scale applications of Ti alloys.1Therefore,it is particularly important to improve the tribological and electrochemical property of Ti alloys by surface modification techniques,such as Physical Vapor Deposition(PVD),Plasma Electrolytic Oxidation (PEO),anodic oxidation and so on.4–7In particular,anodic oxidation is a prevalent technique owing to its low consumption and convenient operation.Additionally,composite anodic oxidation can offer better tribological and mechanical properties than that of ordinary anodizing for Ti alloys,8–10which leads to the increasing studies these years.
In the existing anodizing process technology on Ti alloys,it is inevitable to introduce toxic and harmful substances such as fluoride and hexavalent chromium.11,12The traditional process also brings negative impact on the human health and environment.Therefore,the development of non-toxic or low-toxic electrolyte has become the hot focus of the new anodizing process technology.Moreover,tartaric acid has been investigated as a neutral electrolyte in previous reports.13–15Malic acid,as an environmentally friendly organic carboxylic acid,was also reported by Danion et al.16that TiO2films can improve its photocatalytic degradation.Herein,malic acid can be employed as a novel electrolyte during anodizing process.
Furthermore,the incorporation of different nanoparticles in the electrolyte such as PolyTetraFluoroEthylene (PTFE),graphite particles,and Layered Double Hydroxides(LDHs)17–19can dramatically improve the tribological and electrochemical performance of composite anodic oxide films.20–23Many studies focused on protecting composite anodic oxide films against wear process and lowering their friction coefficient by lubricating the sliding surfaces.1,19Chen et al.21prepared self-lubricating Plasma Electrolytic Oxide(PEO) coatings produced on AZ91 alloy by introducing PTFE particles.So PTFE nanoparticles can be chosen for incorporation into electrolytes to form composite anodic oxide films due to their self-lubricating and non-sticky properties.8,21–24In particular,the hydrophilicity and adsorption performance of PTFE in the solution has been widely studied in membrane technology.25–27Therefore,it is also indispensable to investigate the adsorption behavior of PTFE nanoparticles in malic acid.
In recent years,pulse direct-current source is reported to have obvious advantages in preparing well-structured oxide films.28Typically,the various pulsing techniques include:(A)low frequency pulsing,(B) high frequency pulsing,and (C)pulse reverse pulsing technique.29,30So far,under the high frequency pulsing,Li et al.31concluded that the increase of high frequency can enhance the abrasion and corrosion resistance of oxide films on Ti-6Al-4V alloy.However,the influence of low frequency on the formation and properties of composite anodic oxide films is rarely studied.Furthermore,the influence of frequency on the formation of composite films obtained in this paper is different from the linear relation of previous studies under high frequency.18,31In particular,these previous studies adopted anodizing process without containing selflubricating PTFE nanoparticles.As a result,it is significant to figure out the influencing mechanism of pulse frequency on the formation and properties of composite anodic oxide films containing PTFE nanoparticles.
As for anodic oxide films on Ti alloys,the main composition is titanium dioxide including anatase and rutile.To date,the phase transition from anatase to rutile crystalline has been a hot spot in photocatalysis field,32–34while this transition on composite anodic oxide films of Ti alloys was seldom reported.31,35,36In some researches on the crystalline phase transition,Williamson et al.37found the intensities of anatase and rutile changed with the variation of duty cycle.As regard to composite anodic oxidation on Ti alloys,Ma et al.38indicated that the increase of electrolyte concentrations would promote the transformation of anatase and rutile.Bayati et al.39also discussed that the phase transition of TiO2appears on Micro-Arc Oxide(MAO)coating with the increase of the high pulse frequency.However,the investigation of crystalline phase transition under low pulse frequency was limited before.Moreover,Ti alloys have a very strong affinity to oxygen and form lubricious rutile titanium dioxide,which can effectively reduce interfacial friction and adhesion.1Additionally,rutile is known as the thermodynamically most stable TiO2crystalline phase under ambient conditions.40Hence,it is of great significance to focus on the crystalline phase transition under low frequency pulsing.
In this work,PTFE nanoparticles were added into the malic acid in order to fabricate composite oxide films under different frequencies for better properties.The aims of this experiment were to identify the morphology,microstructure,and performances of composite anodic oxide films.The tribological and electrochemical properties of composite anodic oxide films were systematically studied.The mechanism of the film formation and PTFE nanoparticles spreading process under different frequencies were put forward finally.
2.Experiment
2.1.Preparation of composite anodic oxide films
A titanium alloy Ti-10V-2Fe-3Al (10.0% V,2.0% Fe,3.0%Al,<0.05%C,<0.10%O and Ti balance)was cut into sheets with the dimension of 10 mm×10 mm×2 mm and 20 mm×20 mm×2 mm.Firstly,specimens were abraded with silicon carbide papers of successive grades from 150 to 3000 grits and then rinsed with acetone solution and deionized water,air dried finally.The following step to treat the dry specimens was metal degreasing in the bath liquid which contains 40 g/L sodium hydroxide,25 g/L sodium silicate,25 g/L sodium carbonate,and 40 g/L sodium phosphate.The time and temperature conditions were 25 min degreasing and (55±5) °C.After repeating rinsing and drying,the specimens were activated in the mixed solution composed of 10 g/L sodium hydroxide and 50 mL/L hydrogen peroxide at 40–60°C for 10–20 min.
A Pulse Galvanostatic Power Source (PGPS,WMY-IV,708th Research Institute of Astronautics,China)was operated to carry out anodizing.15 g/L malic acid was used as a green electrolyte for the reaction to prepare composite anodic oxide films.4 mL/L PTFE latex was also added to the electrolyte.A 1Cr18Ni9Ti stainless steel plate was used as the cathode,while specimens were used as the anode.The parameters of fabrication process are given in Table 1.The specimens were anodized at different frequencies,including 0.5,1.0,2.0,5.0,10.0,20.0 Hz.The schematic of the fabricating of composite anodic oxide films on Ti-10V-2Fe-3Al is shown in Fig.1.
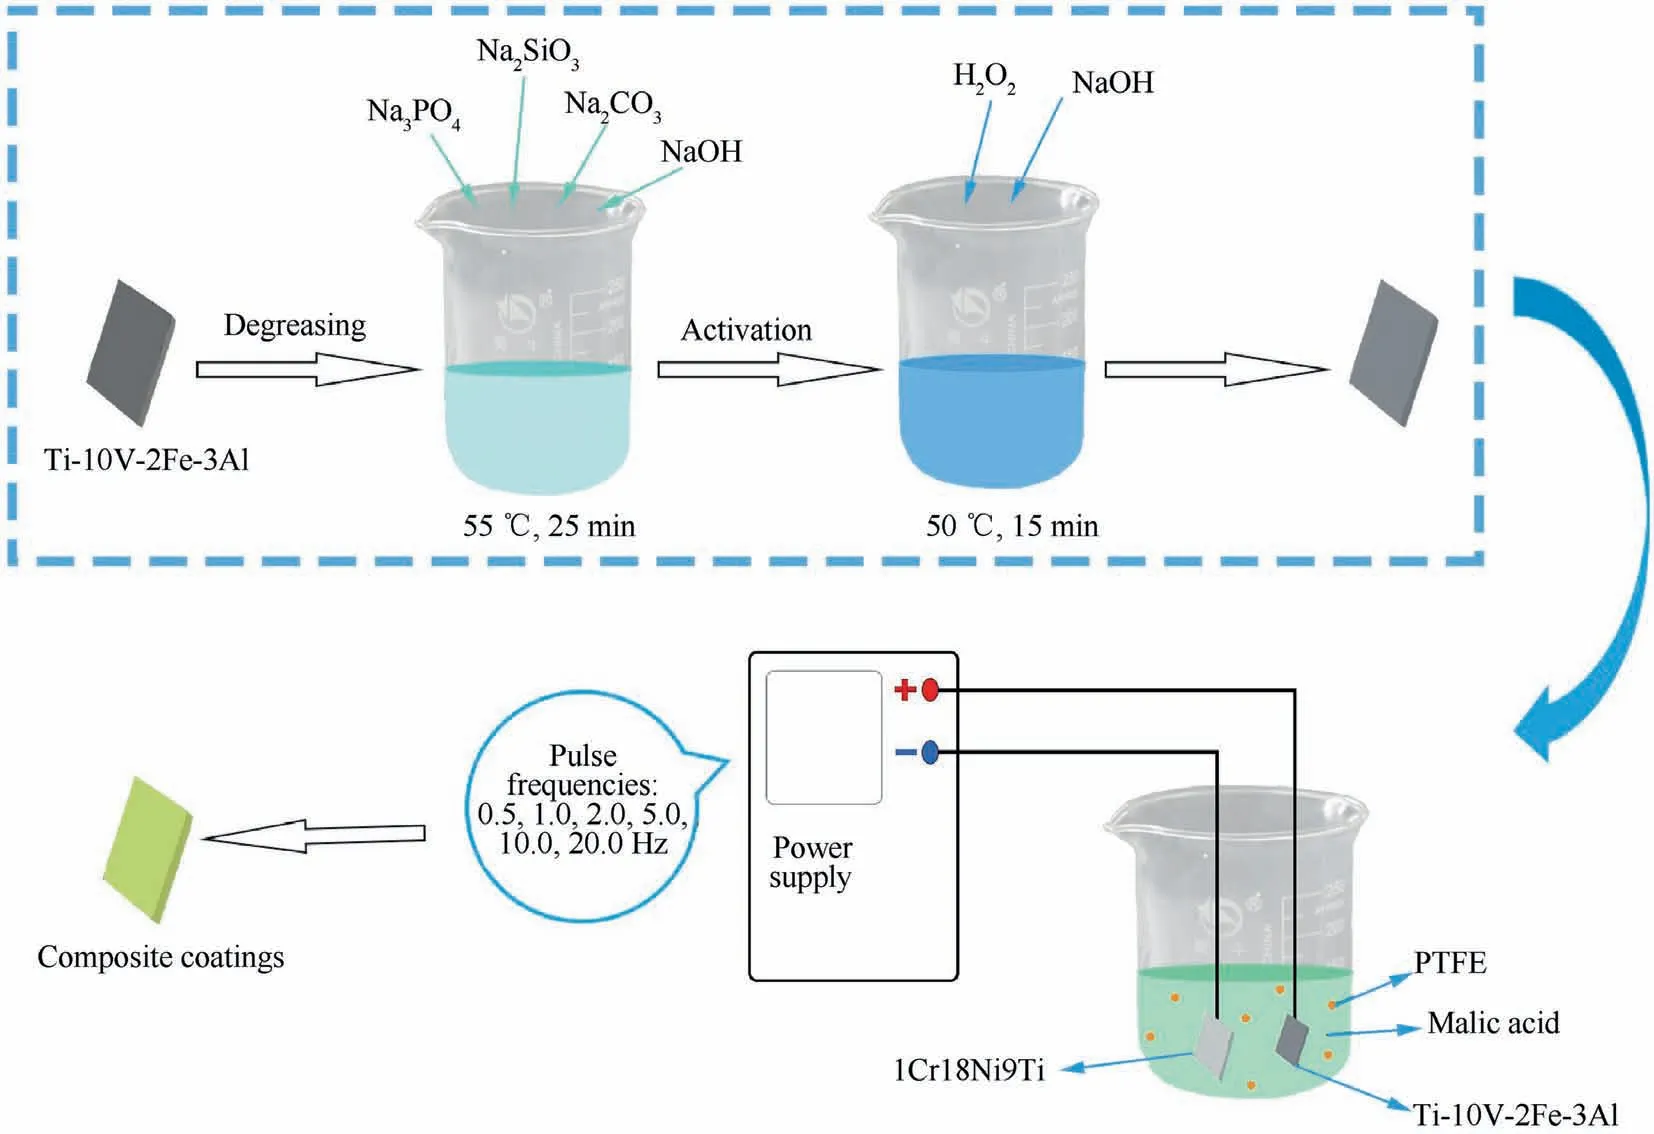
Fig.1 Schematic of fabricating of composite anodic oxide films on Ti-10V-2Fe-3Al.
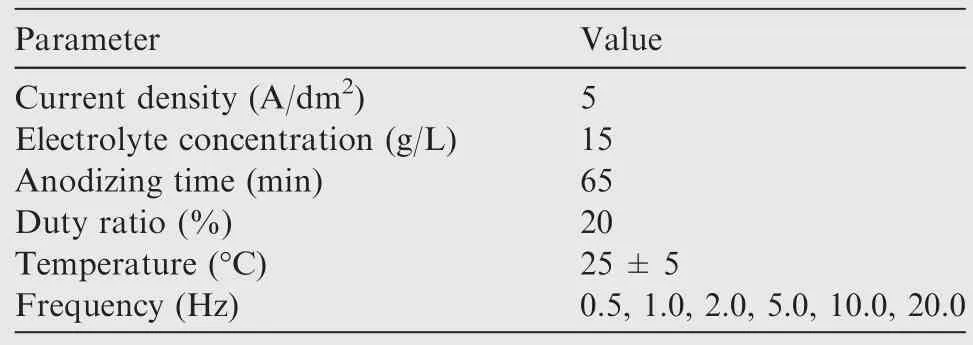
Table 1 Parameters of fabrication process.
2.2.Characterizations of composite anodic oxide films
The crystalline phase transition of composite anodic oxide films was investigated by X-Ray Diffraction (XRD,Rigaku D/Max 2500X,Japan) and Raman spectroscopy (YvonJobin Horiba-HR800,He-Ne laser without filter,650 nm).The morphology,roughness and composition of films,distribution of PTFE nanoparticles was analyzed by a Field Emission Scanning Electronic Microscope (FE-SEM,JSM 7800F,JEOL,Japan) equipped with Energy Dispersive Spectrometry (EDS,INCA Energy 350,Oxford,UK) and Atomic Force Microscope (AFM,Dimension icon,Veeco,USA).For crosssectional characterization,specimens were sealed in the resin and then polished.The uniformity and thickness of composite anodic oxide films were examined by FE-SEM (JSM 7800F,JEOL,Japan).
2.3.Tribological tests
The tribological tests were performed on a ball-on-disc rotating wear tester (HT-2001 POD-1,China) applying a load weighing 40 N,with a rotation radius of 4 mm,and rotating velocity of 200 r/min under 25°C for 30 min.These tests were performed by a Si3N4ceramic ball with a radius of 2.5 mm and on the surface of 0.01 μm roughness.The friction coefficient was recorded as a function of sliding time continuously.Finally,the morphology of worn surface was examined by SEM (Tescan VEGA 3 LMH SEM,Chech),the composition of worn surfaces was investigated by SEM(Tescan VEGA 3 LMH SEM,Chech) equipped with EDS.The depth profiles and morphology of wear tracks were observed by profilometer (Dektak 150,Veeco,America).The specific wear rate of different samples can be calculated from previous work.19
2.4.Electrochemical tests
Potentiodynamic polarization curves were measured using the electrochemical workstation (Princeton Parstat 4000A,USA),in a three-electrode cell system,with a Saturated Calomel Electrode(SCE),a platinum plate as the counter electrode and the specimens as the working electrode.Polarization curves were obtained ranging from -0.8 V to 0.8 V with reference to the Open Circuit Potential(OCP)at a sweep rate of 2 mV/s.Impedance measurements were swept by a 10 mV (Root-Mean-Square,RMS) sinusoidal perturbation and performed at OCP from 10 mHz to 100 kHz.
3.Results and analyses
3.1.Anodizing voltage–time plots at different frequencies
Fig.2 shows the changes of anodizing voltages as a function of anodizing time at different frequencies.The results of anodizing voltages at different frequencies present in Table 2.Generally,the anodizing process can be classified into three steps.13In Step 1,the voltage initially went up linearly and reached a peak,then decreased gradually with the progress of anodic oxidation in Step 2,and finally reached a relatively stable value until the end of the test in Step 3.The ultimate value reaches about 60 V at lower frequencies (0.5–10.0 Hz),while the ultimate value was the greatest at 2.0 Hz,and the lowest at 20.0 Hz.In particular,the ultimate voltage value is a significant parameter to characteristic surface roughness,crystal structure and properties of oxide films.13,31In Table 2,the incremental rates increase while the decline rates of 0.5,1.0 Hz are 0,which indicates the rate of oxide film formation dominates.When the frequency reaches 2.0 Hz,the slight decrease of incremental rate and increase of decline rate reveals the electrochemical dynamic equilibrium.13The dissolution rate of electrolyte significantly begins to dominate as the frequency increases (5.0–10.0 Hz).The decrease of incremental and decline rates at 20.0 Hz shows the restriction of film formation.
3.2.Raman spectroscopic characterization
Fig.3 shows the Raman spectra of composite anodic oxide films prepared at different frequencies after fitting.Among them,158 cm-1is the peak of anatase type titanium dioxide,14,41the rutile has two intense Raman active fundamentals(424,608 cm-1),5,15while 930 cm-1is the peak of vanadium pentoxide.15Similar shifts of anatase peak were also found in other studies,9,42,43which is attributed to the confinement effect of particles crystallites size and occurrence of new surface structure.44,45As shown in Fig.3,the position of Raman spectrum crystal peak does not change significantly at different frequencies.In particular,the intensity of peaks increased with the variation of frequencies during 0.5–5.0 Hz.
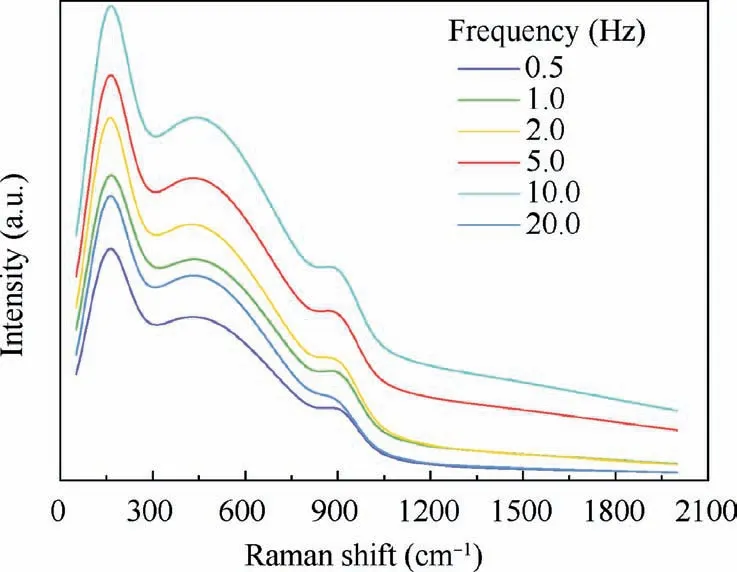
Fig.3 Raman spectra of composite anodic oxide films fabricated at different frequencies.
3.3.Cross-section characterization
Fig.4 depicts the uniformity and thickness of composite anodic oxide films fabricated at different frequencies.In order to measure the thickness of the film more accurately,three points for each film were selected to calculate the average value.Table 3 shows the thickness data of the film at different frequencies.The average thickness of different films is 10.14,14.65,15.02,14.19,9.59,5.05 μm.The results indicate that the films formed at 1.0,2.0 Hz are thicker than that of others.Fig.4 also clearly demonstrates the growth and evolution of composite anodic oxide films under the change of frequencies.Fig.4(a) and 4(b) present that composite anodic oxide films are thick under the lower frequencies (0.5 and 1.0 Hz).Fig.4(c) obviously described the thickest film of all,which also reveals the best growth period of composite anodic oxide films formed at 2.0 Hz.In Fig.4(d)–4(f),the thickness of composite anodic oxide films continues to decrease,which can reflect the dissolution and evolution of composite anodic oxide films continue under higher frequency (5.0,10.0,20.0 Hz).

Table 2 Results of anodizing forming voltages obtained at different frequencies.

Table 4 EDS profile recorded for corresponding points on composite anodic oxide films.
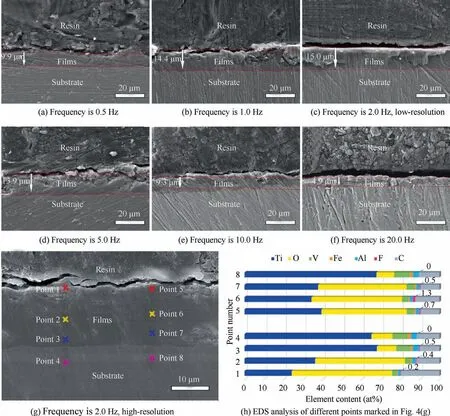
Fig.4 Cross-sectional FE-SEM micrographs of composite anodic oxide films fabricated at different frequencies and EDS analysis of oxide film fabricated at 2.0 Hz.
Fig.4(g) depicts the high-resolution micrograph of composite anodic oxide film fabricated at 2.0 Hz.EDS results of 8 points collected in different zones of composite films have shown in Fig.4(h).The percentage of elemental fluorine in point 2 and 6 of the middle layer can reach 0.4% and 1.3%,respectively.The results support the successful intercalation of PTFE nanoparticles in composite anodic oxide films.
3.4.Structure,composition,and morphology
The SEM images in Fig.5 present the evolution of the morphology and structure of composite anodic oxide films under the increase of frequency.For composite anodic oxide films formed at 0.5 Hz,Fig.5(a1) and 5(a2) display a large number of scattered floating islands-like structure,which indicates that the film is in the preliminary formation process.When the frequency exceeds 1.0 Hz,Fig.5(b1) and 5(b2) present that the amount of thin shell-like morphology in zone ③has increased.Since the film at 1.0 Hz is obviously thicker than that at 0.5 Hz in Fig.4,and the floating island-like structure in zone ①gradually evolves into shell-like morphology in zone ③,it could be inferred that the growth and uplift of the crystalline phase make the gully region in zone ②transform into shallow potholes in zone ④.However,when comparing Fig.5(b1) with Fig.5(c1),it indicates that pits become more obvious,and composite anodic oxide films formed at 2.0 Hz leave relatively shallow fluctuation.In addition,Fig.5(c2)also shows that the porosity of composite anodic oxide films fabricated at 2.0 Hz is reduced,while some pits have grown longitudinally and have a certain depth.Moreover,the thickness of films formed at 2.0 Hz reaches the peak in Fig.4.It indicates that the growth of composite anodic oxide films formed at 2.0 Hz has reached a relatively mature period.When comparing Fig.5(c1) with Fig.5(d1),it shows that the fluctuation decreased,and the cracks continued to expand.In addition,Fig.5(d2)reveals that the pores got deeper and the surface was looser than before.It shows that composite anodic oxide films formed at 5.0 Hz have dissolved.When comparing Fig.5(d1) and 5(e1),it indicates that the number of pores increases significantly,which also proves that composite anodic oxide films formed at 10.0 Hz continue to dissolve.Fig.5(e2) and 5(f2) show that composite anodic oxide films formed at 20.0 Hz get loose and the depth of fluctuation decreases,corresponding to the dramatic decrease of the film thickness at 20.0 Hz,which owes to the growth inhibition of the film under higher frequencies.In particular,the areas where PTFE exists have been marked in red.The size of PTFE particles can correspond to the range of 180–240 nm.21
The EDS results corresponding to the surface and cracks of composite anodic oxide films in Fig.5 and Table 4 describe that the elemental composition contents of composite anodic oxide films,and large amount of fluorine element in the film can indicate the distribution of PTFE nanoparticles.The ratio of titanium to oxygen less than 1∶2 in Table 4 could indicating that titanium dioxide is the main composition of composite anodic oxide films.In addition,the amount of fluorine element in the cracks and pores is high,which means that PTFE nanoparticles tend to gather in pores and cracks.
3.5.AFM characterization
Fig.6 describes AFM images of composite anodic oxide films fabricated at different frequencies.Fig.7 reveals the variation of root mean square roughness (Rrms) and average roughness(Ra) derived from the AFM analysis.The changing trends ofRrmsandRaare relatively similar to the topography fluctuation of films,indicating that the roughness is connected to the morphology and porosity of surface.Moreover,the surface roughness obtained from AFM can greatly influence the frictional characteristics in subsequent friction tests.9,13,14,20As shown in Fig.6(a),the bulged and floating-island morphology appear on composite anodic oxide films formed at 0.5 Hz.Fig.6(b) and 6(c) present the density and flatness of films formed at 1.0,2.0 Hz increased.Fig.6(c) and 6(d) show that films have grown longitudinally and have a certain depth.Fig.6(e)and 6(f)describe composite anodic oxide films formed at 10.0 Hz and 20.0 Hz get flatter and thinner.Therefore,the description of micro-morphology of films in Fig.5 corresponds to the three-dimensional structural evolution of films in Fig.6.
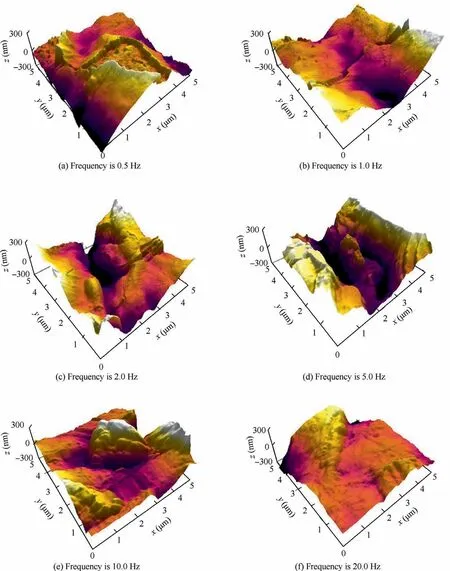
Fig.6 Three-dimensional AFM images of composite anodic oxide films formed at different working frequencies.
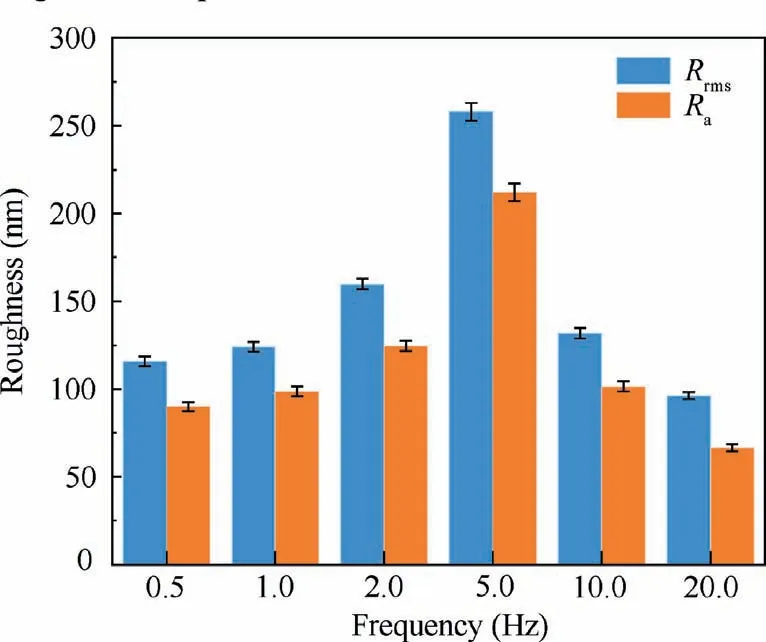
Fig.7 Surface roughness of composite anodic oxide films of titanium alloy anodized in malic acid at different frequencies.
3.6.Properties of composite anodic oxide films
Figs.8 and 9 describes the top and cross-section SEM graphs of tracks after friction and wear tests at different frequencies,respectively.Table 5 shows the width and depth profiles of the wear scar and thickness of composite anodic oxide films fabricated at different frequencies.In addition,the depth and width of fluctuation along the sliding direction can illustrate the changes of the wear resistance.19,20Therefore,it can be obtained from Fig.8(b1),8(c1) and Table 5 that the wear tracks of composite anodic oxide films formed at 1.0 Hz and 2.0 Hz are obviously narrower (0.251 mm and 0.383 mm),and the surfaces of wear tracks are smoother in Fig.8(b2)and 8(c2),which can indicate that the wear resistance of composite anodic oxide films fabricated at 1.0 Hz and 2.0 Hz are optimal.In addition,Fig.8(f1),8(f2) and Table 5 shows that the width and depth of the wear tracks at 20.0 Hz reach the peak (0.958 mm and 25.03 μm),and many friction stripes and residual debris are also observed,which indicates that the worn thin film was partially detached from the substrate in the sliding process finally,resulting in the largest fluctuation of all curves in Fig.9 and the rise of the friction coefficient to about 0.4 in Fig.10.In addition,comparing the profiles in Table 5,the worn surfaces of films formed at 1.0,2.0,5.0 Hz reveal the excellent performance.The same results are also reflected in the fluorine element in Fig.8.Hence,more PTFE nanoparticles remain on the wear tracks,which accounts for the optimal results in Fig.9 and Table 5.Such many quantities of PTFE could mainly owe to the entrapment in the cracks and sidewalls of the thicker films.In particular,PTFE nanoparticles will soften and deform due to high temperatures and pressures applied during severe friction and wear process.24Moreover,high temperature leads to the increase in the viscoelastic deformation of PTFE nanoparticles,and the decrease in the load-carrying capacity,22which results in the higher friction coefficient and wear rate.In addition,the deformed and softened PTFE nanoparticles can combine with the debris to form a new lubricating layer,46which can significantly improve the wear resistance of composite anodic oxide films.
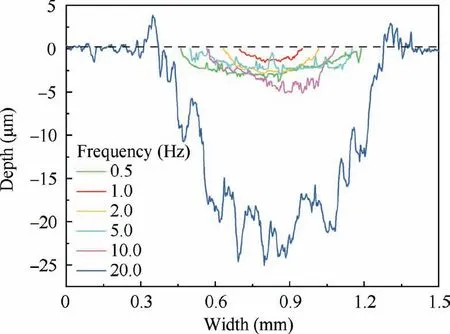
Fig.9 Abrasion surface profiles of composite anodic oxide films formed at different frequencies recorded by surface profiler.
Furthermore,Fig.10 described the change of friction coefficient versus sliding time measured on composite anodic oxide films fabricated at different frequencies.The friction coefficient of films formed at 0.5 Hz is small at first,then continuously increases to about 0.65,which is close to the coefficient of anodic oxide film.38In addition,Fig.8(a3) shows almost no fluorine content in the zone ①,which could indicate that most PTFE nanoparticles in the film are finally polished.In Fig.10,the friction coefficient of composite anodic oxide films formed at 1.0 Hz has been small overall,which is related to the more PTFE nanoparticles loading in the films shown in Fig.8(b3).Moreover,the presence of shallow potholes and flatter surface in Fig.6(b)also leads to the reduction of nanoparticles and increase of friction coefficient.In Fig.10,the amplitude of the 2.0 Hz curve is similar to that of the 1.0 Hz curve.The friction coefficient of films formed at 2.0 Hz is stable and presents the lowest.In particular,the fluorine content is the highest in Fig.8(c3),indicating that PTFE nanoparticles are loaded the most in the films formed at 2.0 Hz.Since the increasing longitudinal depth of depicts in the densest and thickest films,more PTFE nanoparticles could be loaded firmly.In Fig.10,the friction coefficient of films formed at 5.0 Hz firstly increases rapidly,then the curve slows down and finally reaches to about 0.60.In addition,Fig.8(d3) also shows less fluorine content in the zone ④,accounting for the reason that few PTFE nanoparticles exist in the surface and some other are loaded in the pores and cracks.In Fig.10,the trend of the 10.0 Hz curve reveals that the curve firstly increases slowly,then the slope increases and reaches about 0.60 finally.However,the EDS results in Fig.5(e2) and Table 3 indicate that more PTFE nanoparticles are loaded in the surface of films formed at 10.0 Hz than that at 5.0 Hz,and some fewer nanoparticles are still loaded in the defects of films.Therefore,more PTFE nanoparticles in the surface lead to the slow increase of the 10.0 Hz curve,and the few nanoparticles entrapped in the film results in the increase of slope.When the frequency exceeds 20.0 Hz in Fig.10,the curve fluctuates continuously and reaches about 0.40 finally.Also,the absence of the fluorine element in Fig.8(f3) indicates the friction coefficient of the thinnest film fluctuates for the fewest nanoparticles.Fig.11 presents the wear rate of specimens under different frequencies,indicating the wear rate of specimens reaches the lower points at 1.0 Hz.
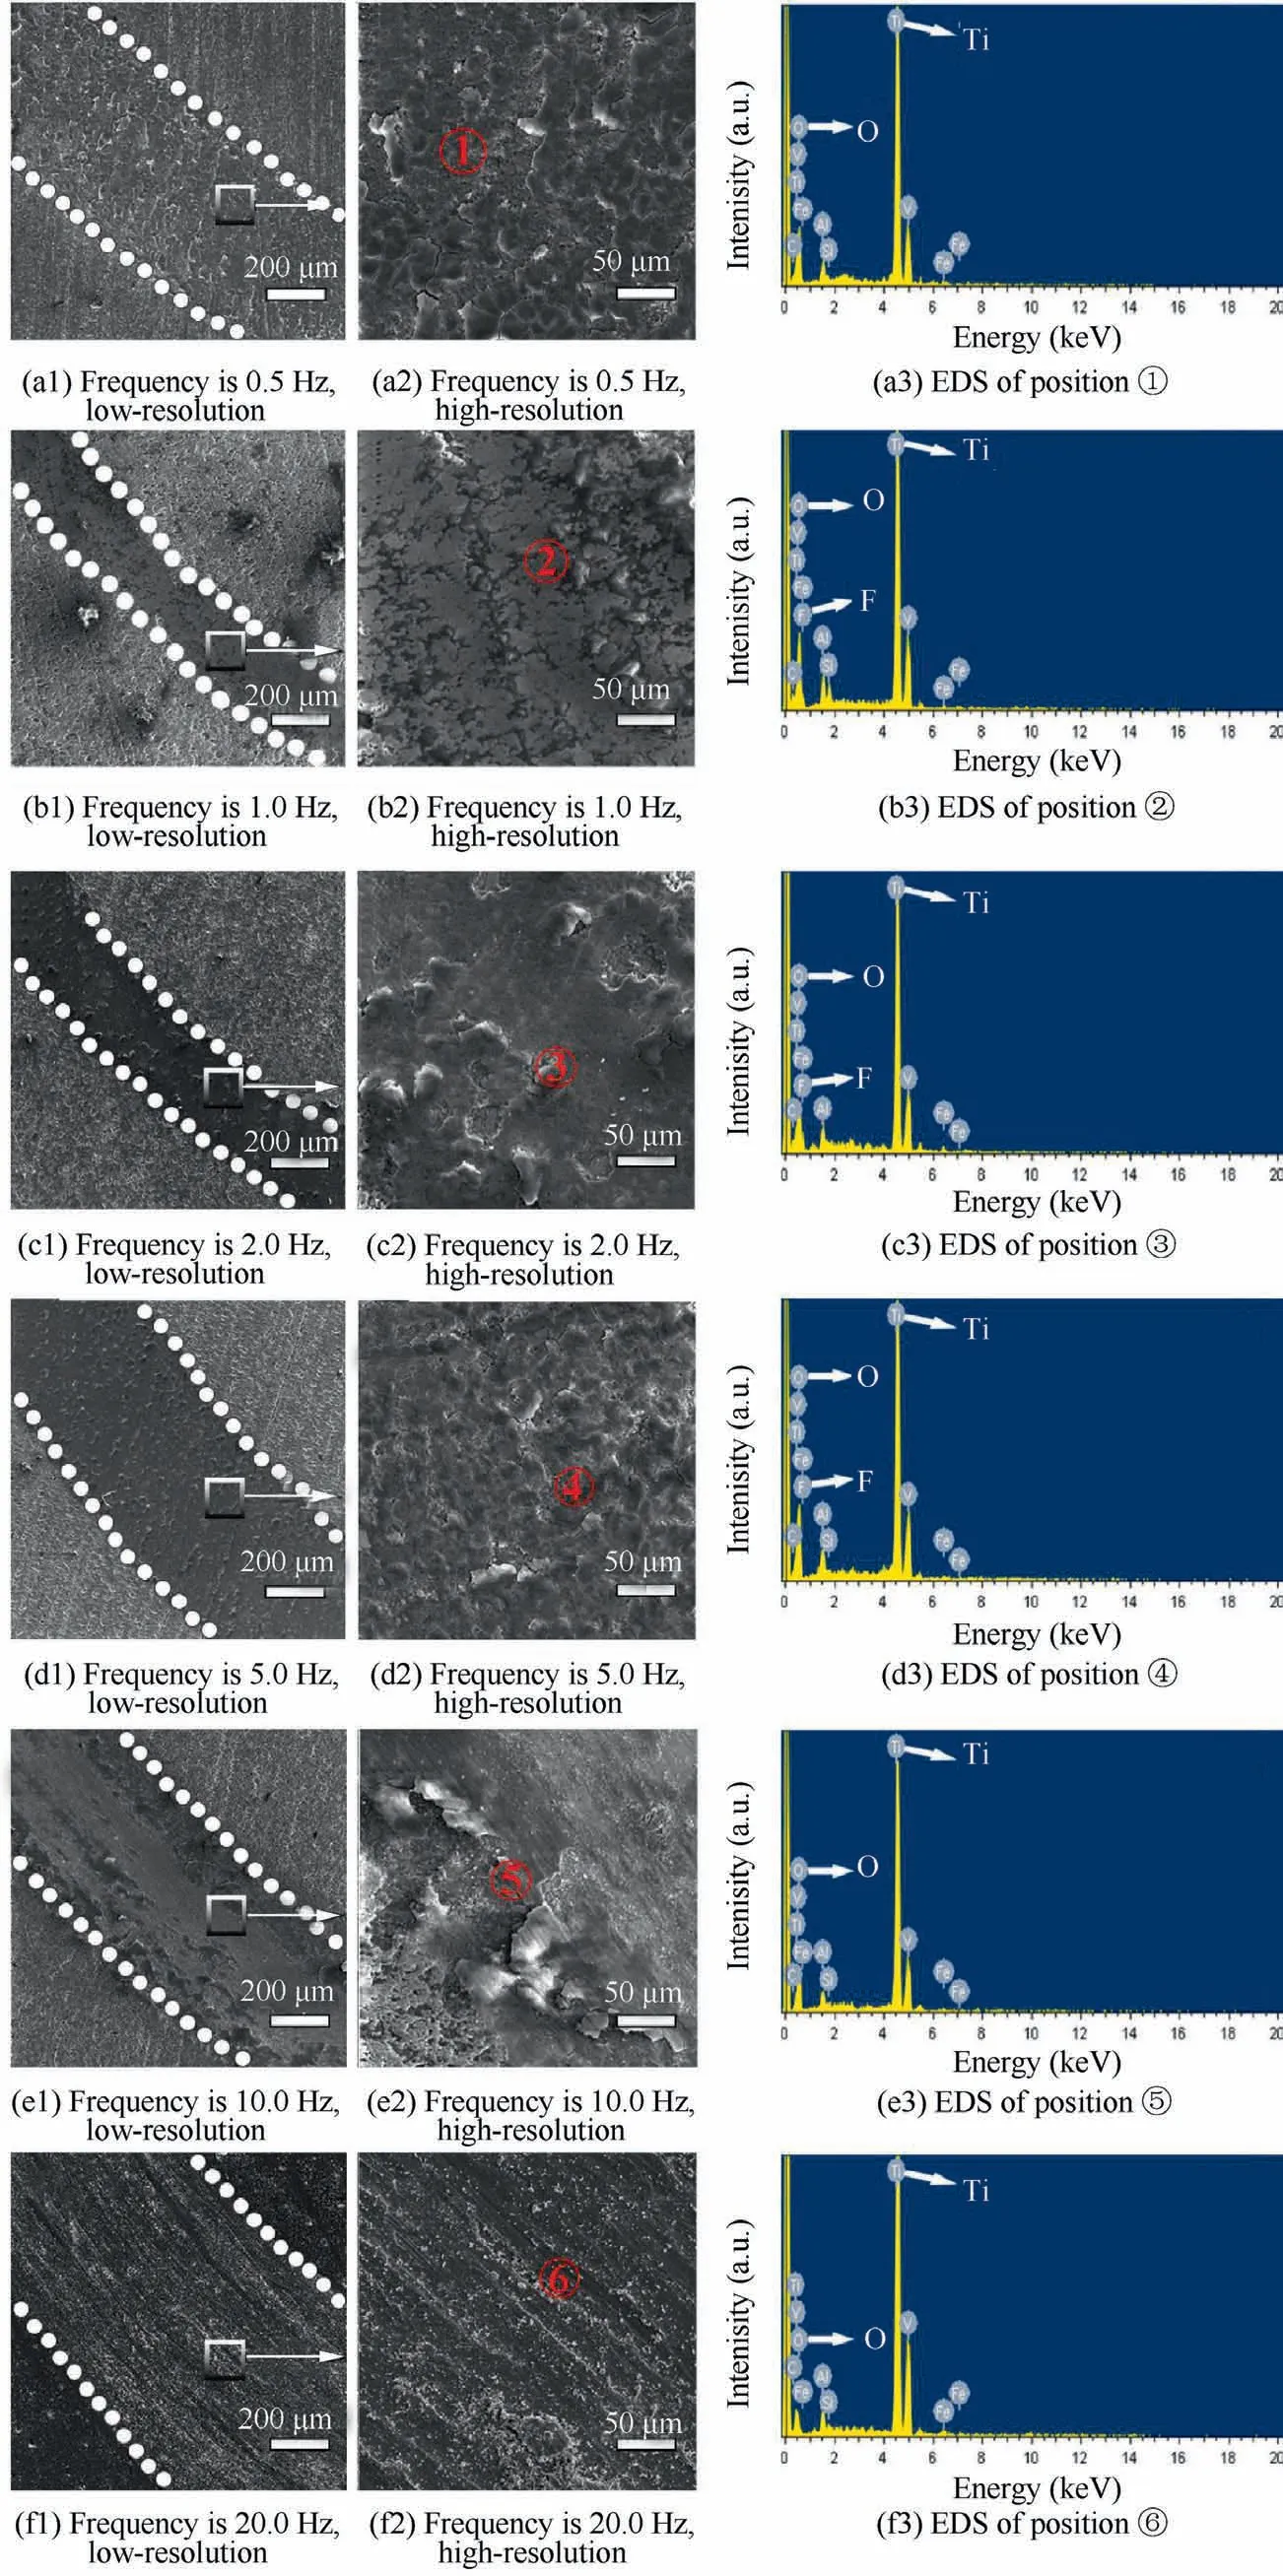
Fig.8 SEM images and EDS of worn surfaces of composite anodic oxide films formed under different working frequencies.

Table 5 Width and depth profiles of wear scar and thickness of composite anodic oxide films fabricated at different frequencies.
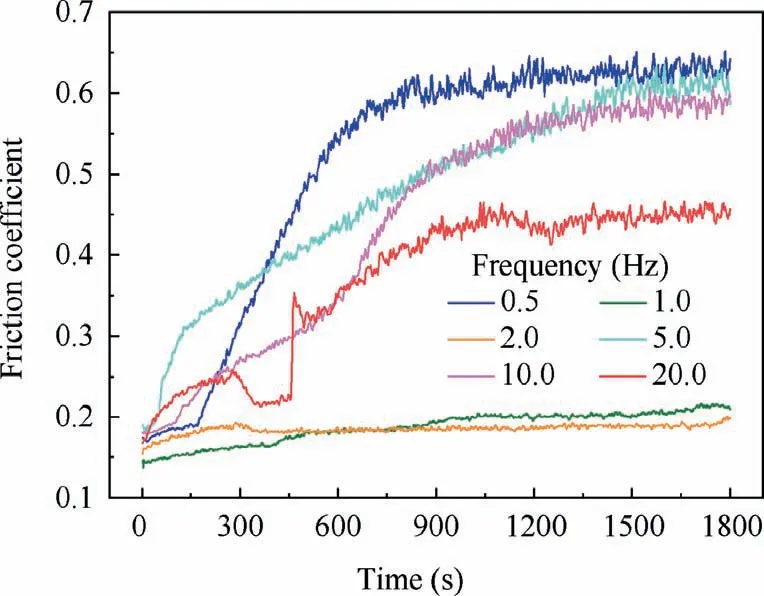
Fig.10 Friction coefficient of composite anodic oxide films formed at different frequencies.
Fig.12 shows polarization curves of different specimens fabricated at different frequencies.Fig.12(a) obviously indicates the specimens at 1.0,2.0 Hz exhibit the lowest current density (1.240×10⁻⁸A,1.809×10-8A),which corresponds to the thickest film in Fig.4.Moreover,the significant increase of corrosion property can also attribute to the self-lubricating property of many loaded PTFE nanoparticles.21,23Fig.12(b)and 12(c) present the specimens at 1.0,2.0 Hz still maintain the best corrosion resistance after 7 days and 14 days immersion.
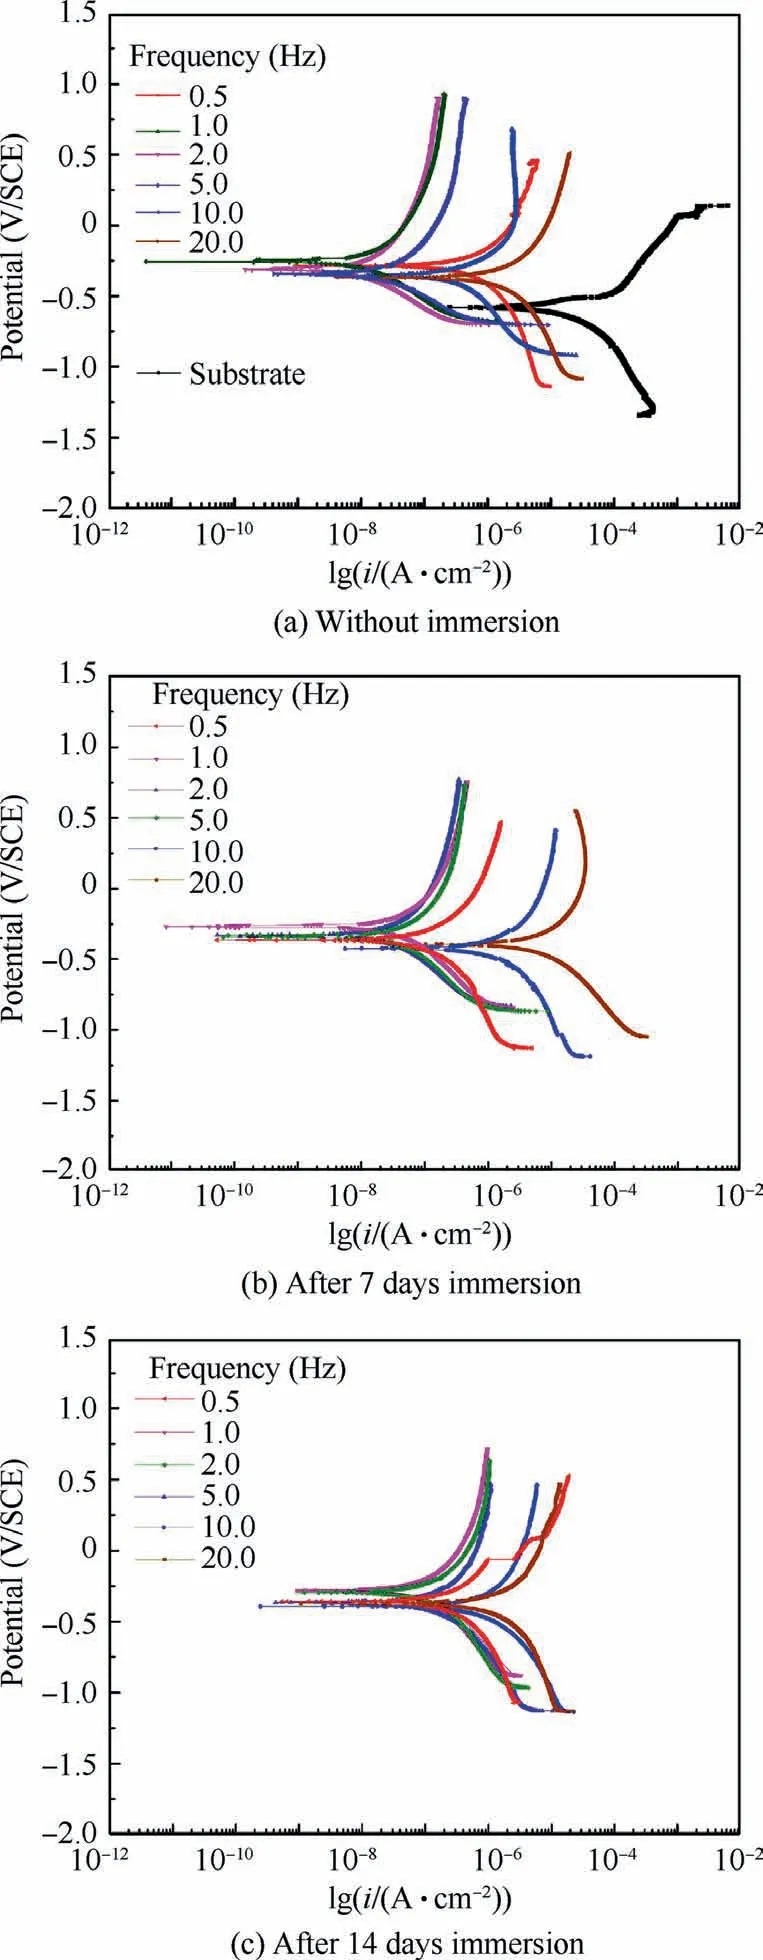
Fig.12 Polarization potentiodynamic curves recorded for different specimens in 3.5wt% NaCl solution.
Impedance spectra was employed to further characterize the corrosion behavior of different specimens in Fig.13.Normally,the Bode impedance modulus at the low-frequencycan be used as a semi-quantitative indicator to characterize the anti-corrosion performance of coatings.Fig.13(a) reveals the impedance of specimens at 1.0,2.0 Hz exhibit the highest corrosion resistance.After 7 days and 14 days immersion,the specimens at 1.0,2.0 Hz still show the better corrosion behavior in Fig.13(c) and 13(e),which could result from the thicker films.Bode plots in a broad frequency were found 2 time constants in Fig.13(b),13(d),and 13(f).Equivalent circuit corresponding to two relaxation processes can be used for characterizing specific structural features and corrosion property of composite coatings.Table 6 lists all fitted parameters for Electrochemical Impedance Spectroscopy(EIS) spectra,whereRsis the resistance of electrolyte,Rcis the resistance of composite coatings,Rctis the chargetransfer resistance;Constant Phase Elements (CPE) is the capacitance of different layers in parallel with corresponding resistance;nis the angular frequency,whennis close to 1,CPE can be regarded as ideal capacitor;the low chi-squared(χ2) error value reveals fine circuit fit.19In addition,Qcis the capacitive response of the coating,Qdlis the capacitance of corrosion interface.In particular,specimens at 1.0,2.0 Hz have the highestRccompared to other coatings.
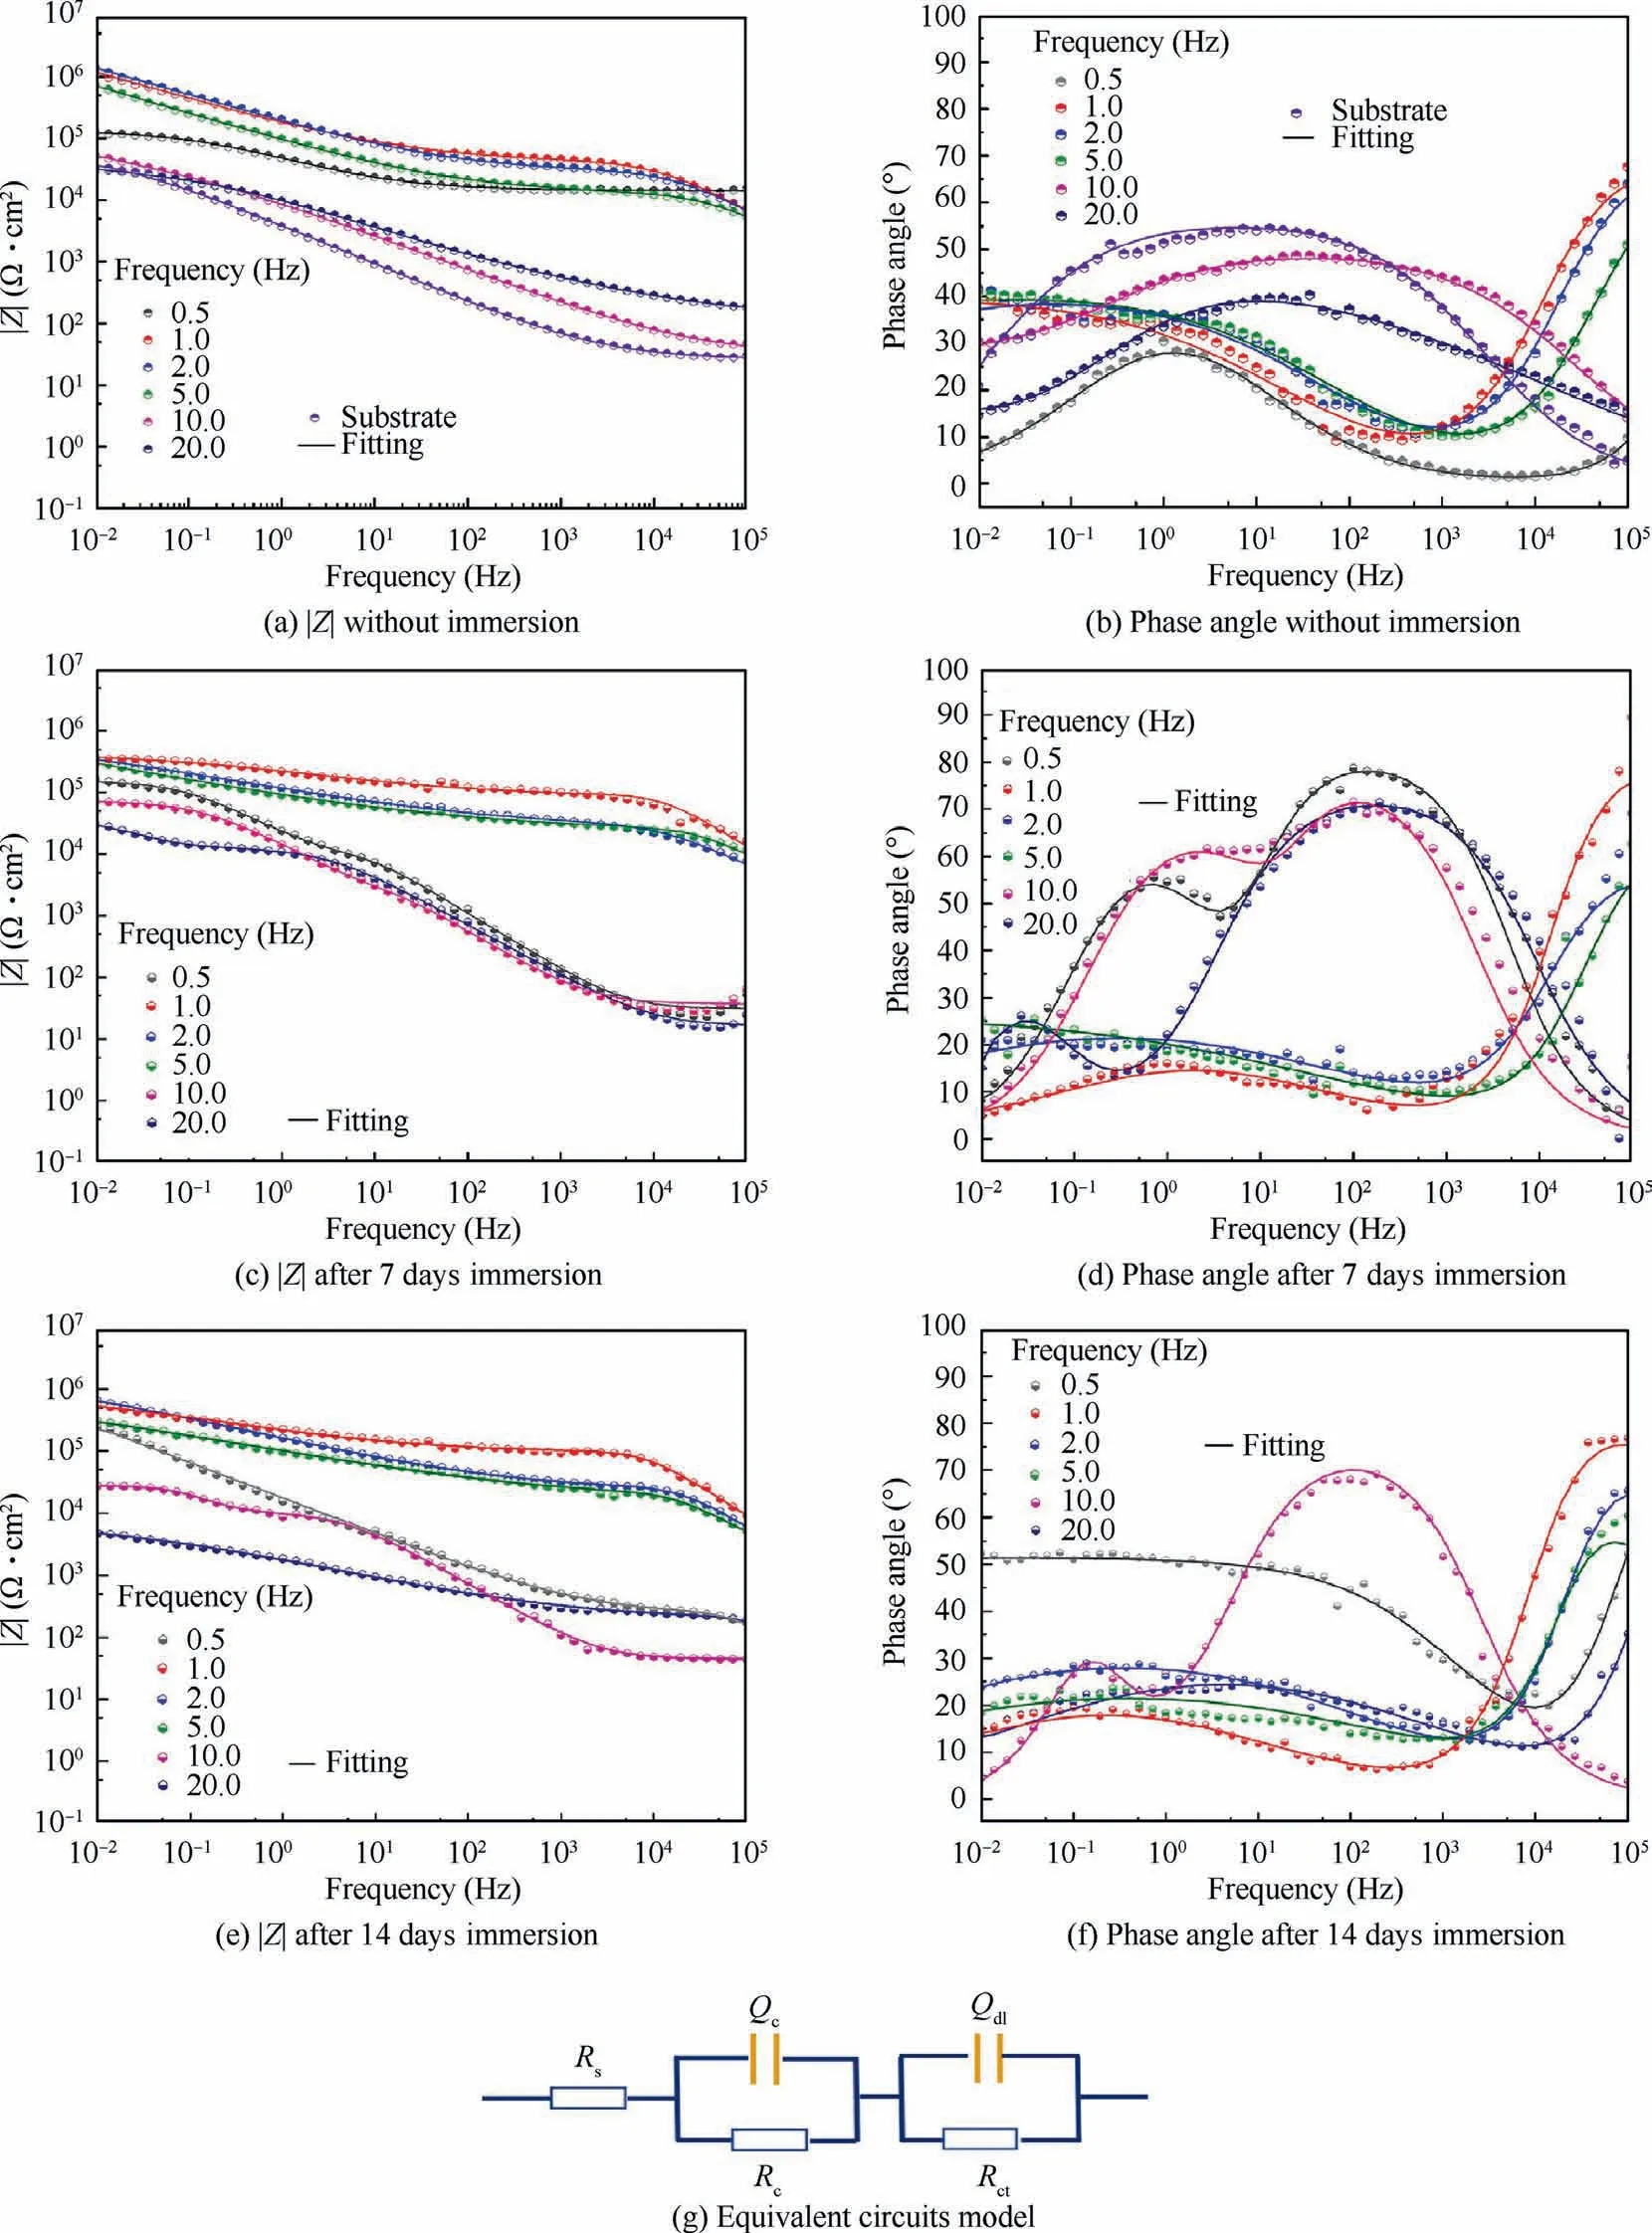
Fig.13 EIS spectra obtained for different specimens immersed in 3.5wt% NaCl solution.
4.Discussion
Usually,the influence of frequency on the film formation was mostly linear in many previous studies,31,39but some regular fluctuations are obtained in this work.Firstly,the special fluctuations can be analyzed from the crystal forms of composite anodic oxide films under increasing frequencies.
In Fig.3,the composition of films fabricated at different frequencies is of the same type of titanium dioxide.However,the intensity of the same crystal peak at different frequencies is different,which indicates the crystal structure may transform or dissolve.Moreover,it is normally known that anatase is the metastable phase and easily converts to rutile at lower temperature.47,48The amount of compounds absorbing energy per unit time changes with the increase of frequency.35Therefore,the anatase will theoretically transform into the rutile with the changes of frequency.
XRD results present broader TiO2intensity peaks,which revealed the addition of PTFE can influence the composition of anodic oxide film and crystalline forms of TiO2.Compared with XRD characterization,Raman spectroscopy can be better observed the changes of TiO2crystal forms and further investigated the phase transition process of anatase to rutile.49–52The intensity of the Raman peaks corresponds to the relative content of anodic oxides formed on the titanium alloy.9Li et al.49studied anatase-rutile transition with Raman spectrum,and found that the characteristic peak intensity of rutile continued to increase while anatase decreased bit by bit,which indicated that anatase had been converted into rutile.The intensity of different peaks also corresponds to the ultimate voltage values.26Herein,Fig.14 presents the changes of forming voltages under different frequencies,and also indicates the relationship between the intensity of crystal peaks (at 158,424 cm-1) and different frequencies.It can be found from Fig.14 that the intensity of anatase and rutile reaches the peak at about 10.0 Hz.The consistent overall change rates of curves indicate the similar composition of crystal forms under different frequencies.
In particular,Fig.14 also indicates that when voltage drops(2.0–5.0 Hz,10.0–20.0 Hz),the growth speeds of anatase and rutile are different,which can be analyzed by the slope of curves (anatase and rutile) in Fig.14.The change reflected in that the increasing slope of anatase gets slower during 2.0–5.0 Hz (200.7 a.u./Hz),but rutile is completely opposite(233.9 a.u./Hz),which can be demonstrated that some anatase could transform into rutile in this stage.The similar phenomenon during 10.0–20.0 Hz also presents that the decreasing slope of rutile (230.0 a.u./Hz) is gentler than that of anatase (293.1 a.u./Hz).
Further,Fig.15 presents the peak area of strongest Raman peak at 158 cm-1,608 cm-1and the thickness of composite anodic oxide films fabricated at different frequencies.The thickness of films can be received by cross-sectional SEM in Fig.4.The crystallinity degree of composite anodic oxide films on Ti alloys can be roughly calculated using14
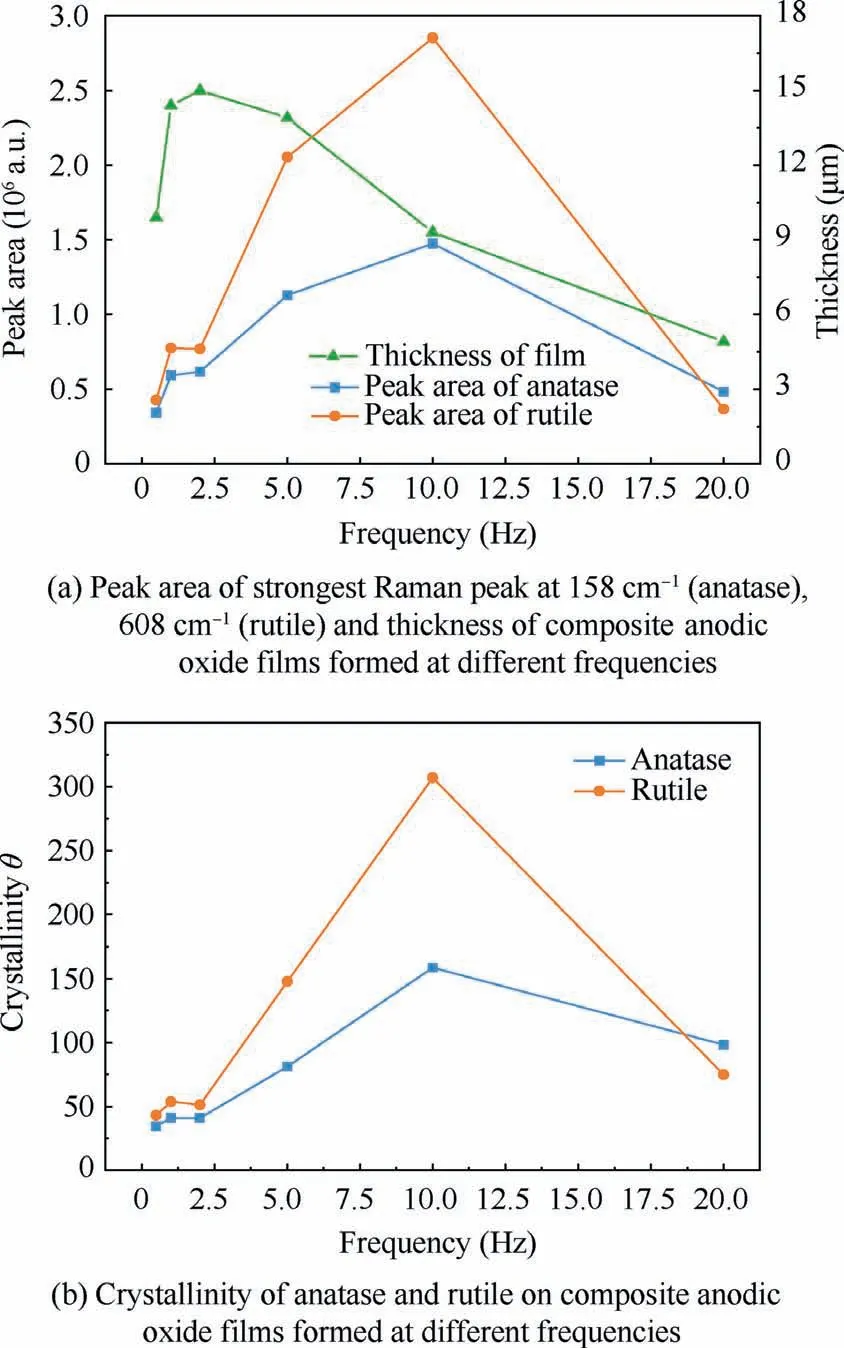
Fig.15 Peak aera,thickness of film,and crystallinity at different frequencies.

where μ is the peak area of Raman spectra,Ais a constant that is set as 1 nm/a.u.14The value of θ calculated under different frequencies is shown in Fig.14(b).From Fig.14(a) and 14(b),it is perceptible that the crystallinity of rutile changes more dramatically than that of anatase,which also reveals the emergence of phase transition.The crystallinity of rutile and anatase reaches the peak at 10.0 Hz,which is similar to the change rate in Fig.14.
It is accepted that such phase transition would require enough heat and energy,42while the voltage is relatively lower during 2.0–5.0 Hz in Fig.14.Therefore,the source of energy must come from somewhere else.Furthermore,it is widely assumed that the growth process of films can be characterized by the electrochemical dynamics between the formation rate and dissolution rate of films generally determined by the nature of electrolyte,13the source of energy can come from the process of dynamic equilibrium in electrochemical reactions.Therefore,the dominated dissolution rate must cause the decrease of forming voltage.The energy source of similar crystalline phase transition at high frequency(10.0–20.0 Hz)can be explained that partial reaction heat in partial areas boosts with frequency dramatically increase,the squeezing and expansion of crystal also generated much energy.35
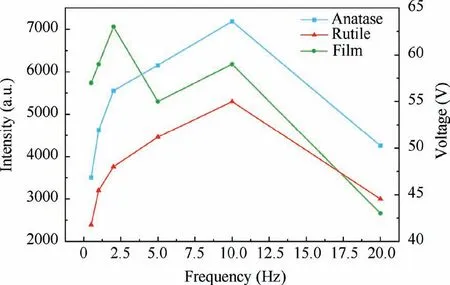
Fig.14 Relationship between intensity of both crystals forms,forming voltages of composite anodic oxide films and different frequencies.
When exploring the mechanism further about the fluctuation phenomenon at different frequencies appearing on the film formation instead of linear relationship,introducing PTFE could be the key point.In particular,the mechanism in the changes of forming voltages in different steps writtenabove in Fig.2 has been explained by the high field-assisted ionic transport mechanism53,54in Step 1,and the ion concentration between the electrolyte and layer in Step 2.15Hence,the ion concentration and degree of reactions are needed to be discussed.When focusing on the two inflection points of 2.0 Hz and 10.0 Hz,both composite films appeared crack structures with a certain depth,which could restrict the electrolyte contacting the surface of cracks inside,causing more PTFE nanoparticles firmly loaded into the inner surface.In Table 4,the same phenomenon of films formed at 2.0 Hz or 10.0 Hz compared with other frequencies on their both sides is that the fluorine content is higher on the surface,which means more PTFE nanoparticles appeared on the outer layer of films.

Table 6 Fitted parameters of different specimens for EIS spectrum.
However,before analyzing how the PTFE nanoparticles influence the electrochemical dynamics of film formation,it is also necessary to study the chemical formula for malic acid in Fig.16.
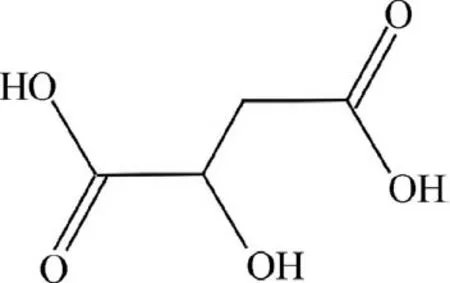
Fig.16 Chemical formula for malic acid.
Malic acid has carboxyl groups and high hydroscopicity.Moreover,PTFE has absorptivity and its main physisorption force was hydrogen bonding.27,33Therefore,the hydroxyl groups on the surface of PTFE can easily combine with the carboxyl group of malic acid to form a hydrogen bond.This adsorption process driven by the hydrogen bond is rapid and intense.In addition,PTFE particles have a large specific surface area and can absorb charged solution molecules in electrolyte to make their surfaces negatively charged.22Such adsorption and addition of more PTFE nanoparticles on the surface can cause more solution molecules gathering on the surface of the membrane layer,which could improve the dissolution rate of composite anodic oxide film to some extent.Therefore,composite anodic oxide films formed at 2.0 Hz and 5.0 Hz will tend to dissolute because of the much amount of PTFE loaded in the defects of films in Fig.17.
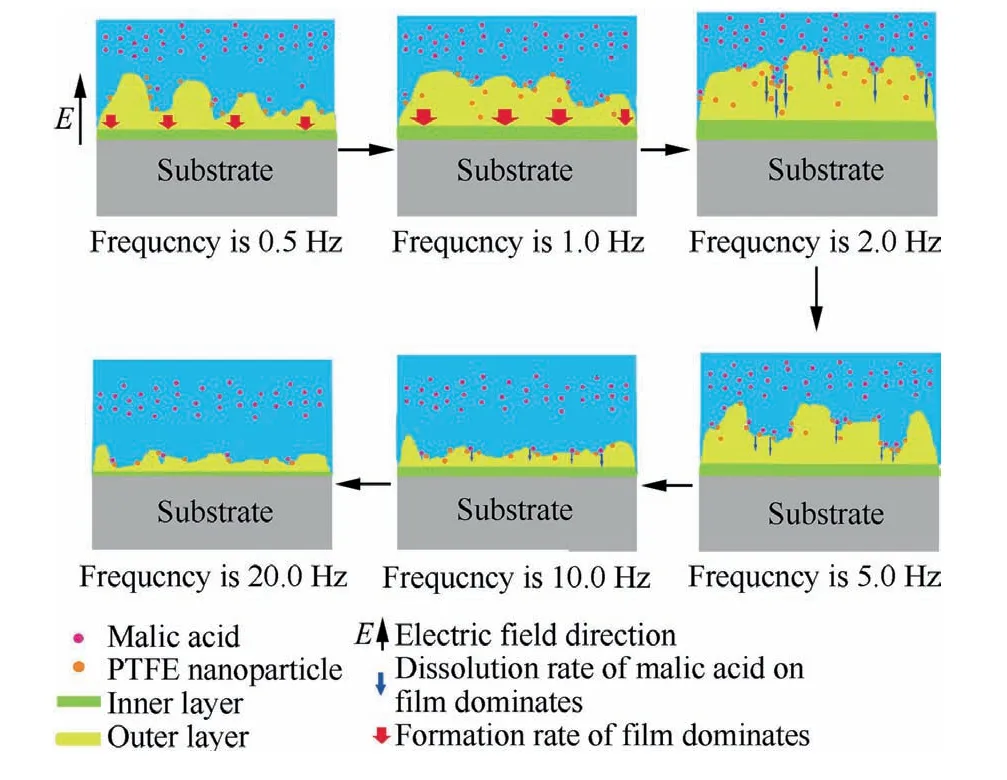
Fig.17 Schematic diagram of film formation and deposition mechanism of PTFE nanoparticles with frequency increase.
In particular,it can also be explained from the growth mechanism that since carboxylic acids such as tartaric acid and malic acid have the same carboxyl structure,anions migrate to the anode under the force of an electric field and adsorb on the surface of the anode by exchanging carboxyl group with hydroxyl group.Moreover,the carboxyl group of the organic acid also complexes with Ti4+to form a chelate compound,the formation of chelating anions will then cause corrosion.28Based on it,when a loose layer was formed especially after 2.0 Hz in Fig.16,the thickness of films would be lowered because of the corrosive effect.Hence,the schematic diagram of the film formation and PTFE nanoparticles spreading process under different frequencies is shown in Fig.17.
In Fig.17,the forming rate of the films gradually loses dominant as the frequency increases(0.5–1.0 Hz).In addition,the dissolution rate of films begins to exceed the forming rate and dominate as the frequency increases(2.0–10.0 Hz).Therefore,the optimal film formation point is delayed at about 2.0 Hz.Moreover,when the dissolution rate begins to dominate,more intense electrochemical reactions lead to the increase of energy,which also results in the crystalline phase transition.The generation of more rutile is described during 2.0–5.0 Hz in Figs.14 and 15.However,the more intense reactions must restrict the film formation,which is also presented in the decrease of the forming voltages in Fig.14 and the reduction of thickness in Fig.15(a).As been analyzed above,the reason behind the changes of electrochemical dynamic equilibrium is that large amount of PTFE nanoparticles entrapped in the defects of dense films can combine malic acid molecules,which results in the much energy from the intense dissolution reaction in the defects of films.However,the forming voltage decreases during 10.0–20.0 Hz in Fig.14.The energy source of film formation at 10.0–20.0 Hz mainly comes from the increase of frequency and squeezing and expansion of oxides.35
5.Conclusions
(1) Specimens get good tribological and electrochemical performance of the green composite anodic oxide films with ideal electrical parameters(1.0,2.0 Hz)and electrochemical parameters (malic acid),which can owe to the large loading of PTFE nanoparticles on the thick film.
(2) The crystalline phase transition has been proved to appear under low frequencies,and the extent of transition from anatase to rutile could be linked to the electrochemical dynamic equilibrium under different frequencies.
(3) PTFE nanoparticles can combine organic carboxylic acid(malic acid)molecules by forming hydrogen bonds,which results in the more intense dissolution reaction on composite anodic oxide films influencing the electrochemical dynamic equilibrium.
Declaration of Competing Interest
The authors declare that they have no known competing financial interests or personal relationships that could have appeared to influence the work reported in this paper.
Acknowledgements
This work was co-supported by the National Natural Science Foundation of China (Nos.51971040 and 51971044),and the Fundamental Research Funds for the Central Universities,China (2020CDJQY-A007).China Postdoctoral Science Foundation Funded Project (Nos.2017M620410 and 2018T110942),and the Chongqing Postdoctoral Scientific Research Foundation (No.Xm2017010).
 CHINESE JOURNAL OF AERONAUTICS2021年11期
- CHINESE JOURNAL OF AERONAUTICS的其它文章
- Parameter effects on high-speed UAV ground directional stability using bifurcation analysis
- Supersonic flutter control and optimization of metamaterial plate
- Review of in-space assembly technologies
- Utilisation of turboelectric distribution propulsion in commercial aviation:A review on NASA’s TeDP concept
- The influence of inlet swirl intensity and hot-streak on aerodynamics and thermal characteristics of a high pressure turbine vane
- Full blended blade and endwall design of a compressor cascade
