In-situ observation and finite element analysis of fretting fatigue crack propagation behavior in 1045 steel
Qinn HAN,Xusheng LEI,Yue SU,Shoshi RUI,Xinfeng MA,Hito CUI,Huiji SHI,*
a Aero-engine Thermal Environment and Structure Key Laboratory of Ministry of Industry and Information Technology,College of Energy and Power Engineering,Nanjing University of Aeronautics and Astronautics,Nanjing 210016,China
b AML,Department of Engineering Mechanics,Tsinghua University,Beijing 100084,China
c AMPTL,Department of Mechanical Engineering,Tsinghua University,Beijing 100084,China
d Sino-French Institute of Nuclear Engineering and Technology,Sun Yat-Sen University,Zhuhai 519082,China
KEYWORDS Crack growth rate;Fretting fatigue;In-situ observation;J-integral;1045 steel
Abstract In this paper fretting fatigue crack behavior in 1045 steel is studied by in-situ observation and finite element analysis.in-situ fretting fatigue experiments are conducted to capture real-time fretting fatigue crack formation and propagation process.The fretting fatigue tests under different load conditions are carried out,then the lifetime and fracture surface are obtained.The crack propagation rates under different loading conditions are measured by in-situ observations.With in-situ observation,crack initiation location and direction are analyzed.Finite element model is used to calculate J-integral which then is applied to fitting with experimental crack growth rate,and establishing crack growth rate model.From fitted S-N curve,it turns out that smaller load ratio leads to higher lifetime.Crack initiates slightly below the point equivalent to line contact of the contact surface in different test conditions,and crack direction shows no obvious relationship with load parameters.The established crack growth rate model well agrees with the test results.
1.Introduction
Fretting refers to the micro-scale relative motion between the contact surfaces under the coupling effect of vibration,temperature cycling and other alternating amplitude loads.1,2Researches show that fretting can reduce the service life of components by more than 50%.31045 steel is a high-quality medium carbon steel with high strength,which is often used to manufacture structural parts,such as gears and bolts.4Since it is a common material in connected structure,fretting fatigue failure often happens.
In the past few decades,test device of fretting fatigue has been developed by many researchers.5–13Ruiz et al.14carried out the fretting experiment of dovetail joint structure,established the numerical calculation model with programming method.The stress distribution of contact surface was determined,and the fretting fatigue failure criterion was proposed in this work.Considering simplified contact geometry,Murthy et al.designed a single clamp type experimental device.The Calculation model of Friction coefficient (COF) was determined,in order to analyze the change of COF during the fretting fatigue process.7Huston et al.developed grip type fretting fatigue test device.9,15–18Later,Golden et al.established a dovetail fretting fatigue experimental device,which well simulated the contact condition of dovetail joint in turbine engine.They studied the influence of blade root angle,contact area geometry,surface coating and surface treatment on fretting fatigue life.11,19–23However,the application of in-situ observation technology in fretting fatigue test remains to be developed.
In recent years,fretting fatigue life of titanium alloys,aluminum alloys,Ni-based superalloys,and stainless steel was studied.Noraphaiphipaksa24and Pape et al.25studied the effect of tangential contact load on fretting fatigue life of SUS316L steel atroomtemperature.Fouvry26andZhangetal.27carriedoutfrettingfatiguetestfortitaniumalloyindifferentnormalandtangential contact loads,and indicated the increase of these loads may reduce the formation of cracks and the service life of titanium alloy.In addition,the contact load also has a significant effect on the proportion of crack formation life and propagation life in the total life.Rengaraj and Han et al.studied temperature effects on fretting fatigue.They carried out fretting fatigue tests of Ni-Based Single crystal(NBSX)superalloy at room temperature,600 ℃and 700 ℃respectively under different crystal orientations.Theirworksconfirmedthatfrettingfatiguelifedecreased with increasing temperature or load.28–30Additionally,fretting fatiguepropertieshasalsobeenconducted.31–33Wahabetal.conductedsimulationsoffrettingfatiguestressdistributionbehavior in heterogeneous materials,revealed that the higher the ratio between the normal force and maximum shear force,the higher theeffectofheterogeneityonstresses.34,35Furthermore,theypredictedfrettingfatiguecrackinitiationindoublelapboltedjointby Continuum Damage Mechanics,and the predicted fatigue lifetimes are in good agreement with the experimentally measured ones.36Matlik et al.37observed the fracture surface of Ni-based singlecrystalafterthefrettingfatiguetest,andconfirmedthefracture happens along the crystallographic slip plane.Bhatti et al.38,39investigated factors of simulation on fretting fatigue crackinitiation,includingcriticalmicro-voiddefect,stressgradient and quadrant averaging.A weakened area was found,when the critical micro-void is located at different positions inside the sample.Chenetal.40investigatedfrettingfatiguecrackformation and growth in titanium alloy dovetail assembly by the Finite Element Method(FEM),and crack growth angle is accurately predicted.Despite a few existing work on crack propagation in fretting fatigue,experiments focus on crack propagation behavior in fretting fatigue are still lacked.
Due to the difference in load,the propagating crack can be divided into three types:openning(I),shearing(II) and tearing(III).41–48In order to simulate the law of crack growth more accurately,researchers have proposed a variety of crack growth rate model.49–57In 1960s,Paris and Erdogan49indicated that there is an approximate power exponent relationship between fatigue crack growth rate and stress intensity factor.Then,the influence of load parameters is considered.By introducing the stress ratioR,Walker51proposed a new model similar to Paris model.Forman50put forward a model withRand KIC,which is widely recognized.On the basis of Forman equation,Schu¨tz53considered the influence of crack growth threshold value ΔKth.Taking temperature related parameters into consideration,Jeglic et al.52proposed Arrhenius model,and obtained ideal predicted curve of fatigue crack growth in the range of 24–650 ℃.Salvati and Vasco et al studied plasticity-induced effects on crack growth behavior in overload or underload condition,58–60revealed the fundamental significance of the baseline fatigue cyclic loading for the evolution of the cyclic J-integral after underload.In the case of overload,it was found that crack closure mechanism has a longer lasting retardation effect on the crack growth rate than residual stress.Based on low cycle fatigue properties,Bao et al.61carried out fatigue crack growth rate prediction with Energybased models.With regard to crack growth model of fretting fatigue,Barlow et al.used Forman Newman de Koning(FNK) model to study the relationship between crack length and stress intensity factor in contact surface.62Golden and Calcaterra indicated the relationship between crack growth rate and stress intensity factor.20Then,Rajasekaran and Nowell63used ABAQUS for finite element modeling,and obtained a comprehensive mechanical analysis model whose results of stress on the surface and under the layer are more accurate.However,in terms of fretting fatigue,few crack growth model so far takes J-integral into consideration.
The aim of this paper is to study the crack behavior of 1045 steel in fretting fatigue and establish the crack growth rate model.The implementation of fretting fatigue tests and finite element method are presented in Sections 2 and 3.Section 4 shows the results of fretting fatigue tests,and crack growth rate model is also put forward in this section.From life data,the S-N curve is fitted.Crack direction and formation position are analyzed and micro morphology of the fracture is observed.Experimental crack growth rate and numerical simulation calculation are used to fit the crack growth rate equation.In Section 5,the work of the paper is reviewed and the main results are summarized.
2.Fretting fatigue experiment implementation
All specimens adopted in the fretting fatigue tests are made of 1045 steel.The schematic diagram of experimental set-up is shown in Fig.1.The specimen adopts the inverted triangle design,11,19and two symmetrical pads form fretting contact with the specimen (see Fig.1).The connecting component at the bottom is clamped and fixed by the lower chuck,and the top of the fixture is fixed and loaded by the upper chuck of the testing machine.The geometric dimensions of each part are shown in Fig.2.The specimens and pads are produced by wire-electrode cutting.To ensure consistency of roughness,all the contact surfaces of specimens and pads are polished with 1000-size sandpapers.
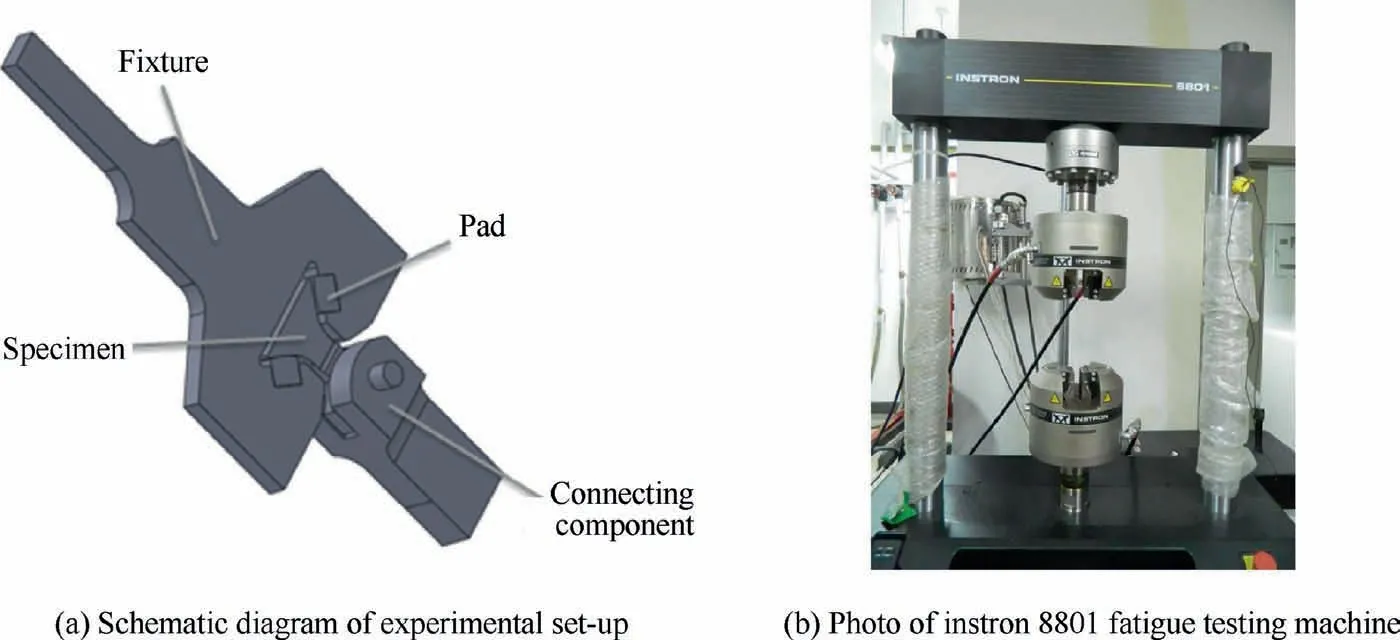
Fig.1 Schematic diagram of experimental set-up and testing machine.
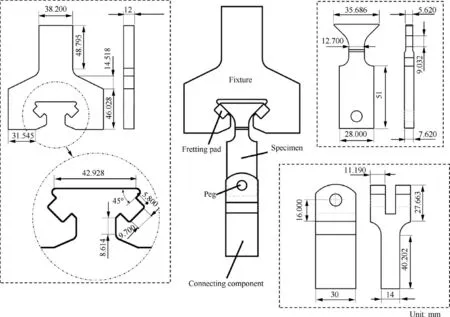
Fig.2 Experimental components and relative geometrical sizes.
The tests are performed on the Instron 8801 fatigue testing machine(see Fig.1(b)),and 8 test conditions are set and numbered in Table 1 below.Tensile-tensile load with a form of trigonometric wave is applied.The alignment validation was conducted using strain gauges.The strain gauges were arranged symmetrically on the left and right sides of the specimen and the fixture.The alignment performance was detected during the loading process,and the alignment error was within 8%.The loading frequency is 10 Hz,andFmaxmeans the peak value of the force,Ris the load ratio and two different load ratios are studied.64All experiments are conducted at room temperature.The real-time observation of the crack is carried out by the in-situ image acquisition system (see Fig.3),then the crack length is measured by the image measurement software.Therefore,the error in the experiment mainly depends on the resolution of the crack image.According to the resolution of our image,the crack length error is about 0.2 mm.
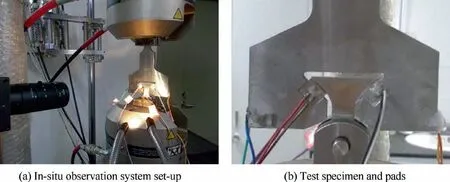
Fig.3 Specimen and in-situ observation system set-up.

Table 1 Loading design in this work.
3.Finite element modeling
ABAQUS Finite Element Method (FEM) is used to perform the crack model.The purpose of this model is to obtain the stress intensity factor and J-integral of the crack area under the corresponding load level and crack length in the previous 1045 steel experiment through the numerical simulation calculation.
According to the specimen and pads above,the threedimensional model is established (see Fig.4(a)).In order to interface with the experimental data,the three-dimensional model size is completely the same as in the experimental model.ABAQUS 6.10 is used for modeling and analysis.Half of the model is used here to reduce the amount of computation(see Fig.4(b)).In the following sections,symmetric boundaries are applied to achieve the same effect as the overall model.
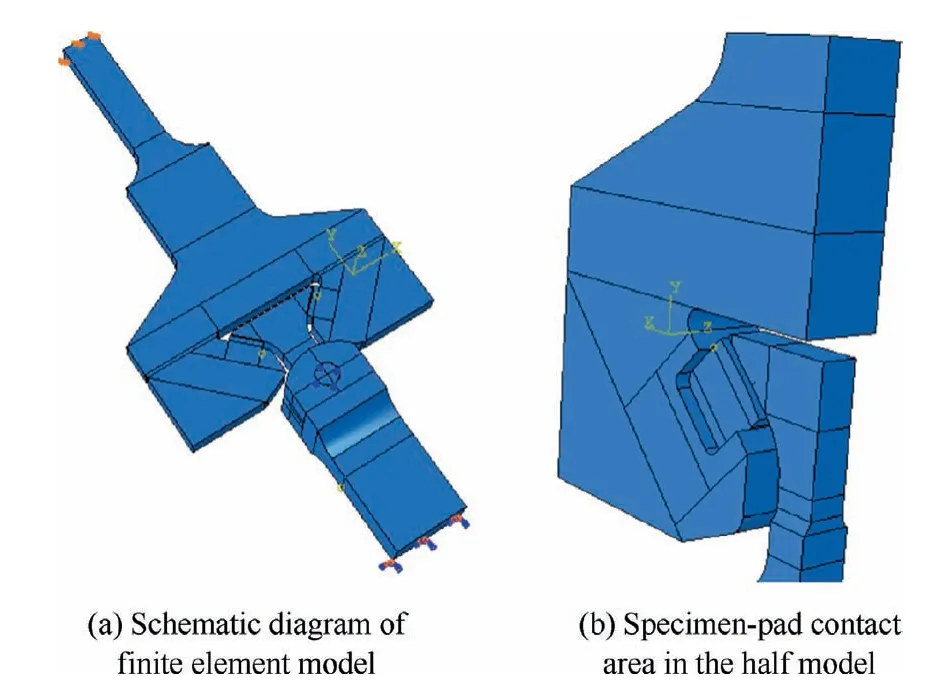
Fig.4 Finite element model of specimen and pads.
The crack was pre-set in the finite element model (see Fig.5).They are static FEM cracks which do not propagate over time.In order to obtain the stress intensity factor and J-integral of the crack edge under a specific crack length in our experiment,the direction and location of the crack are the same as the measured ones in the experiment.Tanduin Fig.5(b) are stress vector and displacement vector,and Γ is integral path.
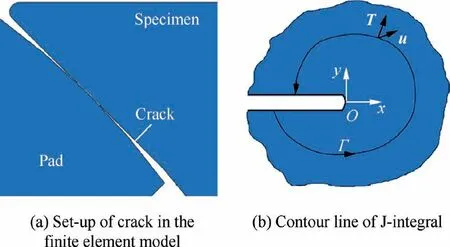
Fig.5 Crack set-up and J-integral calculation.
On the arrangement of the main and subordinate surfaces of the contact surface,pad surface is the main surface of the fixture and pad contact,and specimen surface is the main surface of the specimen and pad contact.The parameter input of 1045 steel is showed in Table 2.The ideal elastic–plastic constitutive law is applied on the specimen and pad in the FEM calculation.The tangential friction coefficient is 0.15.65The magnitude of the load is consistent with the experiment,which means that each experiment(with different loads)has a different FEM model.

Table 2 Material input parameters of 1045 steel.
The finite element mesh is as follows,and mesh at the contact area is encrypted (see Fig.6).The eight-node linear brick elements (C3D8I) with incompatible modes are applied in the modeling,which has been verified to have good performance in contact calculation.66The total number of nodes and elements are 18,488 and 12670.The value of Degrees of Freedom(DOFs) is 51432.The element size at contact area is 390 μm.The mesh convergence criteria are that the stress result changes less than 10% when the grid density is doubled.The Lagrangian multiplier method is employed to solve the contact problem.The contour integral method is applied to calculate J-integral in the finite element calculation.J-integral is the change rate of potential energy in crack growth,which is related to the line integral surrounding the crack tip.67Considering its path independent characteristic,we set up 4 contour lines in the models,and select the most ideal results.
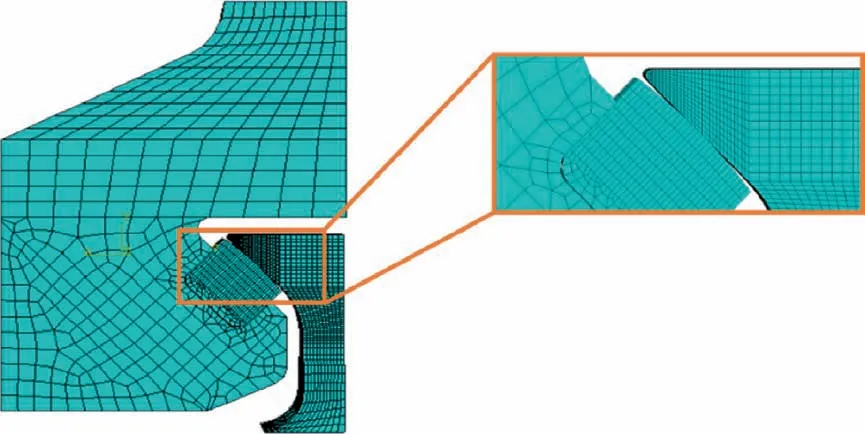
Fig.6 Finite element mesh.
4.Results and discussions
4.1.S-N curve of lifetime
The crack formation life obtained from the in-situ observation is shown in Fig.7 and Table 3.From the life data above,it can be seen that although the load ratio is different,the life data are close to each other at a sufficiently high force level.When the force level decrease,the crack formation life tends to increase.It is worth noting that the increase trend will be more obvious for the smaller load ratio in this paper.At a certain low force level,Fmax=10 kN,the crack formation life is close again for two different load ratios,and comes to about 4×10⁵.It can be seen that under the unifiedFmax,the life is higher whenR=0.2,which is reasonable.The amplitude of load and range of the stress intensity factor is smaller,so it is not easy to reach the crack formation threshold of the stress intensity factor.As a result,the service life will be longer.
Meanwhile,the basic Basquin life prediction relationship67is used for fitting.ΔFandNfare load amplitude and crack formation life respectively,a,bare fitting parameters,and the results are showed in Fig.8.Table 4 lists relative fitting parameter.The goodness of fit is 0.88.
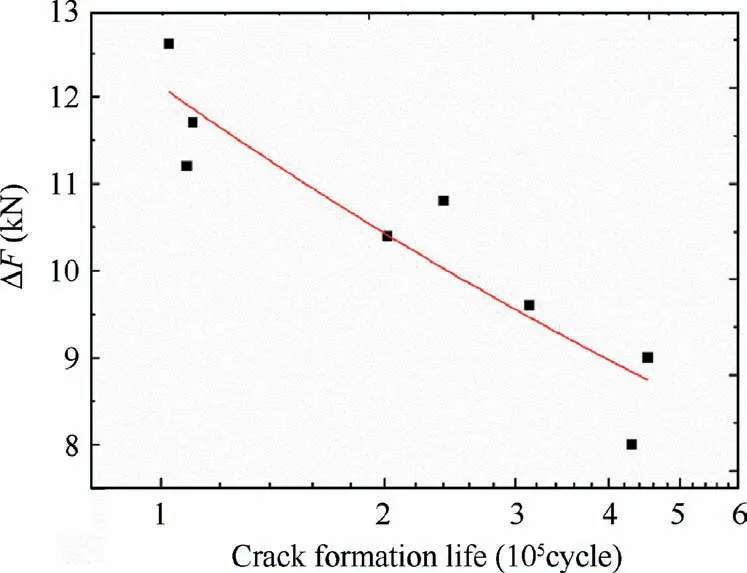
Fig.8 Basquin life fitting result.

Table 3 Fretting fatigue life data.
4.2.Crack direction and formation position
Based on the in-situ observation system,real-time image of crack formation is captured as Fig.9.The contact surface is taken as the reference to define crack direction,and the distance from crack root to tip of specimen is used to describe the crack formation location.The statistics of crack directions and crack formation locations in the experiment are summarized in Table 5 below.

Table 4 Fitting parameters of Basquin equation.

Table 5 Experimental results about cracks.
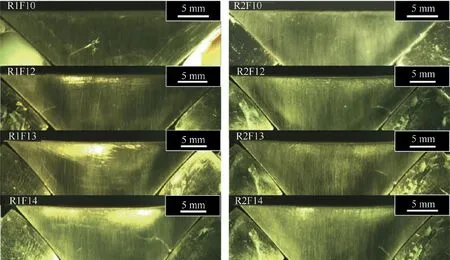
Fig.9 Experimental photo of cracks.
From the results above,several rules can be summarized.As the left and right positions where cracks initiate are relatively average(4 specimens on each side),it can be further confirmed that the experimental device has a good pair neutrality.The loading mode (FmaxandR) is not significantly correlated with the crack direction,which is approximately randomly distributed between 26° and 48°.And after a period of propagation,the crack will deflect and deviate to the direction of I-type crack.The crack initiates slightly below the point equivalent to line contact (7.3 mm away from the tip of the specimen).WhetherRis 0.1 or 0.2,the increase of force will make the crack position move downward.This is because both the force at the contact site and the bending moment affect the crack formation,and the bending moment causes the point of failure to shift slightly from the strict contact position.
4.3.Crack growth rate
Fig.10 shows the experimental curve of crack propagation length and cycle numberNin different test conditions.Obviously,the earlier crack initiates under the higher overall force level.In order to show the crack growth rate more clearly,da/dNis calculated by the average method:
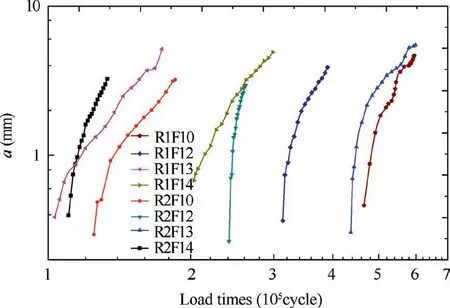
Fig.10 Crack length-life curve.

4.4.Microscopic observation of the fracture
Observations on the fretting fatigue fracture of 1045 steel is conducted by Scanning Electron Microscope (SEM).Fig.11 shows the micro-morphology near the crack formation zone.It is a single-source fracture with rough surface,and severe abrasion marks can be seen.
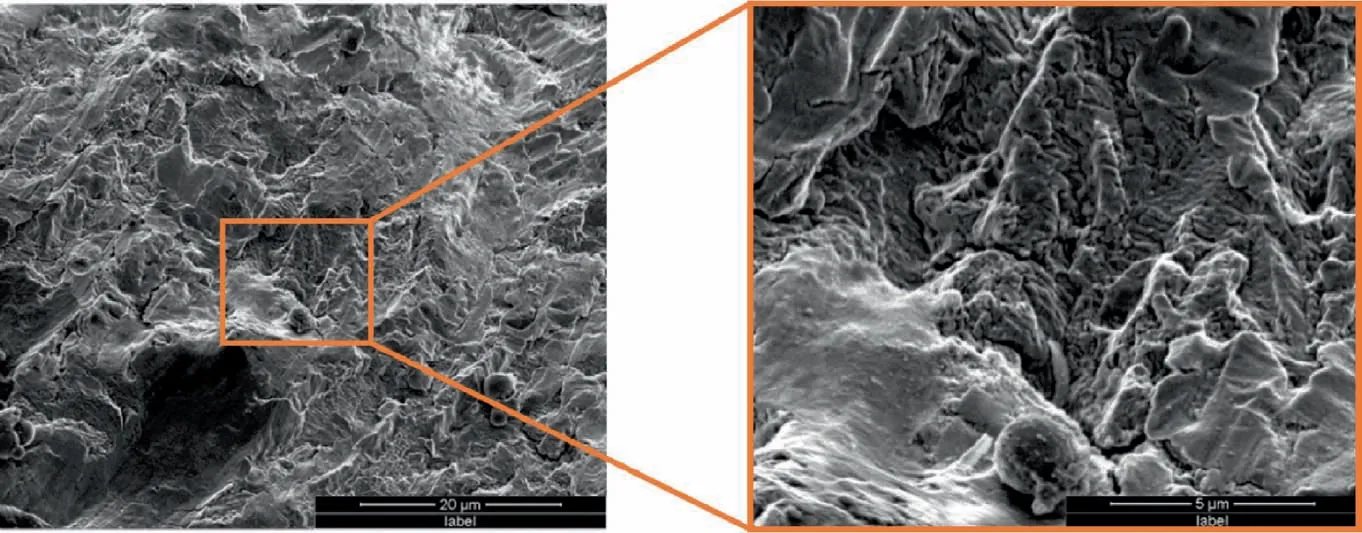
Fig.11 Crack formation position of 1045 steel.
In Fig.12,a large number of dimples are observed on the fracture surface,which indicates that the fretting fatigue fracture of 1045 steel belongs to ductile fracture.As shown in Fig.12(b)above,the river pattern is not obvious in the experiment,and the fatigue striation is also difficult to be observed.
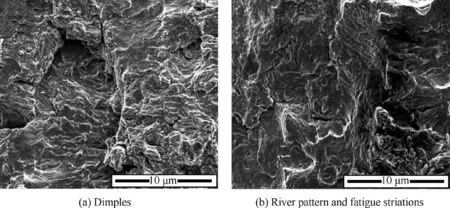
Fig.12 Fracture characteristics.
4.5.Crack growth rate modeling
From FEM analysis,ΔJis obtained as shown in Fig.13.It can be seen that as the crack propagates,ΔJhas a tendency of first decreasing and then increasing,and the minimum point of decline is relatively uniform,near 2.2 to 2.4 mm at horizontal ordinate.This results are quite similar with the dovetail joint model calculated by Golden and Calcaterra.20
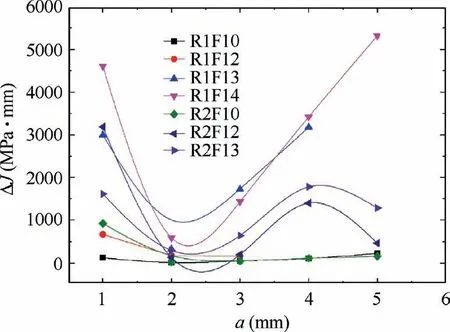
Fig.13 Change of ΔJ with a.
Through further consolidation,ΔJwith relative da/dNcan be listed,and Eq.(2) below is introduced to fit the data.

After fitting,m nandk(fitting parameters) in Eq.(2) are identified in Table 6,and a series of calculated da/dNcan be obtained.Fig.14 shows the comparison between experimental da/dNand calculated da/dNfrom Eq.(2).The logarithmic coordinate system is used.It can be seen that calculated results are within±2 scatter band of experimental result,and overall conservative,which is satisfactory.It indicates that the calculation results are close to the test results,and crack growth rate model in this paper has certain engineering significance.
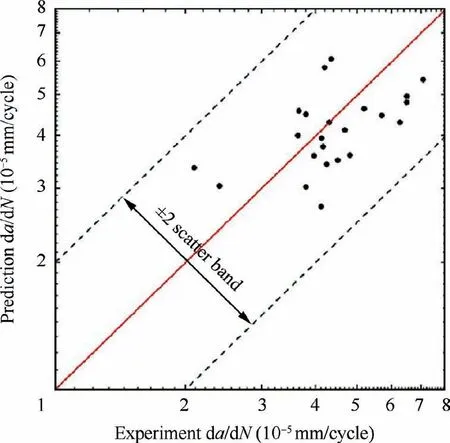
Fig.14 Prediction and experiment results of da/dN.

Table 6 Fitting parameters.
5.Conclusions
In this paper,crack growth rate model of fretting fatigue in 1045 steel is studied.The fretting fatigue tests under different load and load ratio are carried out,and crack formation and propagation are captured by in-situ observation system.
ABAQUS finite element method (FEM) is used to perform the crack model,and J-integral is calculated.Fitting the calculated results with experimental crack growth rate,identified equation is obtained eventually.
In summary,under the same load level,the fretting fatigue life is higher when load ratio is larger.From statistical results of crack formation and direction,it turns out that crack direction is approximately randomly distributed between 26° and 48°,which is not significantly correlated with the loading mode(FmaxandR).In terms of location,crack formation shifts downward slightly from the strict contact position of the surface under all test conditions.Comparing experimental crack growth rate with results from established crack growth rate model,all of the data points are in±2 scatter band.This indicates established crack growth rate model in the paper well consistent with test result.
Declaration of Competing Interest
The authors declare that they have no known competing financial interests or personal relationships that could have appeared to influence the work reported in this paper.
Acknowledgements
This work is financially supported by the National Natural Science Foundation of China (Nos.91860101,11632010,11902370 and 11572171),National Major Science and Technology Projects of China (No.2017-VI-0003-0073).
 CHINESE JOURNAL OF AERONAUTICS2021年11期
- CHINESE JOURNAL OF AERONAUTICS的其它文章
- Parameter effects on high-speed UAV ground directional stability using bifurcation analysis
- Supersonic flutter control and optimization of metamaterial plate
- Review of in-space assembly technologies
- Utilisation of turboelectric distribution propulsion in commercial aviation:A review on NASA’s TeDP concept
- The influence of inlet swirl intensity and hot-streak on aerodynamics and thermal characteristics of a high pressure turbine vane
- Full blended blade and endwall design of a compressor cascade
