
The driving force of water resource stress change based on the STIRPAT model:take Zhangye City as a case study
2021-10-21 09:02XiaTangXinYuanWangLeiFeng
Xia Tang,XinYuan Wang,Lei Feng
1.Key Laboratory of Ecohydrology of Inland River Basin,Chinese Academy of Sciences,Lanzhou,Gansu 730000,China
2.Northwest Institute of Eco-Environment and Resources,Chinese Academy of Sciences,Lanzhou,Gansu 730000,China
3.Gansu Monitoring Center for Ecological Resources,Lanzhou,Gansu 730020,China
4.Gansu Computing Center,Lanzhou,Gansu 730030,China
ABSTRACT A prominent contradiction between supply and demand of water resources has restricted local development in social and economic aspects of Zhangye City, located in a typical arid region of China. Our study quantified the Water Resource Stress Index(WRSI)from 2003 to 2017 and examined the factors of population,urbanization level,GDP per capita,Engel coefficient, and water consumption per unit of GDP by using the extended stochastic impact by regression on population,affluence and technology (STIRPAT) model to find the key factors that impact WRSI of Zhangye City to relieve the pressure on water resources. The ridge regression method is applied to improve this model to eliminate multicollinearity problems. The WRSI system was developed from the following three aspects: water resources utilization (WR), regional economic development water use(WU),and water environment stress(WE).Results show that the WRSI index has fallen from 0.81 (2003) to 0.17 (2017), with an average annual decreased rate of 9.8%. Moreover, the absolute values of normalized coefficients demonstrate that the Engel coefficient has the largest positive contribution to increase WRSI with an elastic coefficient of 0.2709, followed by water consumption per unit of GDP and population with elastic coefficients of 0.0971 and 0.0387,respectively.In contrast,the urbanization level and GDP per capita can decrease WRSI by −0.2449 and −0.089, respectively. The decline of WRSI was attributed to water-saving society construction which included the improvement of water saving technology and the adjustment of agricultural planting structures. Furthermore, this study demonstrated the feasibility of evaluating the driving forces affecting WRSI by using the STIRPAT model and ridge regression analysis.
Keywords:water resource stress index;STIRPAT model;driving force analysis;water scarcity
1 Introduction
Worldwide water use has increased by approxi‐mately 1% per year since the 1980s. With rising de‐mand in industrial and domestic sectors, global water demand is expected to increase at a similar rate until 2050, accounting for an increase of 20% to 30%above the current level of water use (UN-Water,2019). Also, water stress levels will continually in‐crease with the effects of intensified climate change.Under a certain natural geographical background and space-time scale, the influence of water resources and the water ecological environment on which human be‐ings depend upon and to maintain social-economic ac‐tivities are referred to as water resource stress (The Sustainable Development Strategy Research Group of Chinese Academy of Sciences, 2006).The pressure of water resources is affected by natural conditions, pop‐ulation size, life quality, economic aggregate and structure, technical conditions, pollution degree and other factors.
Over the past 20 years, many scholars have pro‐posed indicators such as water resource vulnerabili‐ty, water stress, water poverty index and water re‐source scarcity (Normanet al., 2013), which have been used to link scientific assessment of the scarci‐ty of regional water resources with governance prac‐tice. However, the aforementioned indicators or indi‐ces vary due to the content of the research and the spatial scale of the evaluation.In many studies,a wa‐ter stress index (WSI) has been widely applied to as‐sess water scarcity as a characterization factor, in which simulated available water resources were com‐pared with estimated water demand (Wadaet al.,2011; Schlosseret al., 2014; Zhouet al., 2016). Al‐though there lacks a consistent water resource stress assessment methodology, the three aforementioned water stress assessment approaches have been broad‐ly adopted to evaluate the impacts of human activi‐ties on water resource consumption at local, regional and global scales(Table 1).
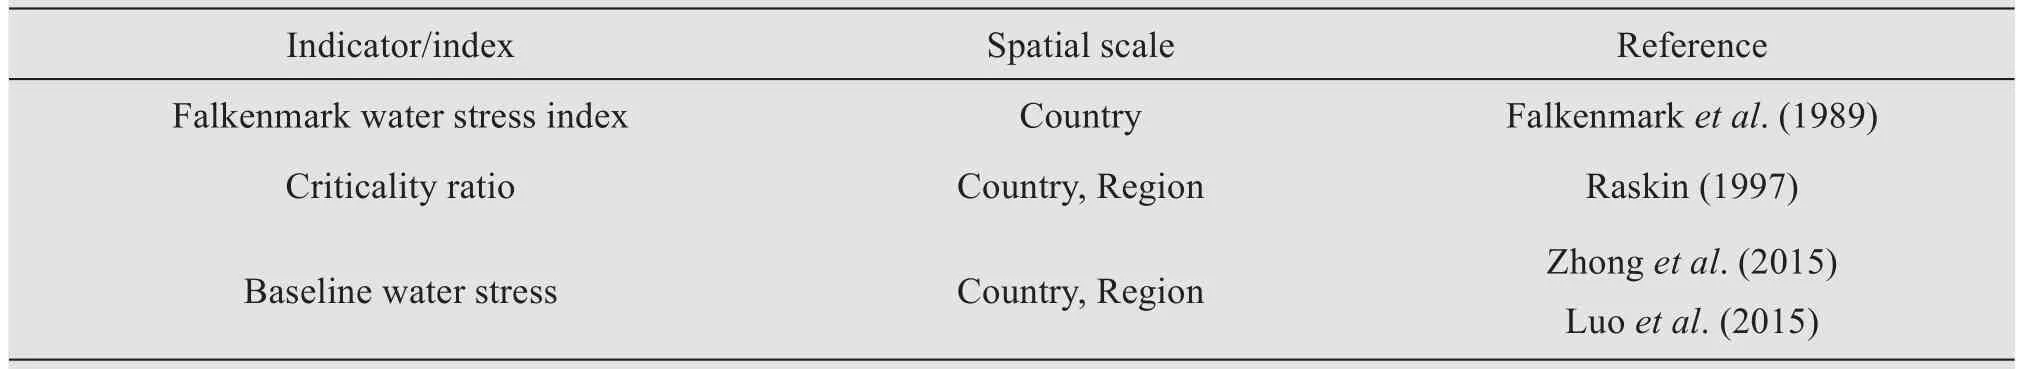
Table 1 Widely cited international water resource stress assessment indicators
Different measurements focus on different aspects of water resources pressures. The 'Falkenmark' Water Stress Index measures scarcity as the average per capi‐ta water availability per year (Falkenmark, 1989;Falkenmark and Widstrand, 1989).The Criticality Ra‐tio measures the scarcity of water as the proportion of water withdrawal with respect to total annual water availability (Alcamoet al., 1997; Perveen and James,2010). The UN Comprehensive Assessment of the World's Freshwater Resource regarded Criticality Ra‐tio as a technical water resources stress and intro‐duced a scale to characterize its value (Raskinet al.,1997).Recently,Aqueduct Water Risk Framework de‐veloped by the World Resources Institute(WRI),eval‐uates and scores water risks globally based on 12 indi‐cators, including baseline water stress (Gassertet al.,2013). Baseline water stress (BWS) measures the ra‐tio between total water withdrawal and available re‐newable surface water supply in a given place, and more widely is a good proxy for water risks.
Table 1 shows a few indicators and their spatial scales. However, the aforementioned indicators are generally univariate, involving water quality or quan‐tity. The ecological water demand and human influ‐ences on water supplies/management are rarely inte‐grated (Wheater and Evans, 2009). Furthermore, scale is often an ignored problem in assessment and gover‐nance of water resources. While wide scale assess‐ment models have made progress in addressing com‐plex water security issues (Vörösmartyet al., 2010),corresponding indicators are seldom comparable and meaningful at a community or regional level.
This paper developed the Water Resource Stress Index (WRSI) assessment method to address these is‐sues, such as composite indicators, scale, and multi‐variate analyses.To completely understand the impact of humans on the water resource stress driving factor,it is important to integrate and sustain water resources management. The stochastic impact by regression on population, affluence and technology (STIRPAT)model, which is derived from the IPAT model, has been employed as powerful methods to analyze the driving force of energy consumption and CO2emis‐sion (Ang, 2005; Dietz and Rosa, 2007; Rosa and Di‐etz, 2012; Zhanget al., 2012; Shafiei and Salim,2013). However, there have been few research studies on assessment of water resources influencing factors based on the STIRPAT model. The driving factors of the water footprint in Beijing (Jinet al., 2016) and Chinese agricultural sectors (Zhaoet al., 2014) have been comprehensively analyzed based on the STIR‐PAT model. Taking Sichuan Province as a case study Lianget al.(2011) employed the STIRPAT model to illustrate the main factors affecting the water environ‐ment in relation to resident population, urbanization,service industry development, and industrialization from 2007 to 2017.
In this paper, Zhangye City, located in the middle reaches of the Heihe River Basin (HRB) and the hin‐terland of the Hexi Corridor, was selected to conduct such a case study (Figure 1). Excessive water use in the middle reaches has led to rapid deterioration of the ecological environment of the downstream Ejina Oasis(Cheng,2002).At the same time,water disputes continue to occur and inter-provincial water conflicts in the basin have become increasingly prominent(Deng and Zhao, 2015; Zhanget al., 2015). However,quantitative evaluation of dynamic changes of time se‐ries water resources stress in Zhangye City is still in‐adequate(Tang and Feng,2016).In order to help gov‐ernments and management departments enhance a bet‐ter understanding of water stress impact on the socioeconomic development in Zhangye, we applied STIR‐PAT to assess water stress focusing on anthropogenic driving factors and provide suggestions for better management of water resources.

Figure 1 Location of Zhangye City in the Heihe River Basin of China
WRSI was used to assess the status of fresh water during 2003 to 2017, and to temporally explore water scarcity in Zhangye City. Considering that localized effectiveness of water conservation plans can help in identifying the driving factors as well as in determin‐ing adaptation measures, the STIRPAT model is then applied to quantify the influence of anthropogenic fac‐tors on WRSI. The objectives of our study were: (1)to analyze the water stress situation of Zhangye City for a 15-year assessment period;(2)to explore the un‐derlying factors that affect water resource stress change based on the STIRPAT model; and (3) to pro‐vide decision-makers with water stress reduction ini‐tiatives for Zhangye City.
2 Methodology
2.1 Study area
Zhangye City, located in the western part of Gan‐su Province, is the largest oasis in the HRB that in‐cludes Ganzhou, Linze, Minle, Shandan, Gaotai and Sunan minority autonomous country, as presented in Figure 1. The area is nearly 40,874 km2and lies between 97°20'E −102°12'E and 37°28'N −39°57'N.The population of Zhangye City is over 1.2 million,and most of the population lives in the middle plains and depend on agriculture for their livelihoods(Zhanget al., 2015). Although located in one of the driest zones in the world, due to abundant water and irriga‐tion from the Heihe river, Zhangye is a suitable place to sustain agriculture which has been developed here for thousands of years.
Zhangye City has a continental climate with an average sunlight of over 3,000 hours annually.Its cli‐mate is arid, with annual precipitation ranging from 100 to 300 mm,and annual evapotranspiration reach‐ing 2,000 mm. In Zhangye City, surface water and groundwater account for approximate 67% and 30%of the total water consumption of the HRB, respec‐tively (Liuet al., 2017). Although water consump‐tion of the agriculture sector accounts for 87.6% of the total water consumption in Zhangye, the sector's output only accounts for 37.8% of the local GDP(Gansu Water Resources Bulletin, 2013). Since the 1980's, water consumption has increased sharply in Zhangye City, leading to an intense conflict between midstream agricultural development and down‐stream ecological protection in the HRB. This con‐flict continues to intensify due to climatic variability,expanding population and agriculture (Chenget al.,2014). Therefore, assessing the water stress situation for the city is urgent.
2.2 Framework of WRSI
This paper assessed the water resource stress situa‐tion in Zhangye City by using a multiple indicatorbased WRSI framework, in which six variables and three components were selected to visualize water stress considering the relevance and availability of da‐ta in the study area. Table 2 shows the structure of WPI with the respective components and indicators of water stress. In order to make a comprehensive analy‐sis of the water resources pressure in Zhangye, the in‐dex is generated as a weighted additive value of three major components, which are the degree of water re‐sources utilization, economic development water use and the pressure of the water environment. The data between 2003 and 2017 were collected to illustrate the water stress changes over time.

Table 2 Details of the WRSI components and sub-dimensions
Water resources utilization (WR)
In analyzing water resources utilization, it is nec‐essary to consider the availability of groundwater,sur‐face water, and natural precipitation. This is a mea‐sure of water resource conditions which have been used to support regional development. The capacity component consists of:(1)the annual amount of avail‐able surface water and groundwater; and (2) average land use of water resources.
Regional economic development water use (WU)
This WU index is expressed as the different sec‐tors water used for economy development, including statistics on yearly water use by agricultural and in‐dustrial sectors.It measures the efficiency of water re‐sources use. The level of water use for economic de‐velopment is divided into two,namely the level of wa‐ter consumption per ten thousand yuan of GDP($/m3)and grain yield of per m3of water(kg/m3).
Water environment stress (WE)
Water utilization and management has always been emphasized for its negative impacts on environ‐mental integrity. Due to limited available data, the in‐dex strives to be more comprehensive comprising two variables: (1) annual average groundwater table level and(2)annual discharge of waste water.
2.3 WRSI calculation procedure
Many of the evaluated indicators are not ratios or percentages,but are rather absolute values.In order to ease comparison, alterations were made to normalize the indicators into a uniform and unidirectional scale using thresholds, and thus these indicators lie in a range of 0 to 1. All indicators are normalized using the min-max approach presented in Equation(1)(Pan‐deyet al.,2012;Jemmali and Abu-Ghunmi,2016):

whereyijis the original values;Eijis the standardized value of an indicator for locationyij;yjminandyjmaxare the lowest and highest values of all the study index considered, respectively. Moreover,iis the index se‐quence andjis the time series.
The components were classified into two types of indicators: positive and negative. For positive indica‐tors,the higher the original value of an index,the low‐er the pressure on water,such as water availability per capita. For negative indicators, the lower the primary value of a factor, the higher the pressure on water, for example, grain yield per m3of water, and average an‐nual groundwater table depth(m).
The mean square error weight method was used to determine the index weight, to maximize the accuracy of the research results as presented in Equation(2):
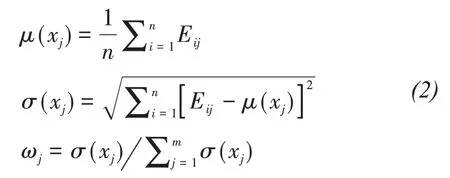
whereEijis the mean value of the indexxj,σ(xj)is the mean square error of the indexxj; andωjis the weight of the indexxj.
After the index weight of each single index calcu‐lated by the Equation(3)for integrated water resourc‐es pressure index number.

whereSis the comprehensive pressure index of re‐gional water resources;ωjis the weight distribution of each factors,andEijis the quantitative value of the re‐gional water resources stress index.
2.4 STIRPAT Model
The STIRPAT model used in our study is an ex‐tended version of the anthropogenic environmental impact, population, affluence, and technology (IPAT)equation.The IPAT model was firstly proposed by Eh‐rlich and Comnoner (1971) to estimate the impact of human activities on the environment change. The IPAT model shows that environmental impacts are a multiplicative function of population size (P), afflu‐ence (A), and technology (T). Furthermore, Dietz and Rosa (1994) contributed significantly to the develop‐ment of the IPAT equation by proposing the STIRPAT model on the basis of the original IPAT equation and its different derivative versions to overcome several of the previous versions' weaknesses. The STIRPAT model is expressed as:

whereIis the anthropogenic environmental impact.For the coefficients,ais the constant term andb,c,dare exponential terms ofP,AandT, respectively;andeis the error term. To obtain the linear logarith‐mic form, the model must always be expressed as follows:

Based on the local circumstances in Zhangye City and the experience of past studies (Tanget al., 2014),some improvements and modifications of the driving forces were made as follows: urbanization level and income levels change on water resource stress change, then we extended the original STIRPAT mod‐el by taking the urbanization level and income levels into consideration. The extended STIRPAT model is expressed in Equation(6), and the specific variables in the model are presented in Table 3.

Table 3 Variables in the extended STIRPAT model
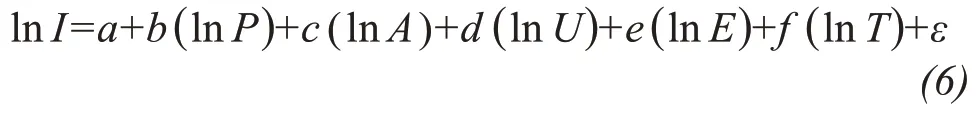
WhereIstands for Water Resource Stress index(WRSI). Adisplay the influencing factors of income levels change,and the proportion of GDP per capita is proposed to measure such an effect.Ustands for the urbanization level, which is reflected by the percent of urban population on the total population.Edis‐plays Engel coefficient that has revealed the structure relationship between income and consumption at a so‐cial development stage.Tdisplays the influencing fac‐tors of technical development level change, so water consumption per unit of GDP is used to represent technology level in this study. Based on the concept of ecological elasticity introduced by Yorket al.(2003), the driving force coefficients ofb,c,d,e, andf,respectively refer to the percentage change inIin re‐sponse to a 1% change in the driving force with other factors held constant.
2.5 Multicollinearity testing
Multicollinearity refers to a statistical phenomenon that multiple independent variables in multiple regres‐sion analysis exhibit significant linear correlation(Tim‐mermans, 1981). It can be tested by valuing the vari‐ance inflation factors (VIF) of the variables.The VIFs are the diagonal elements of inverse of the correlation matrix describing the correlations between predictor variables. If the VIF is larger than 10, it indicates that a severe multicollinearity existed. Multicollinearity will result in large standard error among related inde‐pendent variables. These errors are mainly reflected by regression model parameters'large variance (Maet al., 2017). Hence, this phenomenon indicates that the probability of serious multicollinearity is non-ignored.
2.6 Ridge regression
This study applied ridge regression analysis to achieve a regression estimation for Equation(6)to solve multicollinearity in a multiple regression. The Ridge regression analysis is one of the most famous biased estimations established by Hoerl and Kennard(1970) in the 1970s which can handle multicollineari‐ty by incorporating a small biaskto the diagonal of the quantity (Hoerl and Kennard, 2000).The ridge es‐timator is expressed as follows:

wherekis the ridge parameter or the biasing parame‐ter that satisfiesk≥0;whereIis an identity matrix.
In general,the value ofkshould be between 0 and 1 and depends on the variation trends of ridge traces(Ho‐erl and Kennard, 1970; Dijkstra, 2014). The ridge re‐gression can be converted back to ordinary least square(OLS)regression as a special case given thatk=0(Dietz and Rosa, 1994). Considering the fact that mean square error is reduced at the cost of a variance in parameter estimation, an appropriate ridge regression coefficientkthereby should not only reduce VIF under acceptable range but also should be as small as possible. Other‐wise,a few studies applied an effective approach to de‐termining the most stablekat a quantitative level on the basis of the original outputs of ridge regression analysis. The ridge trace plot method is a widely ap‐plied method that has been employed in this case. Thecoefficients are plotted by changingKwith a step length of 0.02 within [0, 1] and the optimal value forkis chosen at the point whereappears to stabilize.
2.7 Data sources
The data on grain yield, the quantity of water re‐sources, water consumption, groundwater table depth,and discharge of waste water were collected from Gansu Water Resources Bulletin (2003 −2017). The data sources of the extended STIRPAT model, includ‐ing population, urbanization, GDP per capita, Engel coefficient, and water consumption per unit of GDP,were collected from the Statistics Yearbook (2003 −2017)of Zhangye City.
3 Results
3.1 Accounting for WRSI in Zhangye City
Over the entire study period 2003 −2017, there were significant variations in the values calculated for WRSI (Figure 3). WRSI appears to fluctuate signifi‐cantly and shows two stages: decreasing stage (2004−2010), and increasing stage (2010 −2014). However,values of the first stage are higher than the later stage. Interestingly, there is a decline after the year 2015. The average WRSI in Zhangye City was 0.54.The WRSI score of 0.85 in 2004 indicated the worst water resource stress situation. In contrast, 2017 had the best situation with a WRSI score of 0.17. Gener‐ally, it can be concluded that (1) the water resource stress situation in Zhangye City is evolving in a posi‐tive way, and (2) relatively long time-series data(2003−2017) is more helpful for identifying and in‐terpreting the dynamics of water stress compared with short-term data.
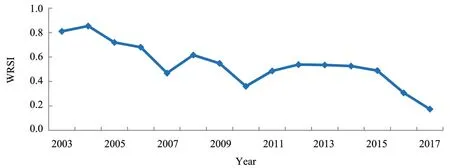
Figure 2 Dynamics of water resource stress index from 2003 to 2017
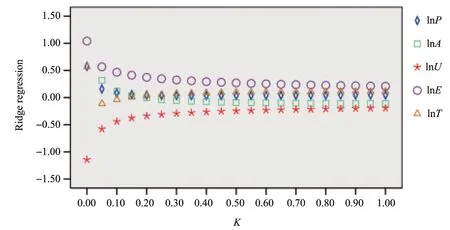
Figure 3 Ridge trace curve
3.2 Selection of influencing factors
The univariate statistical analysis of five selected alternative influencing factors is presented in Table 4.Primarily, we conducted a correlation analysis between alternative influencing factors (Table 5) and WRSI within Zhangye using bivariate correlation with SPSS 19.0 software.According to Table 5, among all the al‐ternative influencing factors,P− population,A− GDP per capita,U−urbanization level,E−Engel coefficient,andT−water consumption per unit of GDP have a high correlation with WRSI within Zhangye at a signifi‐cance level below 0.1%.Therefore,we select these fac‐tors for our research.
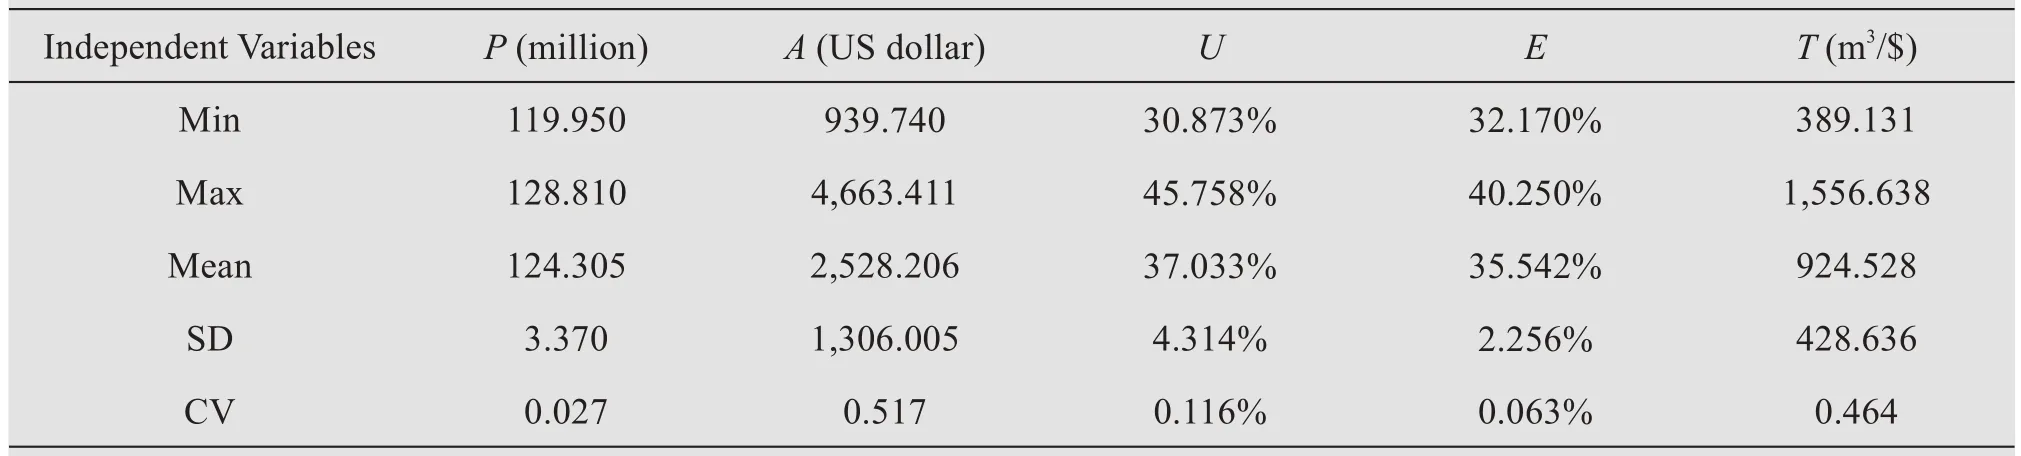
Table 4 Univariate statistical analysis of the driving factors

Table 5 Matrix of correlations between variables
3.3 Ordinary least square regression of the model
Initially, the correlation coefficients among vari‐ables are tested by SPSS 19.0 software.According to Table 6, most of the correlation coefficients are above 0.9, indicating that lnIhas a significant correlation with lnP,lnU,lnA,lnE,and lnT.
Furthermore, we conducted an Ordinary least squares (OLS) regression to estimate the coefficients of the model and summarized the results in Table 7.The coefficients of determination,R2and adjustedR2,are both close to 1. Additionally,F=96.902, at 0.1%significant level. Combined with the above correla‐tion analysis,the OLS result is likely to have consider‐able multicollinearity among different variables.If the VIF(variance inflation factor)value is higher than 10,multicollinearity will seriously affect the accuracy of the regression model. Apparently, the VIF value shows that all variables are larger than 10 and ranging from 13.645 to 92.286 (except lnE), which indicates there is serious multicollinearity among variables.Thus, the OLS estimation of the STIRPAT model does not reflect the real relationship among water re‐source stress and driving factors. To eliminate the multicollinearity among variables, ridge regression method is introduced for modeling.

Table 6 Matrix of correlation between variables
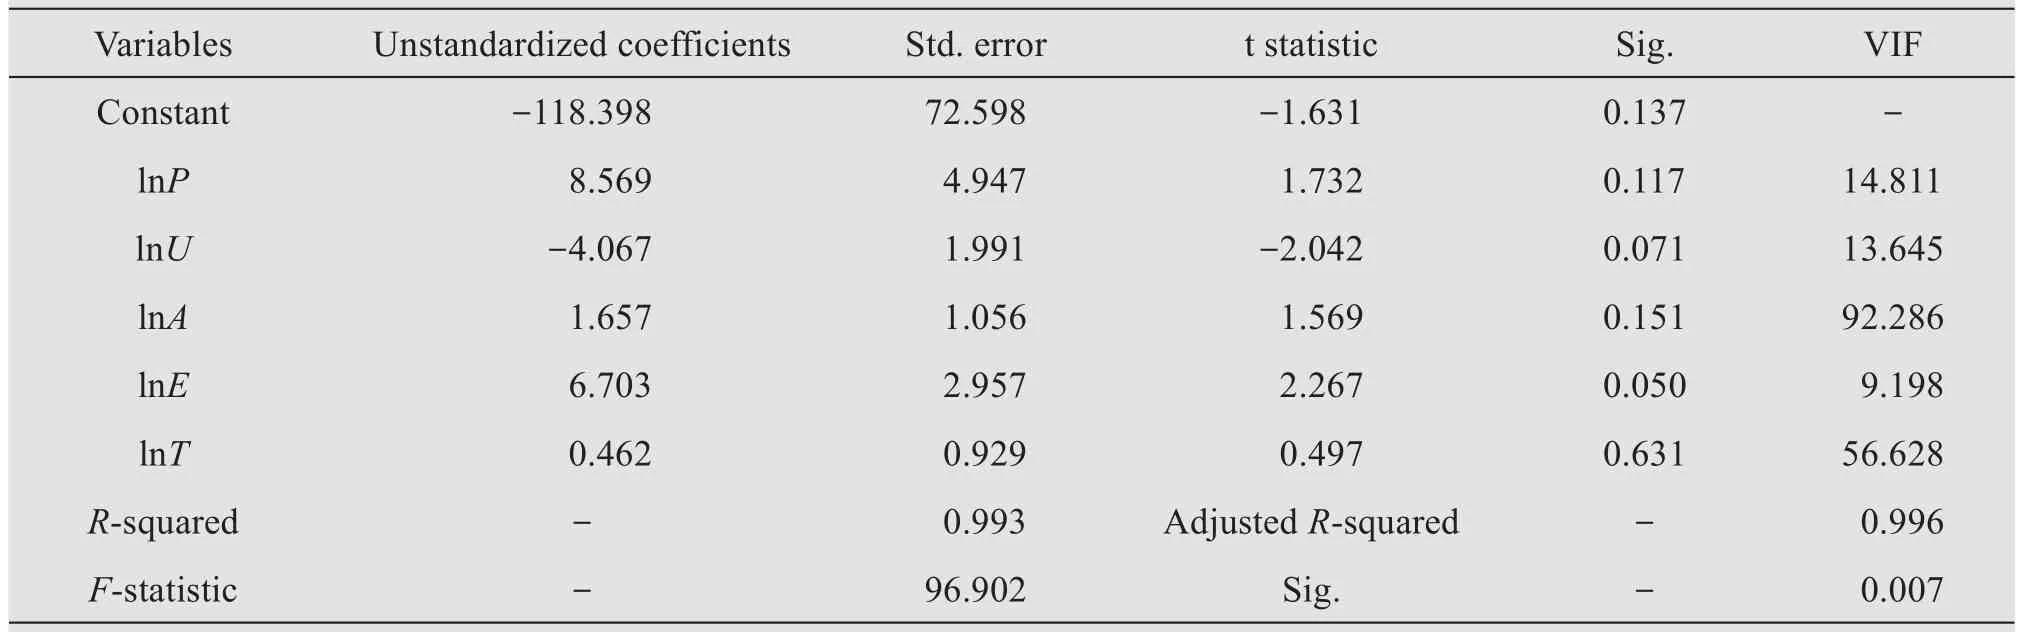
Table 7 Influencing factors of water resource stress by OLS
3.4 Ridge regression
We used SPSS 19.0 software to curve a ridge trace with akstep length of 0.02, wherek=0.02 is the increment of the search, so the value of the step size does not affect the regression results.Whenk>0.5,all the curves have been gradually stabilized (Figure 3).Therefore, the number 0.5 is selected as the ridge pa‐rameter because the coefficients of independent vari‐ables tend to be stable at this point. As indicated in Table 8, whenk=0.2, the regression coefficients of all explanatory variables are significant at the 0.1%significance level. AsR2=0.929, the overall fits re‐flect satisfactory results. In addition, the F statistic value is significant at the level of 0.01 and the VIF of every explanatory variable is less than 10. There‐fore, the STIRPAT model in this study can be ex‐pressed as follows:
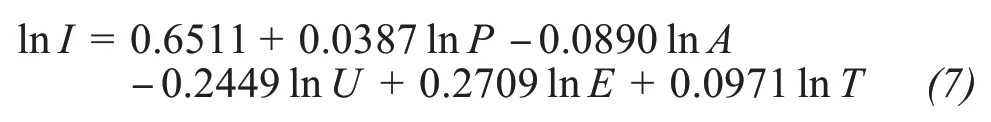
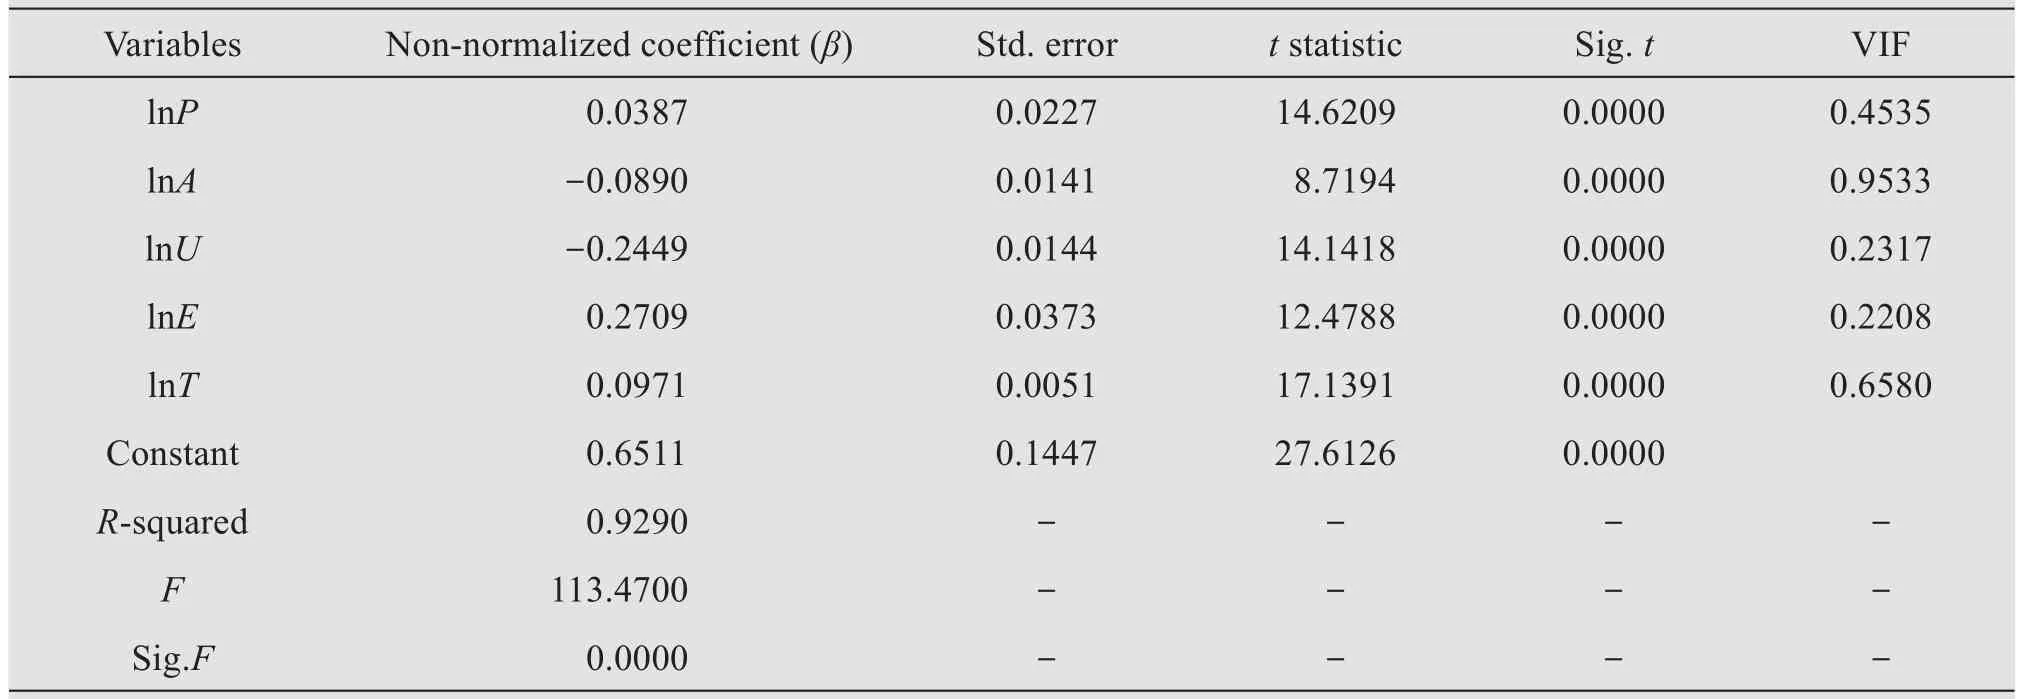
Table 8 Results of the ridge regression(K=0.2)
4 Discussions
As presented in Equation(7)for WRSI within Zhangye, population, urbanization, GDP per capita,the Engel coefficient, and water consumption per unit of GDP have different effects on WRSI during the sample period.The importance of these driving forces can be expressed by absolute values of their different values in decreasing order,as follows:the Engel coef‐ficient (0.2709), urbanization level (0.2449), water consumption per unit of GDP(0.0971),GDP per capi‐ta (0.0890) and population (0.0387). In addition, the Engel coefficient, water consumption per unit of GDP and population has positive impacts on the increase in WRSI. In contrast, urbanization and GDP per capita decreased WRSI. We know that the elasticity coeffi‐cient of urbanization is 0.2449, which means that, as urbanization grows, WRSI within Zhangye will de‐crease by 24.49%.
In the middle of the 1970s, the United Nations Food and Agriculture Organization (FAO)adopted the Engel coefficient, as one of the important standard level of life evaluation of rich and poor in a country or region. The Engel coefficient of Zhangye City, as the largest positive driving force,has experienced con‐tinuous decline from 0.4025 in 2003 to 0.3217 in 2017. This indicates that WRSI elasticity in relation to the Engel coefficient during the period of this study is 0.2709, which shows that every 1% decrease in population will result in 27.09% water resource stress decrease.According to the life criterion of FAO, dur‐ing the past fifteen years, the living standard of Zhangye citizens has changed from "richness" to "the most rich". Residents are no longer satisfied with the provision of enough food and clothing but also tend to pursue a quality lifestyle characterized by a balanced diet structure, nutritious food, and so on.As standards of living have risen, decreasing WRSI was attributed to the integrated HRB management including the wa‐ter-saving society construction since 2002. This means that economic development and water conservation have achieved synergy.
Due to the acceleration of urbanization and the un‐precedented rate of economic development, the rapid growth of the urban population scale in Zhangye City directly results in decreasing WSRI, which the urban‐ization rate of population has raised from 30.87% in 2003 to 45.76% in 2017.Urbanization also has a huge impact on the decrease of Zhangye City overall water resource stress. The elastic coefficient of urbanization is 0.2449,suggesting that every 1% urbanization level increase will cause a 0.2449% WSRI decline. In fact,from the perspective of agricultural production,urban‐ization may have an inhibitory effect on the agricultur‐al sector's water consumption increase because urban‐ization will transfer the labor force from agricultural sectors in rural areas to industrial and service sectors in urban areas.Thus,in the near future the agriculturerelated water resource pressure caused by urbaniza‐tion will intensify, which implies that policymakers should control the urbanization rate of China at a rea‐sonable level (Zhaoet al., 2014). Also, the scale of many large cities population has also expanded signif‐icantly. Because of different living standards and life‐styles, urban residents consume much more water than people in rural areas (Smith and Mohanty,2018).Hence,in addition to population size,the urbanization level will also be considered to explain the water re‐source stress of Zhangye City.
Water consumption per unit of GDP, as a measure of technical development, is a very important index that reflects the development of water use in an area.Water consumption per unit of GDP plays a synergist role in WRSI within Zhangye City. From 2003 to 2017, water resources were used more efficiently while water consumption per unit of GDP fell more than fourfold. The majority (98%) of water usage is for socio-economic purposes, and of this amount,85% is used for agriculture (Figure 4). Similar to the results of other studies,other scholars found that tech‐nology has contributed to a decline in water intensity in Zhangye City. On the one hand, planting technolo‐gy in Zhangye has significantly improved (Luet al.,2015;Tang and Feng,2016).With the development of water-saving irrigation technology, Zhangye has used sprinkler irrigation, micro irrigation, mechanical film,and mechanized furrow sowing instead of traditional irrigation. In particular, Zhangye has actively im‐proved water-saving irrigation areas. In 2003,Zhangye had 132.22 million hectares, but there were 280.97 million hectares in 2017. These technologies have effectively solved the problems of agricultural water shortage, poor water storage capacity, and the low efficiency of irrigation water,which have a signif‐icant impact on the reduction in the use of agricultural water within Zhangye City. On the other hand,Zhangye City in the midstream area was selected as the first construction experimental site by the Water Saving and Conservation Society (WSCS)of China in 2002, and was based on turning cultivated land into forests or grasslands (2002−2004). This was support‐ed by a water reallocation scheme in 2000 by which the midstream area should discharge 950 million m3of water in normal years to downstream areas when the upstream area discharges 1,580 million m3of wa‐ter (Luet al., 2015).With its plan to turn itself into a water-efficient society, the city is making substantial efforts to improve water utilization efficiency in farm,industrial and service sectors.
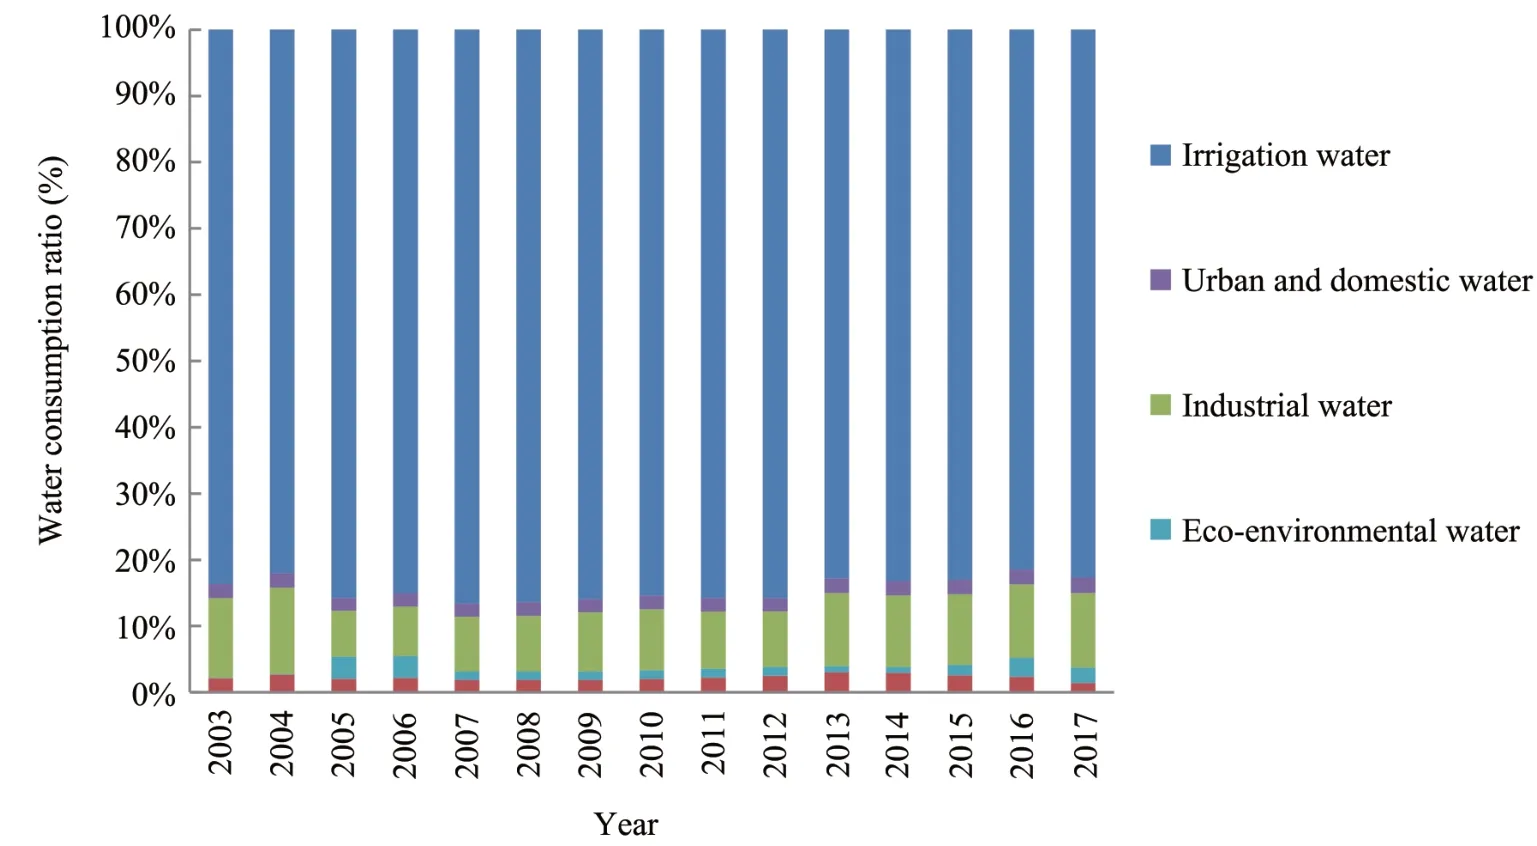
Figure 4 Water structure change
GDP of Zhangye has an inhibitory influence on WRSI during the study period, with an elastic coeffi‐cient of −0.089. Due to the income per capita reach‐ing a higher level, the water resource consumption can benefit from economic growth because people may employ advanced technologies to improve the water use efficiency, thus alleviating the water re‐source pressure to some extent. Zhangye City has ac‐tively advanced water-saving agriculture's structure adjustment and made an effort to establish a powerful industrial city.Accompany with the application of the water-saving city construction, Zhangye has adjusted planting structure of grain, economy and feed to 70:25:5.Meanwhile,the local government and related industry associations are trying various ways, taking effective measures to help the enterprises to import more advanced technology and equipment, strive for water reuse rate of up to 65%.
Population shows a positive influence on the WRSI decrease from 2003 to 2017 with an elastic coefficient of 0.0387. For Zhangye City, population size has grad‐ually decreased from 1.273 million to 1.229 million during the study period.Owing to the rapid process of urbanization, some residents have migrated to large cities. Thus, the population scale of many large cities has expanded significantly. The urbanization process of Zhangye is featured by its expansion of the urban population and emerging oasis agriculture. Zhangye's per capita water resources show an increase from 2,432.37 m3in 2003 to 3,063.55 m3in 2017. This causes a reduction of WRSI in Zhangye City.
5 Conclusions
The quantitative analysis of the impact of anthro‐pogenic factors on water stress is a central issue in terms of research on water sustainability. In order to evaluate water stress, several indicators coupled with social, environment, and economic aspects of water stress were selected to comprehensively assess the wa‐ter scarcity situation and temporal variations based on the Water Resource Stress (WRS) in our study. More‐over, the extended STIRPAT model and the ridge re‐gression method were employed to examine the fac‐tors that influence WRSI within Zhangye City from 2003 to 2017. The primary conclusions of our re‐search are as follows.
(1)As the nation's first pilot project for building a water-saving society work, Zhangye has achieved sig‐nificant results in the water use sector from 2000, and these achievements have led to the decrease water stress during the period of 2003−2017.
(2)All of the five driving forces selected, the En‐gel coefficient, water consumption per unit of GDP and population has positive contributions to WRSI during the study period. In contrast, urbanization and GDP per capita have inhibited WRSI of Zhangye. The different contributions of the aforementioned driving forces can be expressed by their different absolute elas‐ticity coefficient values in decreasing order, as follows:the Engel coefficient (27.09%), urbanization level(−24.49%),water consumption per unit of GDP(9.71%),GDP per capita(−8.9%),and population(3.87%).
This study proves the feasibility of evaluating the driving forces of WRSI by using the STIRPAT model and the ridge regression analysis.To address multicol‐linearity among independent variables, a ridge regres‐sion method has been employed to give a more reli‐able estimation for the coefficient under acceptable er‐rors. However, although assessing water stress work has largely progressed in numerous aspects, several drawbacks in quantifying analysis of major socioeco‐nomic factors impact on water stress at the national and regional levels remain unclear.
In the future, the Water Resource Stress Index(WRSI) assessment method could be improved by in‐corporating more appropriate data.The results are pre‐liminary because potential influencing factors such as spatial variability,water utilization structure and virtu‐al water trade should receive more attention.
Acknowledgments:
This research was funded by the Natural Science Foundation of Gansu Province, China (Grant No.18JR3RA385)and the National Natural Science Foun‐dation of China (Grant No. 41801079). The authors would like to thank the editors and anonymous re‐viewers for their detailed and constructive comments,which helped to significantly improve the manuscript.
 Sciences in Cold and Arid Regions2021年4期
- Sciences in Cold and Arid Regions的其它文章
- Progress,problems and prospects of palynology in reconstructing environmental change in inland arid areas of Asia
- 10Be exposure ages of Quaternary Glaciers in Antarctica
- Ground temperature variation and its response to climate change on the northern Tibetan Plateau
- Application of geodetector in sensitivity analysis of reference crop evapotranspiration spatial changes in Northwest China
- Ecophysiological responses to drought stress in Populus euphratica