
Ground temperature variation and its response to climate change on the northern Tibetan Plateau
2021-10-21 09:02GuoNingWanMeiXueYangXueJiaWang
GuoNing Wan,MeiXue Yang,XueJia Wang
Yulong Snow Mountain National Field Observation and Research Station for Cryosphere and Sustainable Development,State Key Laboratory of Cryospheric Science, Northwest Institute of Eco-Environment and Resources, Chinese Academy of Sciences,Lanzhou,Gansu 730000,China
ABSTRACT Ground temperature plays a significant role in the interaction between the land surface and atmosphere on the Tibetan Plateau(TP).Under the background of temperature warming,the TP has witnessed an accelerated warming trend in frozen ground temperature, an increasing active layer thickness, and the melting of underground ice. Based on high-resolution ground temperature data observed from 1997 to 2012 on the northern TP,the trend of ground temperature at each observa‐tion site and its response to climate change were analyzed.The results showed that while the ground temperature at differ‐ent soil depths showed a strong warming trend over the observation period,the warming in winter is more significant than that in summer.The warming rate of daily minimum ground temperature was greater than that of daily maximum ground temperature at the TTH and MS3608 sites. During the study period, thawing occurred earlier, whereas freezing happened later, resulting in shortened freezing season and a thinner frozen layer at the BJ site. And a zero-curtain effect develops when the soil begins to thaw or freeze in spring and autumn.From 1997 to 2012,the average summer air temperature and precipitation in summer and winter from six meteorological stations along the Qinghai-Tibet highway also demonstrated an increasing trend, with a more significant temperature increase in winter than in summer. The ground temperature showed an obvious response to air temperature warming, but the trend varied significantly with soil depths due to soil heterogeneity.
Keywords:ground temperature;soil freezing-thawing processes;the Tibetan Plateau;climate change
1 Introduction
Frozen soil is an important component of the cryo‐sphere (Nelson, 2003; Zhanget al., 2008; Zouet al.,2017;Qinet al.,2018)and is closely related to hydro‐logical, climatic, and environmental changes. Perma‐frost regions occupy approximately 24% of the ex‐posed land surface of the Northern Hemisphere(Zhanget al., 2003), while the areal extent of season‐ally frozen ground (including the active layer over permafrost) constitutes approximately 56% of the Northern Hemisphere's landmass (Zhanget al., 2003).Owing to its high elevation and complex topographic form, the Tibetan Plateau (TP) comprises widely de‐veloped seasonally frozen soil and permafrost, despite its relatively low latitude.
Recent monitoring results indicate that perma‐frost, the active layer and seasonally frozen ground have all been affected by climatic warming (Harriset al., 2003; Zhaoet al., 2004; Lawrence and Slater,2005; Osterkamp, 2007; Liet al., 2008; Wu and Zhang, 2008; Romanovskyet al., 2010; Smithet al.,2010;Wuet al., 2010;Yanget al., 2010; Guglielminet al., 2011; Harriset al., 2011; Chenet al., 2019).Satellite remote sensing data indicated that soil freezing and thawing are occurring earlier in the northern parts of Eurasia (Smithet al., 2004). The permafrost and seasonally frozen soil on the TP have been degrading and will continue to degrade due to climate warming. From the 1970s to the 1990s, the temperature of seasonally frozen soil and sporadic permafrost rose by 0.3 − 0.5 °C, and the annual mean permafrost temperature increased by 0.1 − 0.3 °C (Cheng and Wang, 1982; Tong and Wu,1996).
Frozen ground interacts closely with the climate system (Nelson, 2003; Wanget al., 2015a; 2015b).Climate change is altering the regional environments that affect the dynamics of frozen soils, including both temperature and moisture conditions. In freezing and thawing processes, the soil will absorb and re‐lease vast amounts of latent heat, resulting in changes in ground temperature, which in return will affect the exchange of energy and water between the land sur‐face and atmosphere (Dinget al., 2000; Yanget al.,2003, 2019; Guoet al., 2011a, 2011b; Wanget al.,2016). Recent studies indicated that the ecological en‐vironment has deteriorated on the TP through process‐es associated with warming temperature. The shallow parts of the soil column have become drier, and de‐sertification occurs in some TP areas (Yanget al.,2004,2010;Xueet al.,2009).
The ground temperature may influence local weather and climate processes on the TP by changing surface properties and processes, including albedo and evapotranspiration (Yasunariet al., 1991;Yanget al., 2003). In the context of climate change, issues that need to be addressed include permafrost degrada‐tion on the plateau ecological environment (Kanget al., 2010;Yanget al., 2010; Wanget al., 2012; Muet al., 2017), hydrological processes (Zhanget al.,2016), and water cycle (Geet al., 2011; Luoet al.,2018)and assessment of engineering structures'stabil‐ity (Wu and Niu, 2013). The rise in the ground tem‐perature is the most crucial indicator of permafrost degradation.
The thermal conditions of frozen soil on the TP exhibit spatial and temporal heterogeneity (Dinget al., 2000; Zhaoet al., 2000). Snow (Zhang, 2005;Yanget al., 2008), land surface vegetation (Wanget al., 2012), groundwater (Geet al., 2011), microtopog‐raphy and other factors will also affect the soil ther‐mal conditions. More importantly, freezing and thaw‐ing of soils in cold regions directly impact greenhouse gases in the atmosphere (Wuet al., 2010). Permafrost was found to release abundant CH4(Subkeet al.,2003; Richard, 2010) and CO2(Richard, 2010) during thawing (Zimovet al., 2006; Muet al., 2016), which will further aggravate the climate warming on the plateau. Additionally, it is safe to say that frozen soil's potential influences on the local climate, eco‐logical environment (Richard, 2007; Hao, 2008), wa‐ter resources(Immerzeelet al.,2010),and the stabili‐ty of engineering construction (Wu and Zhang,2009) cannot be ignored. In the past 50 years, the Northern Hemisphere temperature has increased asymmetrically, with the lowest temperature increase being about 1.4 times that of the highest temperature(Penget al.,2013).
To sum up, understanding soil hydrothermal con‐ditions not only helps investigate the response and feedback mechanisms of soil freezing and thawing processes vis a vis climate change (Guoet al., 2018)but also provides a scientific basis for local, sustain‐able development and may assist in integrating the economy,society,and environment.
Under climate warming, the cryosphere, including the frozen ground, has undergone considerable change and received much attention recently. In this study,we analyze the high-resolution observation of ground temperature along the Qinghai-Tibet highway in rela‐tion to the temperature and precipitation data of near‐by meteorological stations to reveal the trend at vari‐ous soil depths in each observation site.Also analyzed was the response of ground temperature to climate change.
2 Study area and data
2.1 Study area description
Ground temperature monitoring sites are mainly distributed from north to south along the Qinghai-Ti‐bet highway (Figure 1). In this study, five sites,i.e.,D66, TTH, D110, BJ, and MS3608, were selected for comparative investigation.Among these sites, the un‐derlying soils at D66, TTH, and D110 are permafrost,whereas those at BJ and MS3608 are seasonally fro‐zen soil. Except for D66, which has a desert surface cover, the rest have a vegetative surface cover com‐prised of short grasses during the warm season. Soils at D66 site are predominantly sandy silt loam with small and scattered pebbles. Details on the geographi‐cal location, latitude and longitude, elevation, vegeta‐tion, and soil composition of each site are described in Yanget al.(2000, 2003). From July to September 1997, Chinese and Japanese scientists cooperated in the "Global Water Balance-Asian Monsoon Experi‐ment in the Qinghai-Tibet Plateau" (GAME-Tibet ) to establish ground temperature observation systems in different locations on the northern TP. The ground temperature observation system comprises ten plati‐num ground temperature probes(Pt)and two data log‐gers. The data is automatically collected and recorded once per hour. The depths of the ten temperature probes (Pt) are 4, 20, 40, 60, 80, 100, 130, 160, and 200 cm,and the deepest point varies depending on the local geological conditions.

Figure 1 Geographical location of ground temperature observation sites on the Tibetan Plateau
2.2 Data collection and processing
The 12 observation sites are located in the high altitude wilderness on the Northern TP (Figure 1).Although we had accumulated abundant experience on ground temperature observation, data of some ob‐servation sites were missing or intermittent due to the harsh environment (e.g., extremely low tempera‐ture ) and unexpected incidents (e.g., rodents). Some sites were damaged, and the data were missing for certain periods and up to now in a few cases.Consid‐ering completeness and continuity, the data from 1997 to 2012 from those five sites mentioned above were chosen to explore the long-term and interannu‐al variation trend. It should be pointed out that,among these sites, the data from the BJ site is the most complete and uninterrupted from 2000 to 2005.We calculated the mean ground temperature in the summer (June, July and August, referred to as JJA)and winter (December, January and February, re‐ferred to as DJF) of the longtime series of the D66,TTH,D110 and MS3608 sites.
Temperature and precipitation have a significant impact on soil temperature.We identified six meteoro‐logical stations near these soil observation sites, in‐cluding the Geermu, Tuotuohe, Wudaoliang, Anduo,Bange and Naqu stations, along the Qinghai-Tibet highway and retrieved the air temperature and pre‐cipitation data from the initial observation year to 2012 from the China Meteorological Administration Meteorological science data sharing service network(http://cdc.cma.gov.cn/home.do).
3 Results and analyses
3.1 Soil freezing and thawing processes
We selected the BJ site as the typical example in this study. Soil temperature and moisture content at the BJ site from 1 January, 2001 to 31 December,2005 are depicted graphically in Figures 2 and 3, re‐spectively. These figures reveal substantial seasonal variations in both soil freezing and thawing process‐es at the BJ site. Soil freezing was assumed to begin when soil temperature at the sensor position falls be‐low 0 °C. When the average daily soil temperature rises above 0 °C, the soil thawing is assumed to be‐gin. In early September, soil temperature gradients began to invert. Soil temperature in the upper part of the soil column (above 80 cm) cools rapidly, while those below this level cooled more slowly. With de‐creasing shallow soil temperature, the ground tem‐perature gradient dropped markedly on the vertical profile. From early November, soil started to freeze from the surface downward. Take data of 2001 in Figure 2a for example, the soil at 4-cm depth began to freeze on November 12, and the soil freezing date was delayed gradually with an increasing depth, as indicated by the right-slanting 0 °C isotherm. Dur‐ing this period, a "zero-curtain effect" was apparent.Specifically, soil pore water moved from the unfro‐zen underlying layers to the freezing front, where it froze and released latent heat. Owing to a lowering of the ground temperature gradient in the vertical profile, the soil became a closed system, where the heat and mass exchange channels with the atmo‐sphere were closed by the surface frozen soil (Zhaoet al.,2000).

Figure 2 Ground temperature isolines at the BJ site(a)2001,(b)2002,(c)2003,(d)2004,(e)2005,(f)Mean of 5 years
With the lowering of ground temperature, soil moisture content above the 100-cm depth dropped rapidly due to moisture phase transition. The accom‐panying release of latent heat during phase change delayed the completion of the freezing process con‐siderably. During the entire period of freezing, soil moisture content above 100-cm depth remains rela‐tively low, and its gradient at depths ranging from 4 to 100 cm is minimal. Because the ground at depths of 160 to 210 cm remains unfrozen throughout the year, soil moisture content within this depth zone stays relatively high. The soil moisture-content iso‐lines are very dense, indicating high moisture con‐tent gradient(Figure 3).
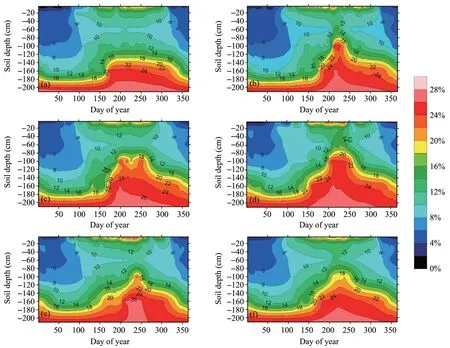
Figure 3 Soil moisture content isolines at the BJ site(a)2001,(b)2002,(c)2003,(d)2004,(e)2005,(f)mean of 5 years

Figure 4 Interannual variation of soil freezing time(day)at the BJ site
At the end of February, the frozen depth reached the maximum for the year, and the soil began to thaw in mid-March. Because the frozen soil may store a considerable amount of water and prevent evapora‐tion in the shallower layer, the moisture content is high when the soil begins to thaw (Yanget al., 2003).The moisture in the shallow ground (i.e., 4 to 20 cm deep) increased substantially due to precipitation dur‐ing the summer monsoon period.
Interannual variations in soil freezing and thaw‐ing processes at the BJ site are substantial. In 2001,the soil at 4-cm depth began to thaw on 28 March,and thawing at deeper depths lagged well behind,by 35 days between thaw at the 4-cm and 130 cm.However, thaw began six days earlier at 4 cm in 2002 and reached a maximum depth of 160 cm. It should be noted that the soil thawed bi-directional‐ly. In 2001, the soil at 160 cm began to thaw earlier than soil at depths of 20 to 130 cm. This phenome‐non is more evident in 2002, with the thaw at 160 cm starting even earlier than at 4 cm. However, there are exceptions. Compared to 2001, ground thaw at 20 and 40 cm in 2005 was delayed by 6 and 2 days,respectively. Conversely, soil thaw at 4, 60, 80,100, and 130 cm started 10, 1, 16, 2, and 16 days earlier,respectively.
Soil freezing onset date also shows delays. In 2001,the soil freezing at 4 cm began on 12 November and extended through to 130 cm deep on 31 Decem‐ber, for a duration of about 50 days. This indicates that freezing extended over a relatively longer period compared with thaw.This demonstrates the "zero-cur‐tain" effect as the latent heat released during freezing is dissipated. Compared to 2001, the dates that freez‐ing reached 4 and 130 cm depths in 2002 were de‐layed by 6 and 12 days,respectively.
On average, the ground freezing period de‐creased gradually throughout the study period (Fig‐ure 4). At 4 cm, this period was 135 days in 2001 but fell to 124 days in 2002.After increasing to 134 days in 2003, it then dropped again to 127 and 125 days in 2004 and 2005, respectively (Table 1). This decreasing trend is more apparent at deeper depths.From 2001 to 2005, the freezing period at 80 cm was reduced by 26 days and that at 130 cm by 57 days. Notably, the soil at 160 cm remained unfro‐zen throughout most of the year from 2003 to 2005.In contrast, the freezing duration at this depth was 67 days and subsequently dropped to 41 days in 2002.

Table 1 Soil freezing time(day)at various depths at the BJ site
3.2 Interannual variation of mean ground temperatures in summer and winter seasons
The monitoring results show that the ground tem‐perature on the plateau has increased significantly over the past few decades.The annual average ground temperature of the seasonally frozen soil and the is‐land permafrost during 1970−1990 (12−15 m below the ground surface) increased by 0.3−0.5 °C (Cheng and Wu, 2007), while the permafrost showed a more obvious warming trend in the last ten years. The warming rate near the permafrost upper limit was 0.06°C/a(Zhaoet al.,2010).
The average ground temperatures in the summer season (JJA) and winter season (DJF) at various depths from 1998 to 2007 were computed and de‐picted in Figure 5. The respective average summer ground temperatures in at 80 cm and 130 cm in D66 were 6.8 and 4.3 °C in 1998, decreased to 4.2 and 1.5 °C in 2001, then rose to 7.6 and 4.9 °C in 2002,and reached 6.7 and 4.5 °C in 2007 (Figure 5). In comparison, the average winter ground tempera‐tures at D66 showed an increasing trend from 1998 to 2006, although the warming trend at 40−263 cm depths was not evident. During this period, the respective warming rates at 4 and 20 cm depths were 0.16 and 0.13 °C/a,whereas those at 40−100 cm depths ranged from 0.02 to 0.05 °C/a. However,the warming rates at 130 −263 cm depths were indistinctive.
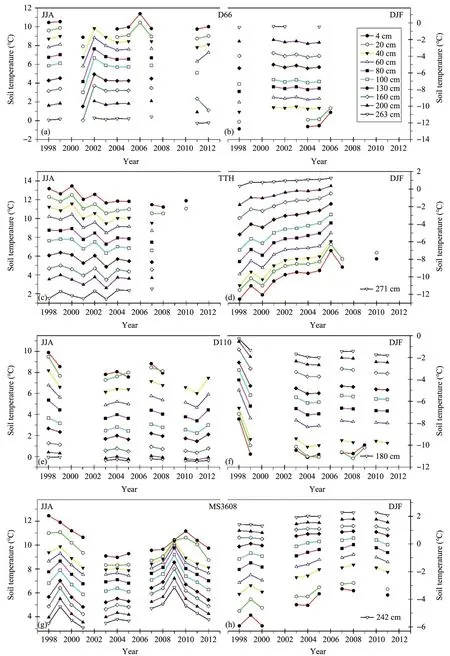
Figure 5 Interannual variation of mean summer(JJA)and winter(DJF)ground temperature at the D66,TTH,D110,and MS3608 sites.JJA indicate June,July and August,and DJF indicates December,January and February
For the TTH site, the respective average sum‐mer ground temperatures at 4 and 20 cm depths de‐creased from 13.2 and 12.3 °C in 1998 to 11.9 and 11.1 °C in 2011, corresponding to cooling rates of 0.14 and 0.13 °C/a.And the cooling rates at 40−200 cm ranged from 0.02 to 0.05 °C/a.Among all ten depths,the cooling rates, ranging from 0.01 to 0.19 °C/a,rose with decreasing depths, except for 271 cm depth, where the ground temperature exhibited a warming trend of 0.09 °C/a. In contrast, the average winter ground temperature showed a significant warming trend. From 1998 to 2006, the average warming rate of the ten depths reached 0.39 °C/a. For example, at 100 cm depth, the average winter ground temperature was −7.0 °C in 1998 and subse‐quently increased to −3.2 °C in 2006. Furthermore,the warming rates at 4 and 20 cm were still 0.39 and 0.37 °C/a as time forwarded from 1998 to 2010.Overall, the ground temperature at the TTH site showed a significant warming trend during the study period.
It can be seen that the average summer ground temperature at D110 decreased from 1998 to 2008.For instance, the ground temperature at 0 cm was 9.9 in 1998 and decreased to 7.9 °C in 2008, correspond‐ing to a cooling rate of 0.12 °C/a during the period(Table 5). Moreover, the ground temperature cooling rates at 20−180 cm ranged from 0.02−0.06 °C/a. For the winter,it is easy to see that the ground tempera‐ture in 1998 was the highest during the observation period, which was related to the snow disaster in the northern TP during the 1997−1998 winter, and the snow disaster was the most severe in the area near D110 (Yanget al., 2008). Due to the low ther‐mal conductivity, snow has a heat preservation ef‐fect on the ground (Zhang, 2005), resulting in an average winter ground temperature of − 7.2 °C at 4 cm depth in D110, which is 3 °C higher than the average soil temperature from 1999 to 2009,i.e.,−10.2 °C (Table 2).A previous study indicated that the rare snow in 1997−1998 sharply reduced both the air and ground temperature near D110, and the average air temperature in the nearest Anduo meteorological station was −21.2 °C in December 1997, about 7.7 °C lower than the average temper‐ature of December 1998 (−13.5 °C) (Yanget al.,2008).
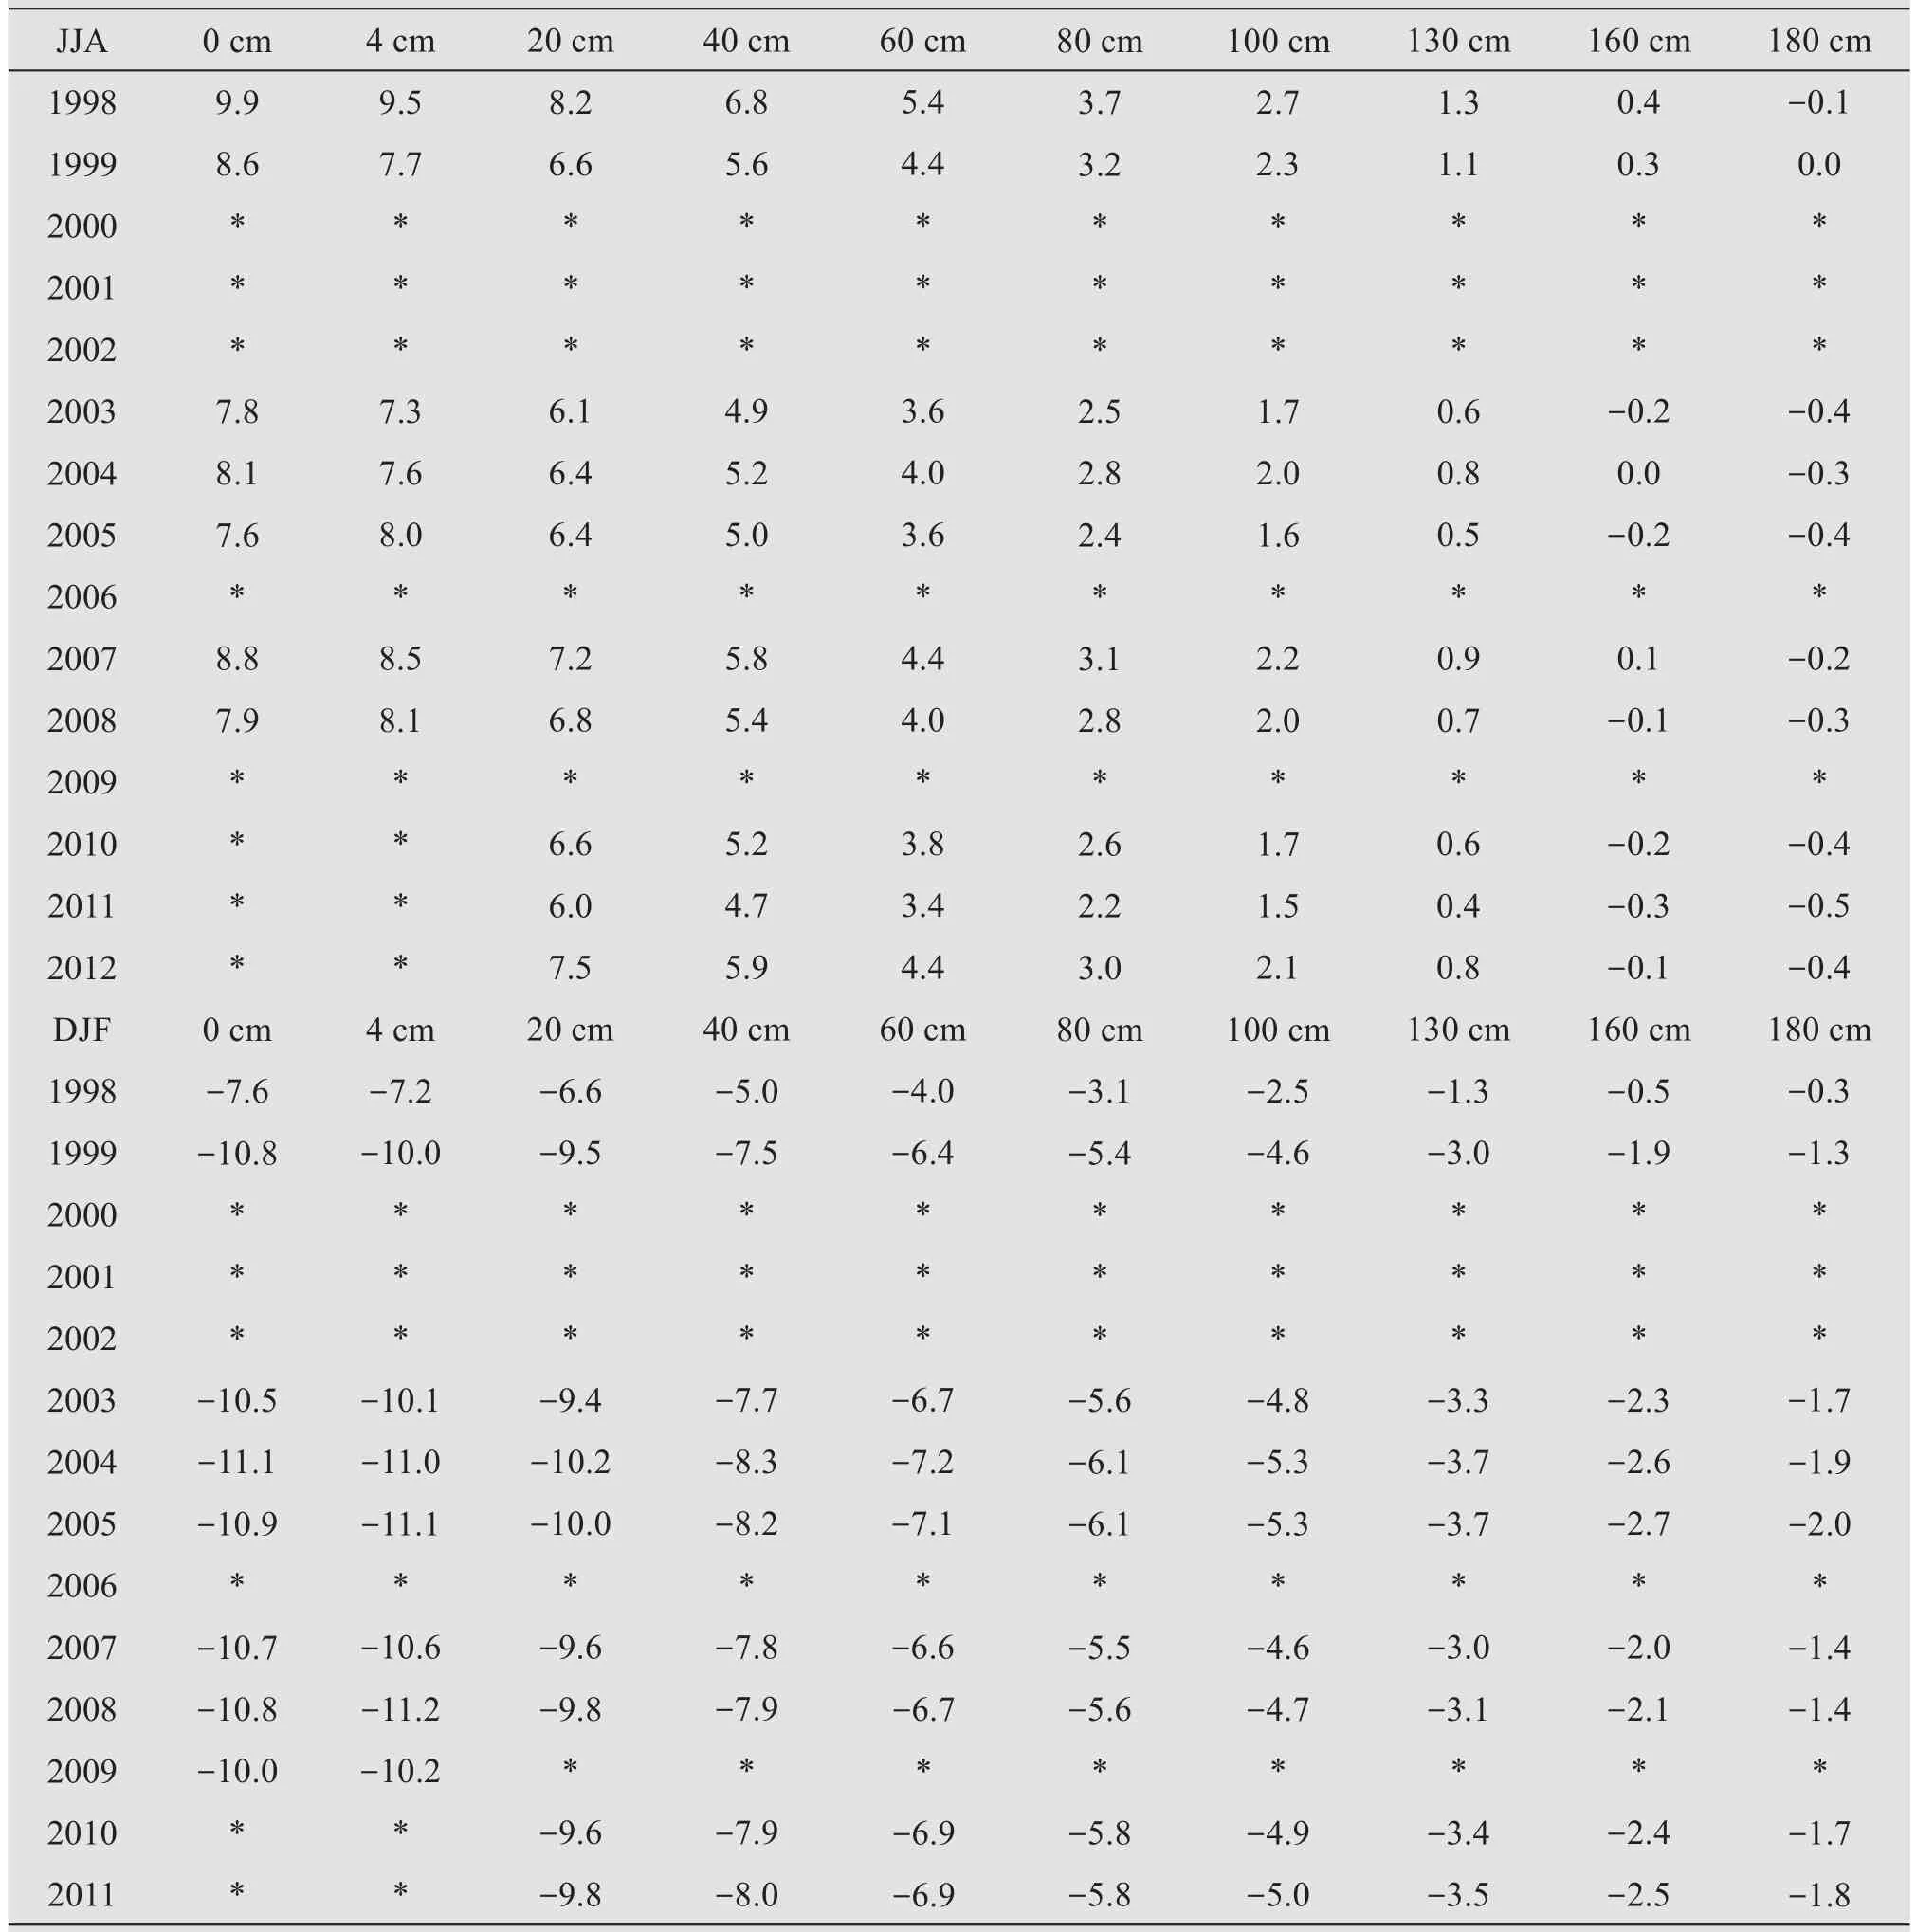
Table 2 Interannual variation of summer and winter mean ground temperature of the ten layers at D110 site.JJA indicates June,July and August,and DJF indicates December,January and February
The average winter ground temperature at all ten depths of MS3608 exhibited a consistent warming trend from 1998 to 2011, with warming rates ranging within 0.06 − 0.21 °C/a and an average of 0.14 °C/a(Figure 5). In contrast, there appeared to be some complex phenomena in summer ground temperature,and the trend varied with soil depths. From 1997 to 2012, the temperature at 4, 20, 40 and 60 cm de‐creased significantly at a respective cooling rate of 0.10,0.06,0.02,and 0.02°C/a.On the contrary,ground temperature below 80 cm increased. The warming rates at depths of 80, 100, 130, 160, 200, and 160 cm were 0.02, 0.04, 0.07, 0.08, 0.09, and 0.09 °C/a, re‐spectively. Because the warming rate was generally large than the cooling rate,the average ground temper‐ature at the ten depths in the MS3608 site showed an obvious warming trend.
It may appear to be contradictory that the aver‐age summer ground temperature at shallow depths in the MS3608 site decreased under climate warming.When examining the ground temperature, it is neces‐sary to consider precipitation (Wuet al.,2007;Chowet al., 2008) and evaporation (Wuet al., 2006). In the local water and energy cycle, especially on the TP, the shallower soil transferred moisture and ener‐gy to the atmosphere through evaporation. As a re‐sult, soil temperature in shallow depths (4 −60 cm)decreased moderately (Figure 6). Owing to the limit‐ed impact of evaporation on soils at greater depth(80 cm and deeper) and air temperature warming,the temperature at deeper ground (80 − 242 cm) also in‐creased (Figure 6). We conclude that local evapora‐tion and precipitation have an important impact on shallow ground temperature, but their effects dimin‐ish at increasing depths.So we will continue to focus on these complicated and significant feedback effects and interaction among soil temperature and moisture content, precipitation, and local evaporation in future research.
The average ground temperature observed at all ten depths in the MS3608 site was computed for the summer and winter seasons and depicted in Figure 5,which showed a noticeable warming trend. From 1998 to 2011, the average winter ground temperature increased from −1.7 °C to −0.6 °C,corresponding to a warming rate of 0.13 °C/a. In comparison, the aver‐age summer ground temperature also demonstrated a warming trend, but the rate (i.e., 0.02 °C/a) is much weaker. Therefore, the ground temperature trend also exhibits season variations.

Figure 6 Interannual variation of summer and winter mean ground temperature at the MS3608 site,the mean air temperature at the Naqu meteorological station,and the mean ground temperature at the ten observation depths.JJA indicates June,July and August,and DJF indicates December,January and February
3.3 Variation of daily minimum, maximum and mean ground temperature
It can be seen that the ground shows obvious but asymmetric warming in the winter and summer sea‐sons.The ground warming rate in winter is far greater than in summer, and the air temperature warming rate at night is also more significant than in the daytime.Due to the intermittent missing of observation data,we selected the ground temperature data at MS3608 and TTH as example sites to analyze the variation of daily maximum and minimum ground temperature for their relatively better completeness.
Figure 7 illustrates the maximum, minimum and average daily ground temperature at MS3608 and TTH. It can be seen that the ground daily maximum temperature of the two sites decreased, whereas the ground daily minimum temperature increased signifi‐cantly.As a result, the daily average ground tempera‐ture demonstrated a slight increase. Our monitoring data show that the warming of ground temperature along the Qinghai-Tibet highway in winter is greater than in summer. Similarly, ground temperature warm‐ing at night is more significant than in the daytime.
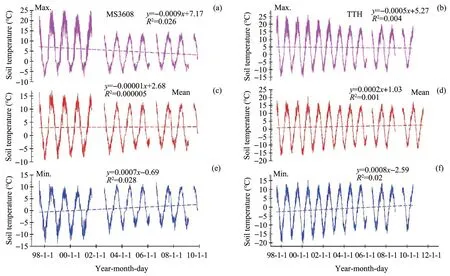
Figure 7 Interannual variation of daily maximum,minimum and mean ground temperature at 4 cm deep in the MS3608 and TTH sites
The surface soil in the Nagqu region of the north‐ern TP experiences about six months of diurnal freez‐ing and thawing cycle (Yanget al., 2007) during one year. The significant increase in ground temperature will affect the shallow soil freezing and thawing pro‐cesses. There is no doubt that the rise in ground tem‐perature will lead to permafrost degradation. For ex‐ample, the permafrost temperature in the plateau in‐creased by 0.2−0.5 °C from the 1970s to the 1990s;comparatively, the permafrost temperature along the Qinghai-Tibet highway increased by 0.5 °C from 1995 to 2002 (Zhaoet al.,2004).The observation results of ten monitoring sites on the plateau indicated that the active layer thickness has increased by about 67 cm(Wu and Zhang,2010)from 1995 to 2007.Under cli‐mate warming, simulation results indicate that the frozen soil area will continue to reduce in the next 50−100 years (Nanet al., 2005), and the permafrost degradation has an aggravating tendency, likely lead‐ing to about 46% reduction in permafrost area on the plateau by 2,100 (Guoet al., 2012). In 1980 −2001,the active layer depth increase ranged from 0.3 to 0.9 m on the northern plateau (Oelke and Zhang,2007). In comparison, during 1967−1997, seasonally frozen soil depth only decreased by 0.05 −0.22 cm,and the duration of seasonally frozen soil decreased by 20 days (Zhaoet al., 2004). More seriously, with the ground warming and permafrost degradation, the early thawing of the soil in spring will release the CO2and CH4into the atmosphere (Zhang, 2007), which has a positive feedback effect on the climate.
3.4 Air temperature and precipitation variations and their effects on extreme ground temperature
Undoubtedly, the immediate cause of ground tem‐perature warming is air temperature. However, the in‐fluence of precipitation should not be neglected.Therefore,the variations of temperature and precipita‐tion from the nearby meteorological stations along the Qinghai-Tibet highway were also analyzed. The tem‐perature on the TP has significantly increased since the mid-1950s.From 1955 to 1996,the annual temper‐ature increase rate was 0.16 °C/10a, with a winter warming rate of 0.32 °C/10a.As our analysis showed that the winter ground temperature warming rate was greater than in summer, we also analyzed the changes in the average summer(JJA)and winter(DJF)temper‐ature and precipitation from six meteorological sta‐tions from 1965 to 2013.
From 1965 to 2013, the average summer and win‐ter ground temperature in the Geermu meteorological station increased significantly (Figure 8). The warm‐ing rates in summer and winter were 0.5 °C/10a and 0.8 °C/10a, respectively. In the same period, the winter precipitation also showed a slight increase (2 mm/10a),while the summer precipitation showed a decreasing trend (2 mm/10a). During the study period, the aver‐age temperature and precipitation of the Tuotuohe me‐teorological station showed an increasing trend in sum‐mer and winter. While the temperature warming rates in summer and winter were the same (i.e.,0.3 °C/10a),the precipitation increased at 6.4 mm/10a in summer and 6 mm/10a in winter. It is necessary to point out that the Tuotuohe meteorological station recorded ex‐tremely low temperatures of −20.1 and −21.8 °C in 1985 and 1986, respectively. This is due to the rare snow in the area from September to October in 1985.Specifically, the station recorded precipitation of 56 mm and an average temperature of 2.7 °C in Sep‐tember. By October, however, the precipitation reach‐es 79 mm,and the average temperature reduced sharp‐ly to −9.8 °C, resulting in a thick snow cover during the winter. It is worth noting that the Tuotuohe station had extremely low temperatures from October 1985 to February 1986, resulting in the lowest winter mean temperatures in 1985 and 1986.

Figure 8 Interannual variation of summer and winter mean air temperature and accumulative precipitation at the Geermu,Tuotuohe,Wudaoliang,Anduo,Bange,and Naqu meteorological stations from 1965 to 2013.JJA indicates June,July and August,and DJF indicates December,January and February
From 1965 to 2013, the average temperatures in summer and winter at the six meteorological stations increased consistently at respective warming rates of 0.3 °C/10a and 0.4 °C/10a. During the same period,the precipitation in summer and winter also rose at 14.8 mm/10a and 0.6 mm/10a, respectively. Specifi‐cally, the warming rates in summer and winter were 0.2 °C/10a and 0.5 °C/10a at the Anduo meteorologi‐cal station, 0.3 °C/10a and 0.5 °C/10a at the Bange meteorological station in summer and winter, and 0.3 °C/10a and 0.8 °C/10a at the Naqu meteorological station in the southern part, respectively. Meanwhile,the precipitation in summer and winter also rose at respective rates of 2.7 mm/10a and 0.5 mm/10a at the Anduo meteorological station, 4.9 mm/10a and 0.7 mm/10a at the Bange meteorological station, and 3.9 mm/10a and 0.9 mm/10a at the Naqu meteorologi‐cal station in the southern part.
Overall, the temperature along the Qinghai-Tibet highway has increased since 1965, and the warming rate in winter is far greater than that in summer. From 1965 to 2013,the average warming rate of the six me‐teorological stations in summer was 0.4 °C/10a, and the average warming rate in winter was 0.6 °C/10a.Among them, the warming rate in the winter ground temperature was the highest in winter(i.e.,0.8 °C/10a)at the northernmost Geermu and southernmost Naqu stations, and the lowest rate occurred in the Tuotuohe(i.e., 0.3 °C/10a). In summer, the highest warming rate happened in the northernmost Geermu station(i.e., 0.5 °C/10a), and the lowest warming rate oc‐curred at the Anduo station (i.e., 0.2 °C/10a). Sum‐mer precipitation showed a slightly increasing trend.From 1965 to 2013, the average increasing trend of the six meteorological stations was 6.5 mm/10a. To sum up, under significant warming along the Qing‐hai-Tibet highway and the slight increase in precipi‐tation, the ground temperature showed a significant warming trend.
It is reported that the increase in winter tempera‐ture is the main reason for the warming of permafrost.Soil temperature has also increased significantly un‐der the climate change scenarios with a significant in‐crease in winter temperature, which will accelerate the degradation of frozen soil. Due to the complex in‐teraction between the atmosphere and land surface,the variation of near-surface temperature and precipi‐tation can significantly influence the hydrothermal re‐gime of shallow ground. In summer, the temperature and precipitation will affect the surface heat. Due to the increasing summer precipitation in the study peri‐od,the heat in the ground surface is released to the at‐mosphere through evaporation, which inhibits the warming of the shallow soil (Yang, 2003). From 1995 to 2007, the temperature of the four meteorological stations,including Wudaoliang,Fenghuoshan,Tuotuo‐he, and Anduo along the Qinghai-Tibet highway, in‐creased by 0.6−1.6 °C,which was enough to warming permafrost. Meanwhile, the increase in summer pre‐cipitation and winter snowfall had a certain mitigation effect on soil temperature (Wu and Zhang, 2008).Therefore, the increase of rainfall in summer has a certain inhibition effect on the temperature increase of the shallow ground, which may cause the shallow soil temperature to decrease slightly in case of increasing air temperature.
4 Discussions
Our results show that the ground daily minimum temperature displays a significant warming trend,while the ground daily maximum temperature only re‐veals a weak warming trend,with the temperature at a few depths even demonstrating a cooling pattern. The surface vegetation system is very sensitive to air tem‐perature and ground surface temperature. At present,the influence of the unsymmetrical temperature rise on the vegetation growth and the function of the ecosystem is not clear. A previous study suggested that the increase in daytime temperature was benefi‐cial to the vegetation growth and the carbon sink func‐tion in most cold regions, and the carbon source and sink function of the northern hemisphere ecosystem was influenced by the unsymmetrical temperature in‐crease in the day and night(Penget al.,2013).The ef‐fect of nighttime temperature rise on vegetation growth is opposite to that of daytime.
High-resolution observational data on the soil and heat transfer on the TP are very scarce, and the spatial-temporal scale of the accumulated soil tem‐perature observation data is very limited. The current analysis of interannual variation was only based on the time series of about 15 years; the results need to be verified by data of a longer time scale. In addition,it is necessary to emphasize that the coverage time and thickness of the snow on the plateau have a cru‐cial influence on the soil freezing and thawing pro‐cess and the soil temperature (Yanget al., 2008).However, in-depth discussion is prohibited by limited observation data. Also, the soil water heat exchange and circulation is a coupling process. Because of the short time series of soil moisture content, the longterm trend of soil water content could not be analyzed for the time being. Owing to the large latent heat, the freezing of soil water can release a large amount of heat, and the thawing of frozen soils requires a large amount of heat. Therefore, the soil water content will significantly affect the ground freezing and thawing process and the soil thermal condition (Yanget al.,2000;2003).
5 Conclusions
The ground temperature at all observation depths on the northern Tibetan Plateau showed a strong warm‐ing trend during the study period under warming air temperature. Ground warming was more significant in winter than in summer, and the warming rate of daily minimum ground temperature was greater than that of daily maximum ground temperature at the TTH and MS3608 sites. The ground temperature showed an ob‐vious response to the warming climate, but the re‐sponse varied significantly with depths and sites.
The "zero-curtain effect" is apparent, particularly when the ground is in the early stages of freezing at the BJ site. Unidirectional freezing and bidirectional thaw were observed over the period of study. Trends of earlier thawing, later freezing, and reductions in freezing depth and duration occurred at the BJ site.The soil freezing and thawing processes showed an obvious response to air temperature warming.
During the study period, the average temperature of the six meteorological stations near the observa‐tion sites, including the Geermu, Tuotuohe, Wudao‐liang, Anduo, Bange, and Naqu stations, showed a significant warming trend, and the temperature rise in winter was more substantial than that of in sum‐mer. Meanwhile, the precipitation in summer and winter also increased.
Under air temperature warming, observation re‐sults show significant changes in the cryosphere in the Tibetan Plateau. Permafrost degradation has caused significant environmental problems. It should be noted that the local surface subsidence induced by the changes in the ecological environment in the per‐mafrost region has increasingly threatened the stabili‐ty of engineering construction on the Tibetan Plateau.Therefore, it is imperative to carry out a systematic,long-term ground temperature monitoring program on the Tibetan Plateau to collect high temporal and spa‐tial resolution data to support in-depth analyses and model simulation.
Acknowledgments:
This study was supported by the National Natural Science Foundation of China (41771068, 41571066,41601077), the Strategic Priority Research Program of the Chinese Academy of Sciences (CAS)(XDA20100102), the Chinese Academy of Sciences(CAS) "Light of West China" Program, the Youth Innovation Promotion Association CAS (2018460),and the Program of China Scholarship Council(201804910129).
 Sciences in Cold and Arid Regions2021年4期
- Sciences in Cold and Arid Regions的其它文章
- Progress,problems and prospects of palynology in reconstructing environmental change in inland arid areas of Asia
- 10Be exposure ages of Quaternary Glaciers in Antarctica
- Application of geodetector in sensitivity analysis of reference crop evapotranspiration spatial changes in Northwest China
- Ecophysiological responses to drought stress in Populus euphratica
- The driving force of water resource stress change based on the STIRPAT model:take Zhangye City as a case study