
10Be exposure ages of Quaternary Glaciers in Antarctica
2021-10-21 09:02WangJingNiZhiGangZhangJingXueGuoXueYuanTang
WangJing Ni,ZhiGang Zhang,JingXue Guo,XueYuan Tang
1.School of Teacher Education,Nanjing Normal University,Nanjing,Jiangsu 210023,China
2.School of Geographical Sciences,Nanjing Normal University,Nanjing,Jiangsu 210023,China
3. Key Laboratory of Virtual Geographic Environment (Nanjing Normal University), Ministry of Education, Nanjing,Jiangsu 210023,China
4. Jiangsu Center for Collaborative Innovation in Geographical Information Resource Development and Application,Nanjing,Jiangsu 210023,China
5.State Key Laboratory of Cryospheric Sciences,Northwest Insititute of Eco-Environment and Resources,Chinese Academy of Sciences,Lanzhou,Gansu 730000,China
6.Polar Research Institute of China,451 Jinqiao Road,Pudong,Shanghai 200136,China
ABSTRACT In situ terrestrial cosmogenic nuclides (TCN) have been widely applied to date the ages of Quaternary glacial depos‐its in Antarctica and plays an important role in reconstructing the glacial evolution and climate change. It helps to un‐derstand the Antarctic ice sheet's evolution process in Quaternary and shed light on the application of Cosmogenic Nuclide exposure dating technique in glacial geomorphology.In this paper,we retrieved 495 10Be age samples in Ant‐arctica from literature published between 2004 and 2020 and recalculated the TCN ages using version 3.0 online cal‐culator of Cosmic-Ray Produced Nuclide Systematics on Earth (CRONUS-Earth). Several conclusions can be drawn from the results: (1) 75% of the exposure ages are younger than 400 ka, and 91% younger than 1,100 ka. Northern Antarctic Peninsula exposure result is visibly younger than the main glaciers area in East Antarctica due to climate change and geological evaluation since the LGM (Last Glacial Maximum). (2) TCN ages are relevant to the samples'relative positions in the Antarctic continent, but a relationship between their ages and elevations is yet to be deter‐mined based on the collected data.
Keywords: 10Be exposure ages;in situ terrestrial cosmogenic nuclides;Antarctica
1 Introduction
The Antarctic glaciers play a significant role in world climate change, especially in worldwide sealevel changes, oceanographic processes and global warming (Brunoet al., 1997).As it has the largest ice mass globally with the capacity to raise the sea level by up to 65 m(Finket al.,2006),even partial deglaci‐ation will lead to a destructive impact on Earth (Alt‐maieret al., 2010).Thus the reconstruction of Antarc‐tic glaciation history has become a targeted problem in polar research to forecast the future trend of glacier change.
In recent 20 years, the development of in situ ter‐restrial cosmogenic nuclides (TCN) exposure dating enable the determinations of the ages of Quaternary glacial landforms. A series of isotope Accelerator Mass Spectrometry (AMS) standards have been de‐tailed and widely applied in TCN dating methods(Nishiizumi, 2004; Nishiizumiet al., 2007). Among these methods,10Be exposure dating is one of the most successful techniques used to measure the ages of Quaternary deposits. A number of online calcula‐tors are also built to visualize, evaluate and correct the surface exposure data,such as iceTEA,CREP,and the most commonly used one, the Cosmic-Ray Pro‐duced Nuclide Systematics on Earth (CRONUSEarth). TCN is now widely applied to determine the exposure ages of glacier retreat and becomes an essen‐tial dating method. However, due to technical limits and geomorphological complexity, TCN also has some unavoidable uncertainty associated with sam‐pling and post-processing procedures and erosion rates. Furthermore, the Online cosmogenic-nuclide calculator is also continually improved in stability and accuracy from version 2.2 to version 3, resulting in differences in calculating standards (Borcherset al.,2016; Balco, 2017). Besides, most of the former re‐searches in the Antarctic area are focused on the spe‐cific isotope records. There is still a lack of compre‐hensive studies on establishing an accurate chronolo‐gy in Antarctic deglaciation and a systematic theory to link the evidence of isotope exposure ages with the polar climate change(Suganumaet al.,2014).
In this article, we re-analyze the collected10Be ex‐posure data from 2004 to 2020 using the newest ver‐sion of CRONUS-Earth (http://hess.ess.washington.edu) to unify the comparison standards. Based on the obtained results,we discuss the distribution of the gla‐cial landforms in the Antarctic region, the exposure ages, the evolution history of the paleo-glaciers, and the differences in glaciers' evolution in other regions.Furthermore, we explore the Antarctic ice sheet's evo‐lution process through a relationship between the ex‐posure ages and its corresponding altitude.
2 Study area and data collection
The study area covers almost the entire Antarctic continents,as shown in Figure 1.Based on the geolog‐ical and geomorphological differences in Antarctica and previous studies, the study area was divided into three regions: East Antarctic Ice Sheet (EAIS), West Antarctic Ice Sheet (WAIS) and Antarctic Peninsula(AP)(Ackert,2003;Andersonet al.,2020).
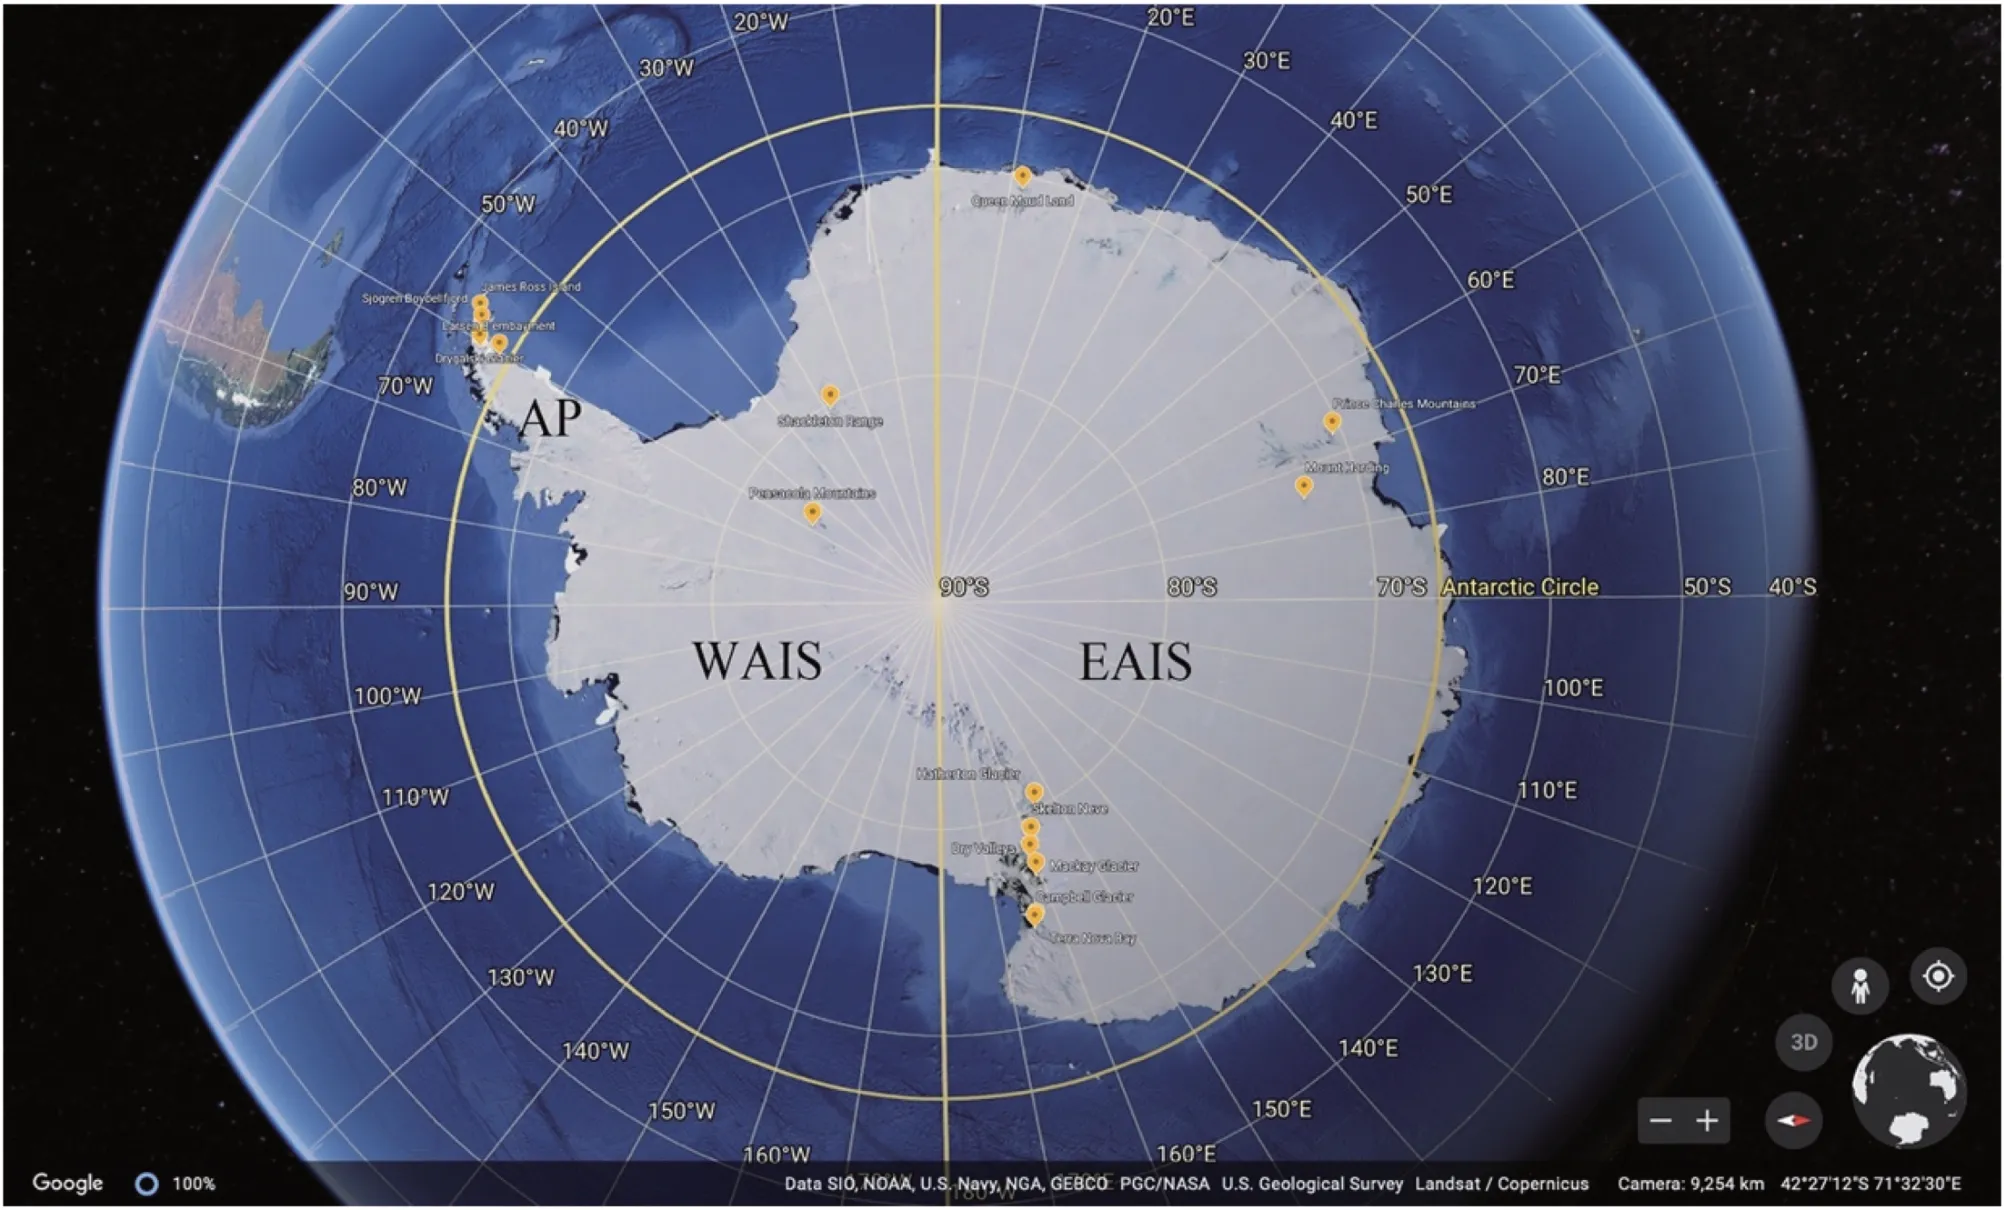
Figure 1 Oblique Google Earth image showing the location of published TCN 10Be exposure ages study sites in Antarctica
EAIS is known as the largest continental ice mass on Earth, with a volume of 21.76×10⁶to 26×106km3(Huanget al., 2008; Donget al., 2016). WAIS, locat‐ed between longitude 180° to 60°W, is the only ma‐rine-based ice sheet occupying 10% of Antarctic ice volume (Mukhopadhyayet al., 2012; Lindowet al.,2014);thus,it is relatively more vulnerable to temper‐ature fluctuation compared with EAIS. AP is worth mentioning that, based on long-term observation and research, intense climate change, ice sheet melting,rapid glacier retreat,regional warming and ice shelves collapsing have been taking place in this area.
In this article, 49510Be ages samples were collect‐ed from 18 studies published from 2004 to 2020.Among them, 282 (57.0%) is from bedrock, 180(36.4%) erratic, 18 (3.6%) small gravel, and 15(3.0%) blue-ice marine sediment core. We also ex‐tracted the relevant information about sampling lo‐cations (i.e., latitude, longitude, altitude, altitude flag, sample thickness, density, shielding correc‐tion and erosion, and measured parameters (i.e., the concentration of10Be, the uncertainty of10Be and10Be AMS standards). The sample sites extend from 54.64°S to 84.41°S and from 66.03°W to 164.30°E;the study areas(1−15)and their sources are shown in Table 1.

Table 1 Information of TCN 10Be exposure ages studies of Antarctica
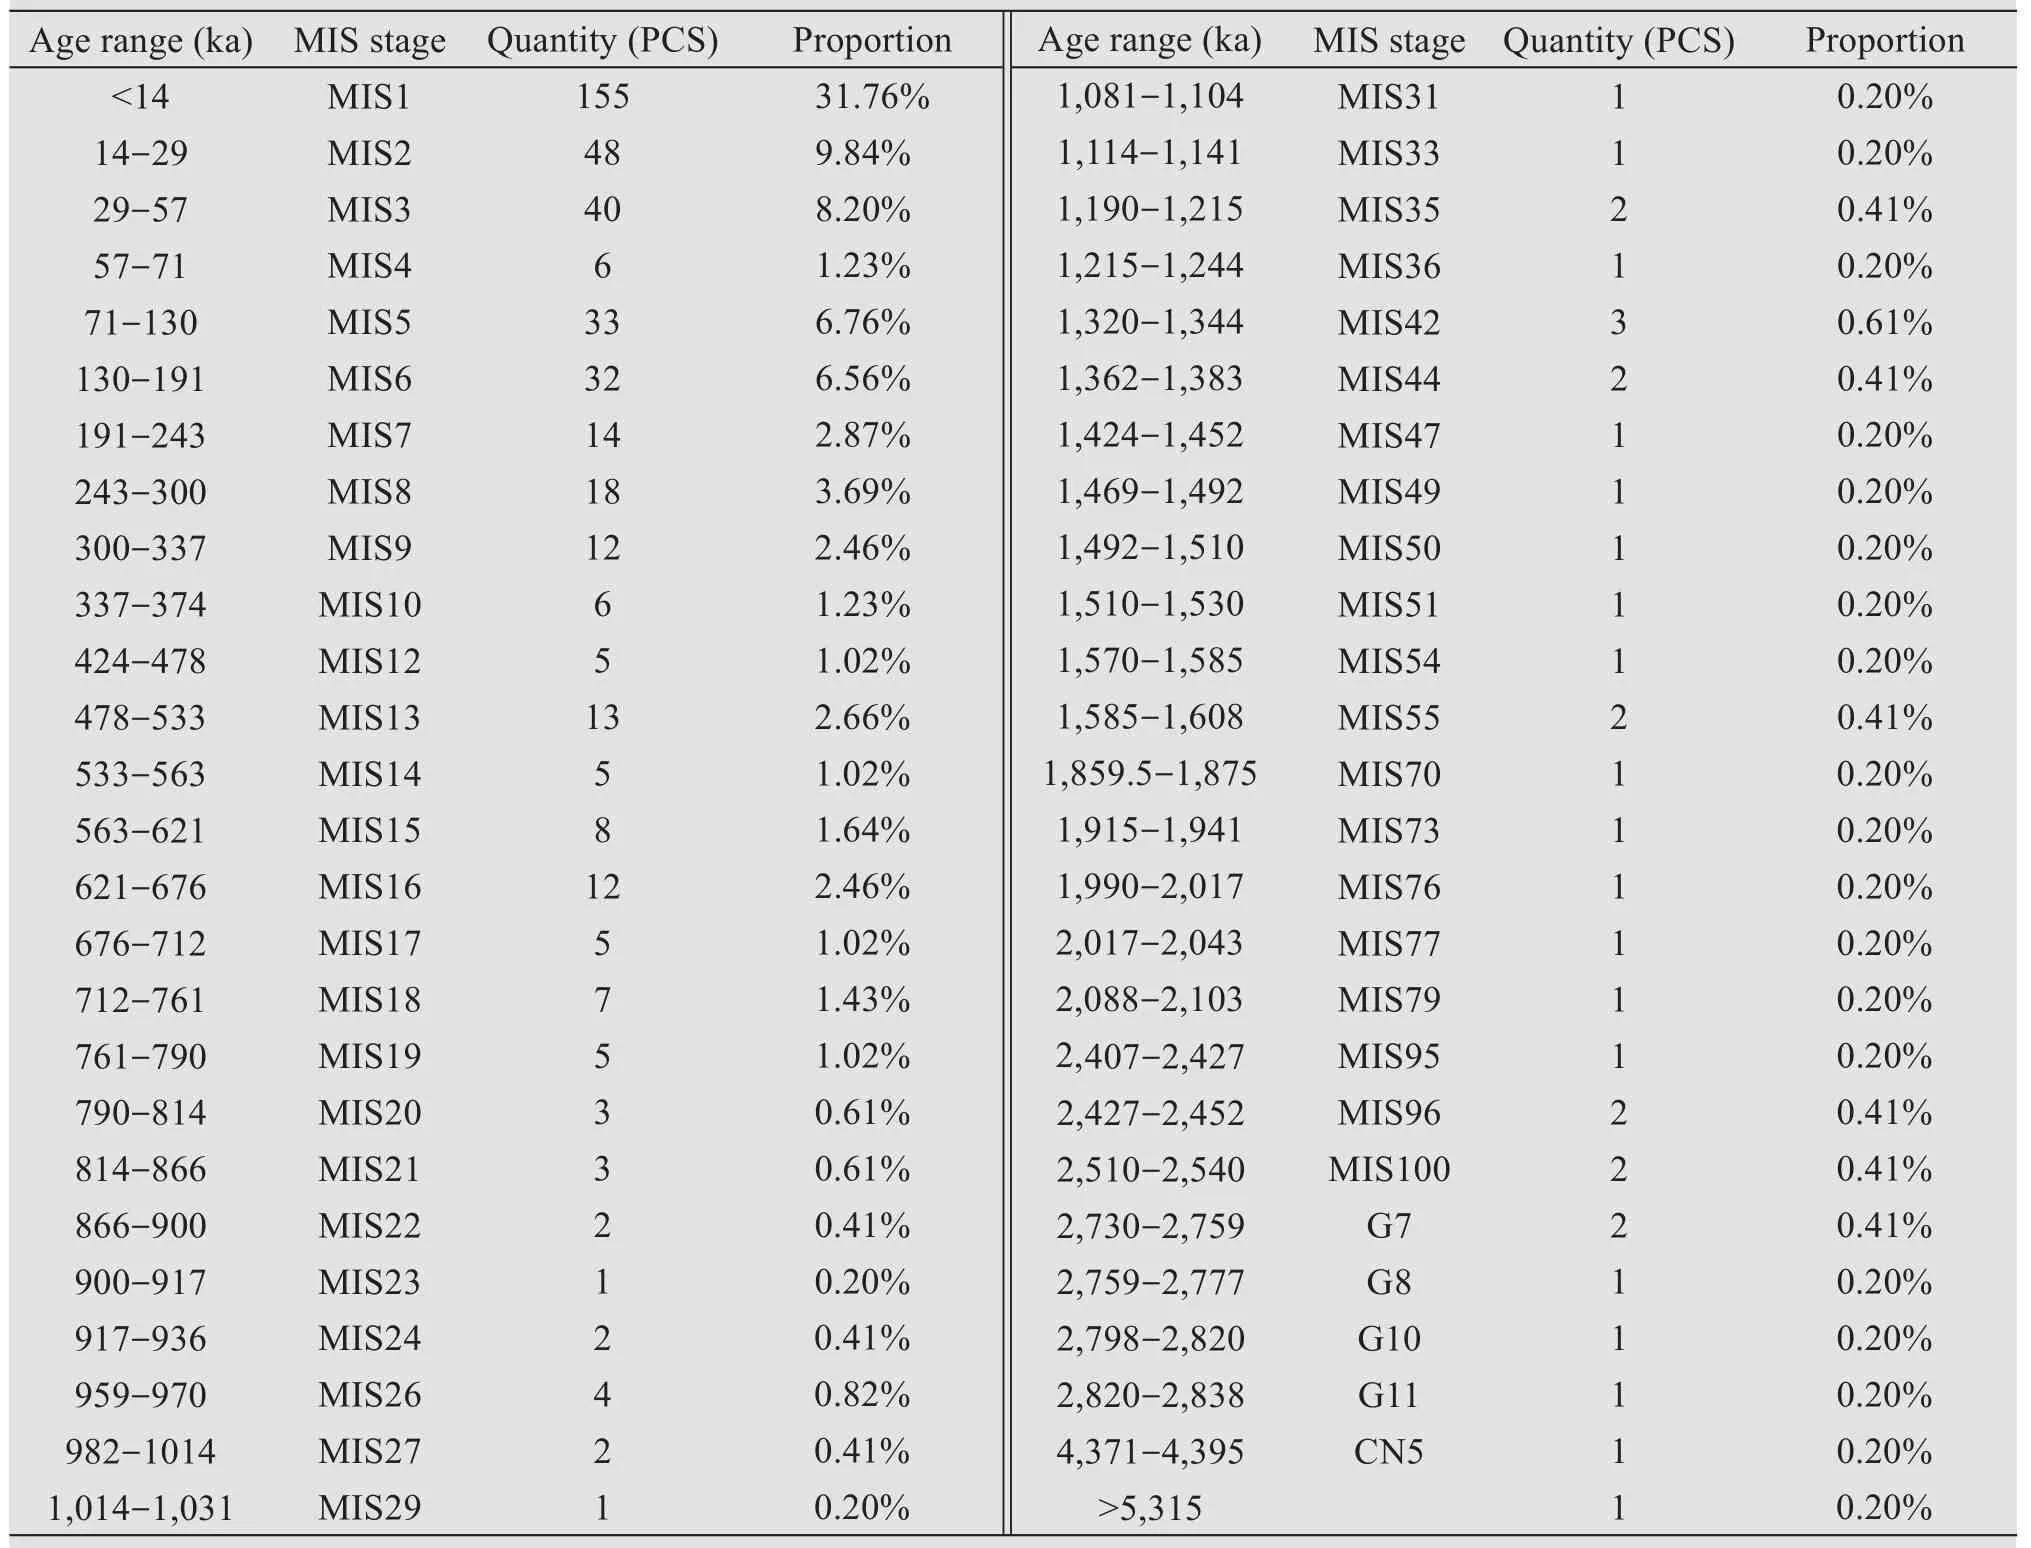
Table 2 Statistical results of TCN 10Be exposure ages in Antarctica
3 Results
3.1 Recalculated 10Be ages
The average10Be age of 495 samples is 16.6 ka.Approximately 65% of the exposure ages are less than 200 ka, 75% less than 400 ka, and 91% less than 1,100 ka. The results' distribution is not very central‐ized compared with the data set from the Tibetan Pla‐teau, where 97% of the recalculated ages are less than 200 ka(Zhanget al.,2018).Considering that the halflife of10Be is around 1.5×10⁶a, we ignored the two largest data in the following analysis (R9204(Konget al.,2010),67(Altmaieret al.,2018)),which are obvi‐ously beyond the effective range of TCN results(Nishiizumiet al.,2007).
3.2 Distribution of recalculated results
There is an apparent difference between the TCN results of central and marginal Antarctic ice sheet(Figure 2). Study regions Sjögren Boydellfjord, Dry‐galski Glacier, James Ross Island, Mackay Glacier,Campbell Glacier,Larsen B embayment are the six ar‐eas with the youngest ages in deglaciation history.The average exposure ages of these six areas are 16.6,11.4, 12.7, 9.9, 6.4 and 15.1 ka, respectively, with all maximum years under 90 ka.
To further analyze the distribution of dating re‐sults,we created a 3D scatter graph of longitudes,lati‐tudes and TCN ages in Figure 3a. Data points from adjacent areas appear to be vertical columns and their heights reflect the history of exposure ages. Higher latitudes reflect closer distances to the polar region,and longitudes reflect the bearing of the continent.From Figure 3a, Study regions Sjögren Boydellfjord,Drygalski Glacier, James Ross Island, Larsen B em‐bayment (No.3, 4, 8 and 14), which all spread in the northern Antarctic Peninsula, are obviously younger than other areas..Besides,data from 70°S to 75°S tend to be older than the polar area, as this area is located in the continental margin of the Antarctic. Also, data in East Antarctic Ice Sheet are older than the western part.
In Figure 3b, we illustrate how the exposure ages vary with the altitude. Most data points of this scatter plot are centered at 0−1,000 ka and 0−2,000 m above sea level (a.s.l.), as mentioned from former statistics.Considering the difficulty of collecting samples at high altitudes in Antarctica, this commonality can be ignored. On average, older ages (1,000−3,000 ka) ap‐pear along with higher altitudes, indicating that sam‐ples at higher altitudes have a larger possibility to be older.However,more samples are needed from the en‐tire continent to confirm this connection.

Figure 2 Comparison of TCN10Be exposure ages among different regions in Antarctica(1:Mount Harding;2:Queen Maud Land;3:Sjögren Boydellfjord;4:Drygalski Glacier;5:Dry Valleys;6:Pensacola Mountains;7:Prince Charles Mountains;8:James Ross Island;9:Terra Nova Bay;10:Shackleton Range;11:Hatherton Glacier;12:Mackay Glacier;13:Campbell Glacier;14:Larsen B embayment;15:Skelton Neve)

Figure 3 Distribution of dating results along with location and latitude.(a)Distribution of dating results based on location;(b)Distribution of dating results based on latitude
4 Discussions
4.1 Evolution sequence of ancient Antarctic glaciers based on the results of cosmogenic nuclide 10Be
The collected data are mainly concentrated in three regions,i.e., AP, EAIS and WAIS. EAIS con‐sists of some ice-free areas such as Dubris and Bibra valleys and Terra Nova Bay. Previous studies have shown that these areas witnessed at least four glacial advances and retreat since mid-Pleistocene (Joyet al., 2014). Due to the lack of field evidence and a maximum age being younger than the LGM in Ha‐therton Glacier, it can be concluded that the glacier in EAIS at the LGM was the same or maybe slightly smaller than its present scale. Another research in Queen Maud Land assumed that the successive thin‐ning of the ice shelf might be due to global cooling and less annual precipitation since the Pliocene and reverted a large-scale retreat in the relatively warmer Pliocene (Altmaieret al., 2010). Other conclusions drawn elsewhere, such as Mount Harding and Shack‐leton Range, were limited to recent glacier exposure ages and lack of more sample statistics and further analysis.
4.2 Reasons for the relatively young dating results in the northern Antarctic Peninsula
AP Ice Sheet (APIS) expanded to the continental shelf stage during Quaternary glacial stages (Bentley,1999) and experienced a fluctuation in the late Mio‐cene. The LGM glaciation's initial retreat began at around 18 ka B.P. (Davieset al., 2012) when most er‐ratic boulders were exposed in the TCN experiment.Another reason is the split of Northern Prince Gustav Ice Stream from the remaining James Ross Island,which turned the original grounded ice streams into floating ice shelf in the middle continental shelf areas of the northern Prince Gustav Channel (Nývltet al.,2014).Afterward, the latest deglaciation in the north‐ern Antarctic Peninsula began. Thus, there is a miss‐ing period of exposure ages of earlier records in the lower-lying altitudes (<60 m a.s.l.) in James Ross Island(JRI).
However, the specific start time of deglaciation in this area is not clear. The radiocarbon ages obtained for postglacial organic material is 10.6 to 13.9 ka B.P.(Czech Geological Survey, 2009; Robertset al.,2011). Data based on aquatic moss from northern JRI show the exposure age of 10.7 cal. ka B.P.. In con‐trast, data from in situ cosmogenic10Be is much younger,i.e., approximately 8−9 ka (Johnsonet al.,2011; Balco and Schaefer, 2013). Nývltet al.recali‐brated the data in 2014, taking Schmidt hammer test‐ing to assess the weathering of erratic boulders, and the eventual weighted mean is 12.9±1.2 ka.
In addition,AP is one of the places where the ice sheet melts fastest since the last century.The latest ar‐ticle regarding Larsen B embayment located in the eastern APIS suggests an unprecedented deglaciation procession from north to south (Jeonget al.,2018),as revealed in Figure 4. The TCN results in the southern area are visibly younger,as indicated by the lower po‐sition of the plotted dots,implying a north to south de‐glaciation process.
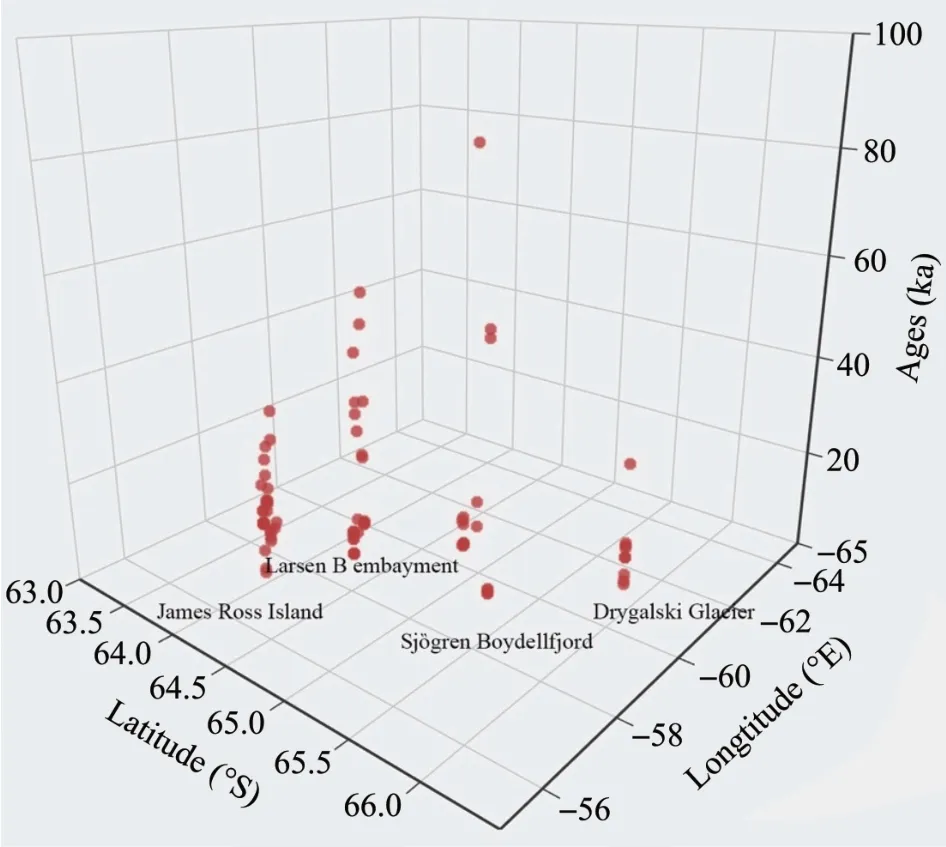
Figure 4 Distribution of dating results along with longitude and latitude in Antarctic Peninsula
Recent reported north-to-south retreat and col‐lapse of AP ice shelves also includes the Larsen A(LAIS) in 1995, the Larsen B (LBIS) in 2002, and the current thinning of Larsen C (LCIS) (Shepherdet al.,2003). Based on other published terrestrial and ma‐rine deglaciation ages, the northern AP area faces se‐vere instability in ice shelves and the potential risk of a continuously rising sea level in response not only to oceanic warming but also to local topography and ice configuration.
4.3 Relationship between exposure ages and elevations
Huanget al.(2008) studied the fluctuation history of EAIS based on the exposure ages of cosmogenic nuclides from different altitudes. The results showed that the exposure ages of cosmogenic nuclides from the two sections decreased with the decrease of alti‐tude,and the EAIS decreased by 200 m since the Mid‐dle Pliocene. Examination of the evolutionary history of the Antarctic ice sheet during the Quaternary through the exposure data of samples at different alti‐tudes did not reveal an obvious relationship. Firstly,due to the high latitude of Antarctica, elevation plays a less important role in temperature change. Many previous investigations have suggested that thinner ice sheets existed in EAIS since Plio-Pleistocene, in‐cluding higher snow lines (Finket al., 2006; Konget al., 2010). Yet, the temperature in the early Pleisto‐cene is approximately 3 °C warmer than present(Hay‐woodet al., 2013). One explanation is the poleward moisture transport due to the reorganization of South‐ern Ocean circulation(Suganumaet al.,2014).The in‐creased warm, moist air contributes to ice sheet growth, at which circumstance the effect of elevation change is minimal.
Secondly, even in the similar elevation of the same mountain, the TCN results show negative corre‐lations between the distance to the mountain and ex‐posure ages due to the changed direction of ice flow.In East Antarctica, the thickness of the ice sheet in general increases as a function of increasing eleva‐tions (Suganumaet al., 2014). The reason may be a limited sample collection area and amounts. We still can't find the potential rule of exposure ages and ele‐vations based on statistical induction of existing data.
5 Conclusions
This paper is based on the recalculated data of10Be ages in Antarctica and existing research results.The following conclusions can be drawn:
(1) 75% of the exposure ages are younger than 400 ka, 91% younger than 1,100 ka. Compared with other areas,data from the Antarctic are less centralized.
(2) The average exposure ages of the Antarctic Peninsula Ice Sheet are 14.1 ka,which is comparative‐ly younger than the mainland because of the split of the Northern Prince Gustav Ice Sheet.Recent tracking of the Antarctic Peninsula indicates an unprecedented melting rate in this area.
(3) No close correlation can be found between ex‐posure ages and elevation based on existing data.
The research on glaciation or deglaciation history of Antarctica has made significant progress due to the development of TCN and radiocarbon dating tech‐niques. However, there is still a long way to go in terms of exploring the Antarctic Land due to limita‐tions by climates and existing technical level.
Acknowledgments:
This work was supported by the National Natural Sci‐ence Foundation of China (No. 41971009 and No.41503054), the China Postdoctoral Science Founda‐tion (No. 2015M582728), and the Priority Academic Program Development of Jiangsu Higher Education Institutions(No.64320H116).
 Sciences in Cold and Arid Regions2021年4期
- Sciences in Cold and Arid Regions的其它文章
- Progress,problems and prospects of palynology in reconstructing environmental change in inland arid areas of Asia
- Ground temperature variation and its response to climate change on the northern Tibetan Plateau
- Application of geodetector in sensitivity analysis of reference crop evapotranspiration spatial changes in Northwest China
- Ecophysiological responses to drought stress in Populus euphratica
- The driving force of water resource stress change based on the STIRPAT model:take Zhangye City as a case study