
Application of geodetector in sensitivity analysis of reference crop evapotranspiration spatial changes in Northwest China
2021-10-21 09:02WenJuChengHaiYangXiSindikubwaboCelestin
WenJu Cheng,HaiYang Xi,Sindikubwabo Celestin
1.Northwest Institute of Eco-Environment and Resources,Chinese Academy of Sciences,Lanzhou,Gansu 730000,China
2.Key Laboratory of Eco-Hydrology of Inland River Basin,Chinese Academy of Sciences,Lanzhou,Gansu 730000,China
3.University of Chinese Academy of Science,Beijing 100049,China
ABSTRACT Reference crop evapotranspiration (ET0) is an important parameter in the research of farmland irrigation management,crop water demand estimation and water balance in scarce data areas,therefore,it is very important to study the factors af‐fecting the spatial variation of ET0.In this paper,the Penman-Monteith formula was used to calculate ET0 which is the de‐pendent variable of elevation (Elev), daily maximum temperature (Tmax), daily minimum temperature (Tmin), daily average temperature (Tmean), wind speed (U2), sunshine duration (SD) and relative humidity (RH). The sensitivity analysis of ET0 was performed using a Geodetector method based on spatial stratified heterogeneity. The applicability of Geodetector in sensitivity analysis of ET0 was verified by comparing it with existing research results.Results show that RH,Tmax,SD,and Tmean are the main factors affecting ET0 in Northwest China,and RH has the best explanatory power for the spatial distribu‐tion of ET0.Geodetector has a unique advantage in sensitivity analysis,because it can analyze the synergistic effect of two factors on the change of ET0.The interactive detector of Geodetector revealed that the synergistic effect of RH and Tmean on ET0 is very significant, and can explain 89% of the spatial variation of ET0. This research provides a new method for sensitivity analysis of ET0 changes.
Keywords:reference crop evapotranspiration;Penman-Monteith;geodetector;sensitivity analysis;northwest China
1 Introduction
ET0is an important parameter in studies of irriga‐tion management, crop water demand estimation and water balance in scarce data areas (Sentelhaset al.,2010; Srivastavaet al., 2014). It is also a link among the hydrologic cycle, energy budget and carbon cycle.Quantitative analysis of influencing factors ofET0is helpful to optimize water resources allocation. North‐west China is the main arid and semi-arid region, and is sensitive to climate change.Northwest China exhib‐it complex climate and significant variability, which led to the change ofET0. Therefore, it is very impor‐tant to understand the spatial variation ofET0and it's influencing factors in this area.
Numerous research has focused on the spatial and temporal changes ofET0or/and pan evaporation (Epan)in China(Wanget al.,2019)or regions such as North‐west China (Liet al., 2014), Qilian mountain (Linet al., 2018), and Loess Plateau (Liet al., 2017). Zhanget al.(2013) argued that annualET0decreased signifi‐cantly from 1960 to 1992,while increased significant‐ly from 1993 to 2011, and the vapor pressure is the most influential meteorological variable ofET0in Chi‐na. Wanget al.(2017) showed that significant annu‐al and seasonal decreasing trends from 1960 to 2013 were mostly affected by the decline of summerET0.There are similar research on the spatial and tempo‐ral distribution ofET0(Conget al., 2009; Yinet al.,2010; Renet al., 2016; Shanet al., 2016; Linet al.,2018). Many scholars used different methods to study the control factors to changes ofET0.Tradition‐al methods for analyzing influencing factors ofET0include multiple regression, correlation coefficient method, sensitivity coefficient method, geographic weighted regression (GWR) and differential equa‐tion method (Zhanget al., 2010; Liu and Zhang,2011; Hanet al., 2019; Liet al., 2019). Zhanget al.(2019)concluded thatTmaxandTminwere the main fac‐tors affecting the change ofET0in China by using the method of geographic weighted regression GWR. Thomas (2000) analyzed data from 65 meteo‐rological stations in China and concluded that SD is the main factor affectingET0, followed by RH andTmax.Liu and Zhang(2013)used the differential equa‐tion method and showed that the increase of U2and temperature led to an increase ofET0in Northwest China. Liet al.(2014) analyzed the influencing fac‐tors ofET0changes in Northwest China over the past 50 years by using the multiple linear regression method, and suggested that the increase of U2was the leading factor to the increase ofET0. Ninget al.(2016) used differential equations to solve the fac‐tors affectingET0and showed thatET0was the most sensitive to changes inTmeanand U2. Wanget al.(2019) assessed the impacts of meteorological fac‐tors onET0by calculating dimensionless sensitivity coefficients and contribution rates, and the result showed thatET0is most sensitive to RH. Liet al.(2017) analyzed the sensitivity ofET0to the varia‐tion of each climatic factor in the loess plateau of northern Shaanxi, and conclude thatET0had the highest sensitivity to RH. In the sensitivity study ofET0, the conclusions obtained by the above methods are similar, U2, RH are the main factors controlling the change ofET0. However, the above methods can only calculate the influence of a single factor onET0,and the spatial-temporal variation ofET0is often the result of the interaction of multiple factors, so it is crucial to find a method to analyze the influence of multiple factors on the spatial-temporal variation ofET0.
This study used the Penman-Monteith method rec‐ommended by the Food and Agriculture Organization of the United Nation(FAO)(Allenet al.,1998)to cal‐culateET0, and Geodetector to quantitatively analyze the sensitivity of factors affectingET0on a spatial scale. The factors considered in this research includeTmax,Tmean,Tmin, U2, RH, SD, and Elev. The interaction detector module in the Geodetector can be used to an‐alyze the explanatory power of the synergistic effect of the two factors, and is conducive to deepening the cognition of the sensitivity study on the spatio-tempo‐ral variation to draw convincing conclusions. The application of the method can also provide a refer‐ence for the sensitivity study of other natural field variables.
Geodetector software was proposed by Wanget al.(2010) and released in 2010, which was a new sta‐tistical method to detect spatial stratified heterogene‐ity and driving force of variables. Spatial stratified heterogeneity refers to the geographical phenomenon that the variance within the stratum is lower than that between strata (Wang and Xu, 2017), such as geo‐graphical partition, climatic zone, land use type, and geomorphology maps,which is one of the characteris‐tics of spatial data."Strata"is a statistical concept that roughly corresponds to classes or sub-regions. Com‐pared with traditional statistical methods, Geodetector has two major advantages:1)it can detect both contin‐uous spatial variables and type variables; 2) it can de‐tect the interaction of two factors on dependent vari‐ables (Wang and Xu, 2017). At present, Geodetector has been used in the fields of natural sciences,such as land use, geology, meteorology, plants, ecology, envi‐ronment and remote sensing(Shenet al.,2015;Zhang and Ren, 2015; Liang and Yang, 2016; Renet al.,2016; Xionget al., 2018; Chouet al., 2019; Wanget al., 2019; Yanget al., 2019). It has also been used in the fields of social sciences, such as public health, re‐gional economy, regional planning, and tourism(Wanget al., 2010; Huet al., 2011; Feiet al., 2015;Liet al., 2017; Liet al., 2019). The objectives of this study are:(i)provide new method support for sensitiv‐ity studies ofET0; (ii) study the synergistic effect of two factors onET0; (iii) find advantages of Geodetec‐tor in sensitivity analysis ofET0.
2 Study area
The northwest region of China is located in the northern and northeastern part of the Qinghai-Tibet Plateau (73°25'E−110°55'E, 31°35'N−49°15'N). It is deep in the hinterland of Eurasia and is one of the most arid regions at the same latitude in the world.The northwest region accounts for about one-third of China's area and is the main arid and semi-arid region in China. The abundant light and heat resources, dry and strong evaporation, the large temperature differ‐ence between day and night are the main climate fea‐tures. There is very low vegetation cover in most parts of Northwest China, and spatially distributed as forest-grassland-desert from east to west (Weiet al.,2014). The climate here is complex, and present strong precipitation variability and high frequent droughts. It is an ecologically fragile area and sensi‐tive to climate change.
3 Data and methods
3.1 Data
This study used surface climate data daily value dataset (V3.0) obtained from China Meteorological Data Service Center (http://data.cma.cn/). The mete‐orological parameters of 177 stations distributed in Northwest China were selected to estimate dailyET0from 2010 to 2018. The parameters selected include daily maximum temperature (Tmax), daily average temperature (Tmean), daily minimum temperature(Tmin), 10 m average wind speed (U10), average rela‐tive humidity (RH), sunshine duration (SD), and air pressure. DEM 1 km data (SRTM 1 km) comes from the Resource and Environmental Science Data Cen‐ter of the Chinese Academy of Sciences (http://www.resdc.cn/). The annual average of meteorological pa‐rameters from 2010 to 2018 are independent and tak‐en as the input variables in the Geodetector model.Meteorological data has been processed through the interpolation of missing variables and the elimina‐tion of outliers.
3.2 Methods
3.2.1 Penman-Monteith equation
ET0is calculated using the Penman-Monteith equation recommended by the Food and Agriculture Organization (Allenet al., 1998). The calculation for‐mula is as follows:
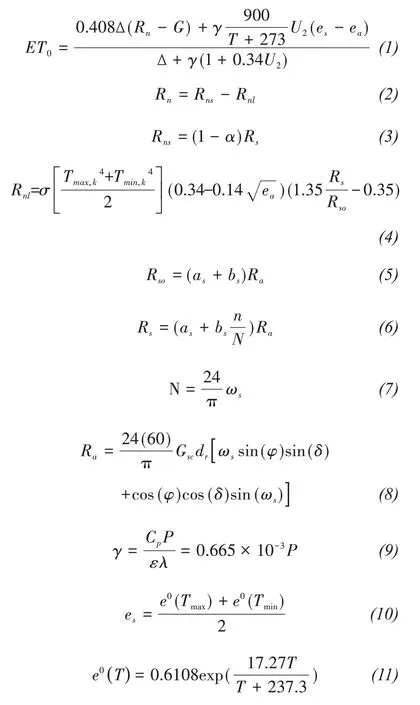
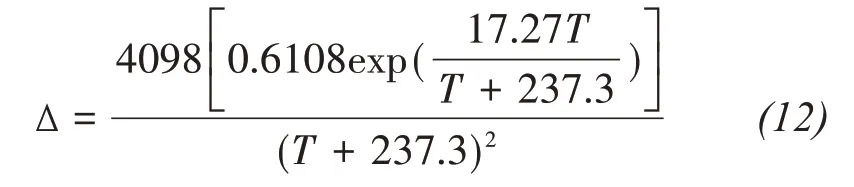
whereRnis net radiation at the canopy surface(MJ/(m2⋅d)),Gis soil heat flux (MJ/(m2⋅d)), for day period, it can be ignored and thusG≈0. T is mean daily air temperature at 2 m height (°C),U2is wind speed at 2 m height (m/s),es−eais the vapor pressure deficit (kPa) (the difference between saturated and actual vapor pressure),Δ is the slope of saturated va‐por pressure in relation to air temperature (kPa/°C),andγis the psychrometric constant (kPa/°C).Rnis a function of solar radiation, which can be estimated by the difference between net shortwave radiation(Rns) and net longwave radiation (Rnl).Rnlis calculat‐ed by Equation(4).αis the albedo,and approximate‐ly equal to 0.23.Pis atmospheric pressure (kPa).Gscis the solar constant=0.0820 MJ/(m2⋅min).dris the inverse relative distance Earth-Sun.ωsis the sunset hour angle.δis solar decimation.Rais extraterrestri‐al radiation (MJ/(m2⋅d)), calculated with Equation(8)derived from FAO 56.Rsis solar radiation,nis actual duration of sunshine(hour),andNis the maxi‐mum possible duration of sunshine or daylight hours.δis solar decimation,φis latitude,asis the re‐gression constant,expressing the fraction of extrater‐restrial radiation reaching the earth on overcast days(n=0), andas+bsis the fraction of extraterrestrial ra‐diation reaching the earth on clear sky days (n=N).Where no actual solar radiation data are available and no calibration has been carried out for improved as andbsparameters, the valuesas=0.25 andbs=0.50 are recommended. All the above equations are de‐rived from FAO 56(Allenet al.,1998).
The wind speed at 2 m height(U2)is derived from Equation(13)presented below:
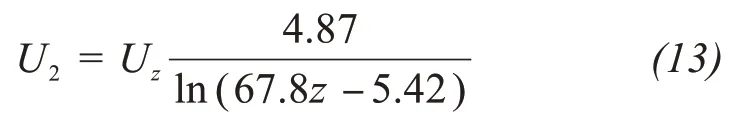
whereU2is wind speed at 2 m above the ground sur‐face (m/s).Uzis observed wind speed atzm above the ground surface (m/s).zis the height of measure‐ment above ground surface(m).
3.2.2 K-means cluster
The K-Means algorithm is a well-known partition‐ing method for clustering. K-Means clustering meth‐od, groups the data based on their closeness to each other according to the Euclidean distance. It takes da‐ta set (ky) as input parameter and partitions a set ofnobjects fromkyclusters. The mean value of the object is taken as a similarity parameter to form clusters.The cluster mean or center is formed by the random selection ofkyobject. By comparing most similarities,other objects are assigned to the cluster. For each data vector, this algorithm calculates the distance between the data vector and each cluster centroid (Aroraet al.,2016).
The data preparation stage of the Geodetector ap‐proach requires the transformation of each meteoro‐logical factor from numeric into categorical variables.k-means cluster algorithm was used to transform nu‐merical variables into categorical variables. indepen‐dent variables are divided into eight groups with dif‐ferent categories that range from 4−9. The factor and risk detector modules are used to detect the statistical significance of each group,and the statistically signifi‐cant categories results were selected.
3.2.3 Geodetector
Spatial stratified heterogeneity is one of the basic characteristics of geographical phenomena. Geodetec‐tor is a tool for detecting and exploiting spatial strati‐fied heterogeneity (http://Geodetector.org/). In this ar‐ticle, we use the following three detector modules built in Geodetector:
Factor detector:detecting the spatial stratified heterogeneity ofET0; and detecting the extent to which a meteorological variable can explain the spa‐tial stratified heterogeneity of the attributeET0. The sensitivity index value(q),is expressed as follow:
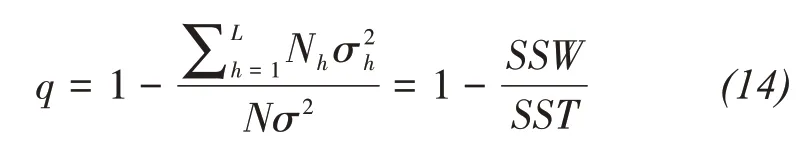
whereh=1, 2…L,Lis the strata of each meteorologi‐cal variable,NhandNare the number of sample units in stratahand the total region,respectively.andσ2are the variance in thehstrata and the variance in the region.SSWmeans the sum of the spatial variance of each strata,SSTmeans the total variance ofET0in the region,Lmeans the strata numbers of meteorological.Theqvalue lies in [0, 1]. Higher values ofqindi‐cates that the meteorologicalXfactor is more strong‐ly associated with the spatio-temporal distribution ofET0and thus could be a dominatorh(Yanget al.,2019). In extreme cases, if the spatial distribution of meteorological factorXis completely equal to the spatial distribution ofET0, theqvalue equals to 1; if the spatial distribution of meteorological variable is completely unrelated toET0, theqvalue equals to 0(Wang and Xu,2017).
Interaction detector:Identify the interaction be‐tween the different risk factorsXs,that is,whether the meteorological variablesX1 andX2 work together to increase or decrease the explanatory power of the de‐pendent variableET0, or whether the effects of these factors onET0are independent of each other. The method of evaluation first calculate theqvalues of two meteorological variablesX1 andX2 forET0:q(X1) andq(X2), respectively, and then calculate theqvalue under interaction ofq(X1∩X2), finally,q(X1),q(X2) is compared withq(X1∩X2) (Wang and Xu,2017). The types of interaction between two covari‐ates are presented in Table 1.
The symbol '∩' denotes the intersection betweenX1 andX2. Theqvalue of factors are calculated re‐spectively using Equation(14)and the results are pre‐sented in Table 1.
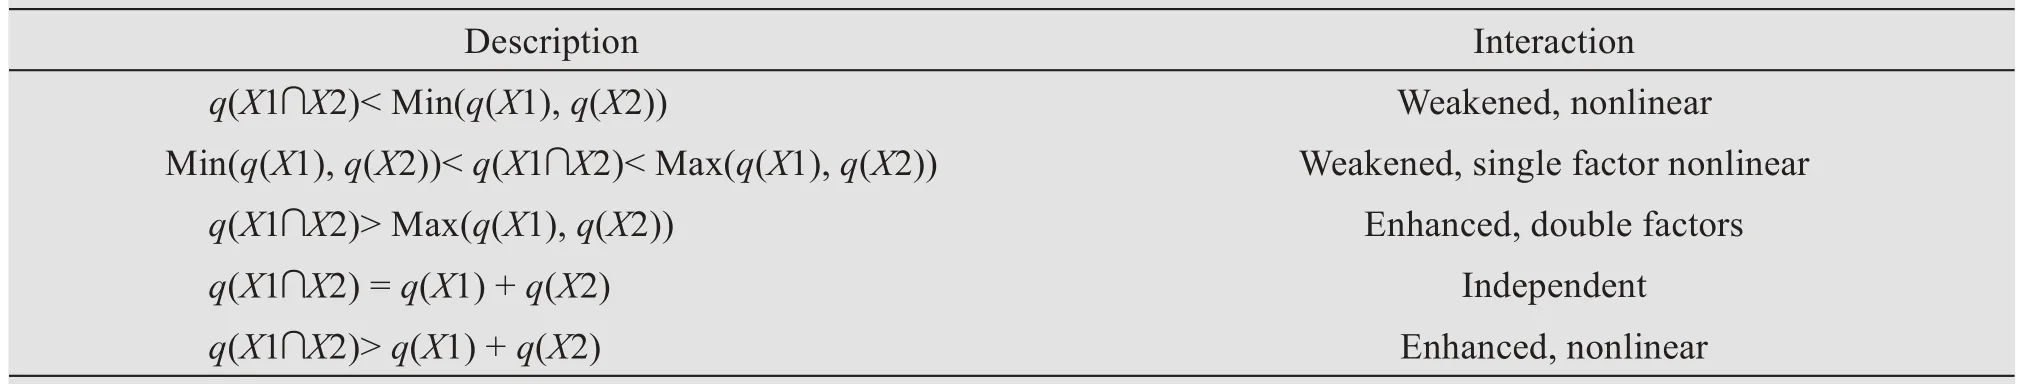
Table 1 Types of interaction between two covariates
Ecological detector:The ecological detector is based on theF-value test which compares meteoro‐logical variablesX1 andX2 and explores whetherX1 is more significant thanX2 in controlling the spa‐tial pattern ofET0. The F-value test is calculated as follows:

where:NX1andNX2represent the sample sizes of two meteorological variablesX1 andX2,SSWX1andSSWX2represent the sum of the within sum of squares of the strata formed byX1 andX2,L1 andL2 denotes the number of strata of meteorological variablesX1 andX2. Where the null hypothesisH0:SSWX1=SSWX2. IfH0 is rejected at the level of significance ofα,this in‐dicates that there is a significant difference in the ef‐fect of the two meteorological factorsX1 andX2 on the spatial distribution of the attributeET0(Wang and Xu, 2017). The data processing process is presented in Figure 2.
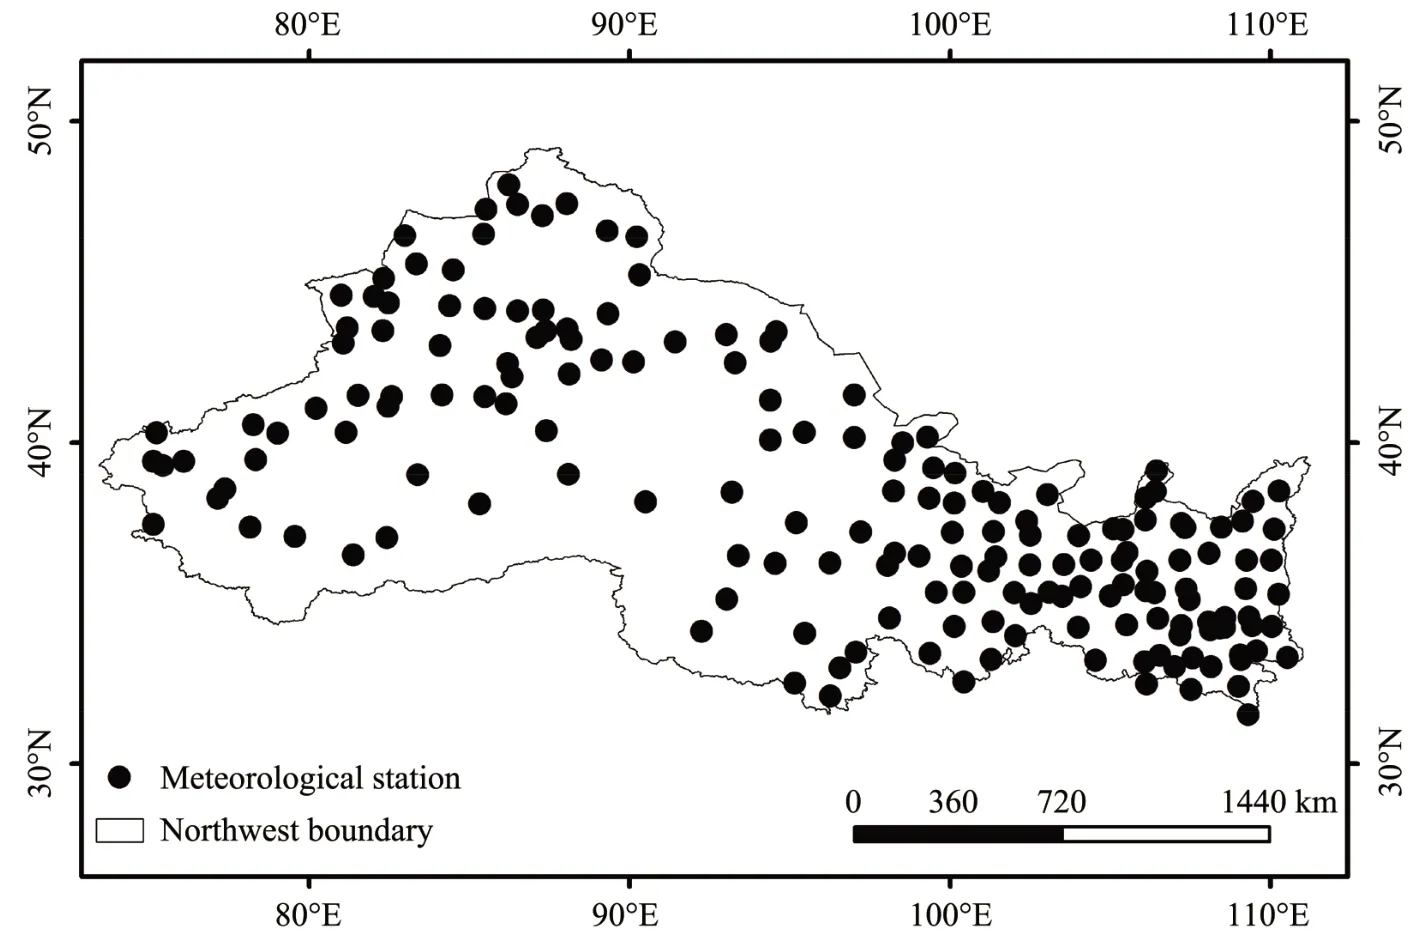
Figure 1 Spatial distribution of 177 meteorological stations and location of study area
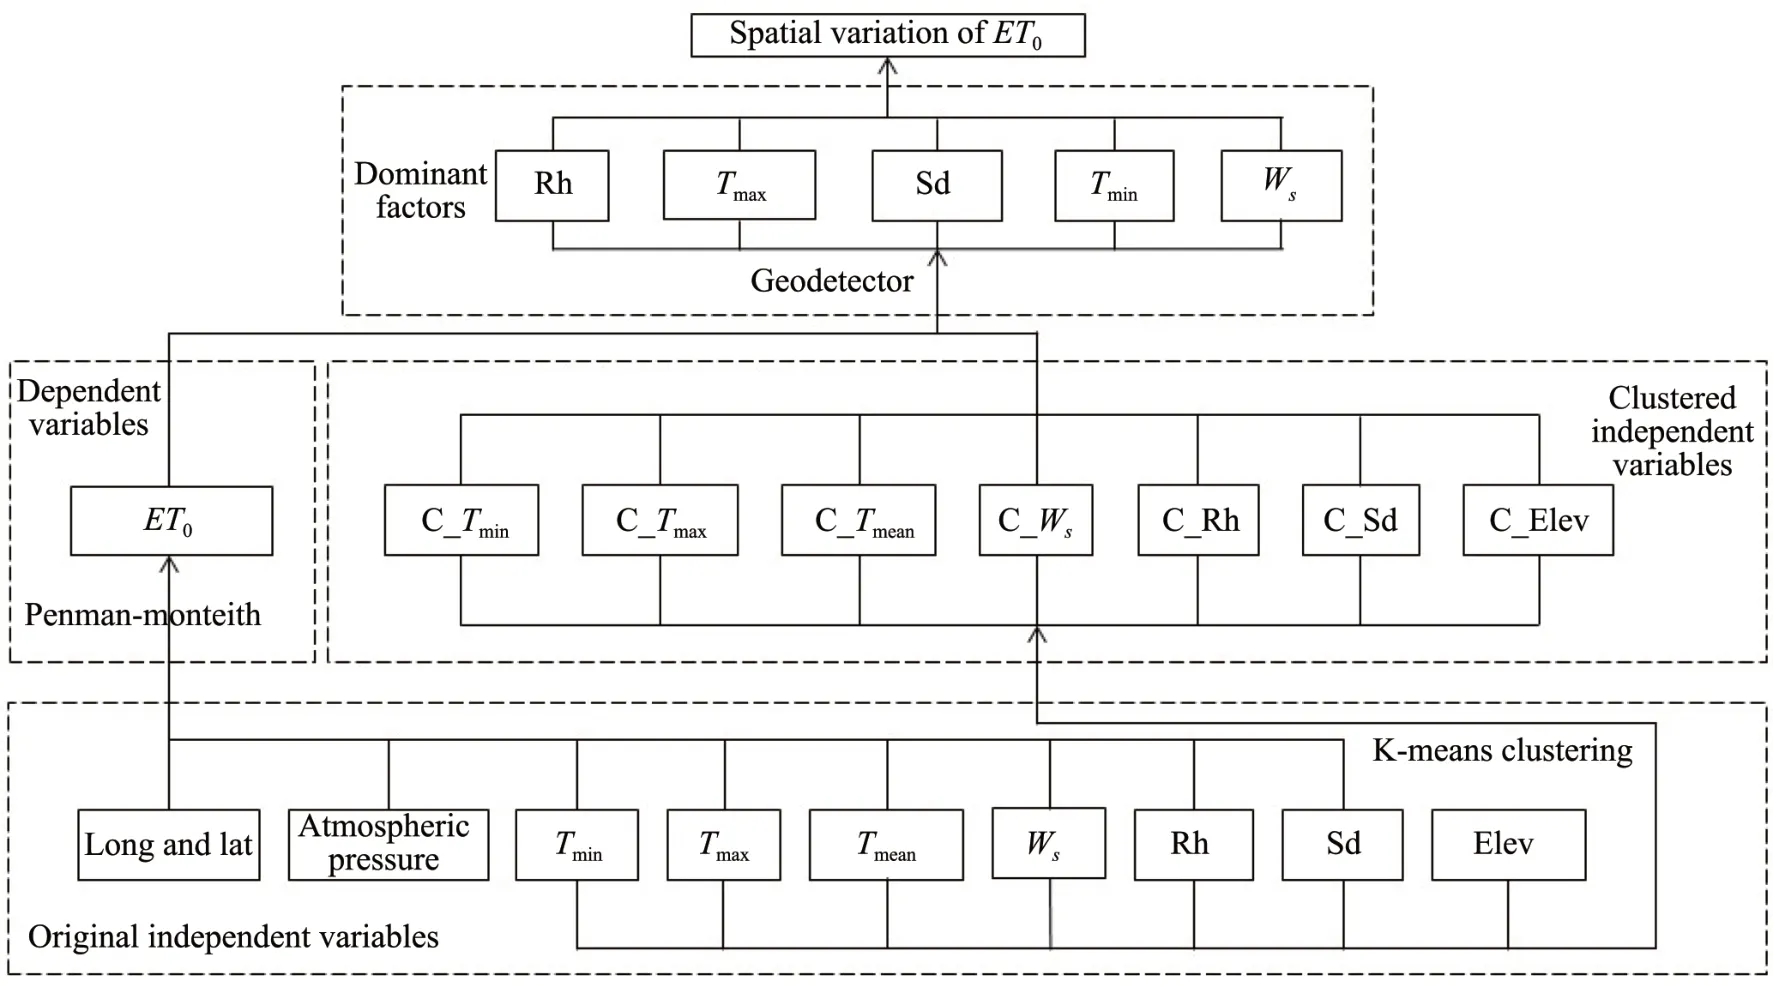
Figure 2 Flow chart of sensitivity research on ET0 spatial change
4 Results
4.1 Spatial distribution of ET0
The annualET0of 177 meteorological stations in Northwest China was calculated by the Penman-Monteith equation.As presented in Figure 3: there is obvious spatial stratified heterogeneity in the change ofET0in the study area. The range ofET0varies from 647 to 2,425 mm, most stations ofET0where under 1,300 mm,onlyET0of Turpan in Xinjiang was up to 1,620 mm, whileET0of Shisanjianfang station in Xinjiang reached 2,425 mm,which was greatly af‐fected by wind speed.In terms of spatial change:ET0in the central part of Northwest China is relatively large (1,175−1,348 mm), and gradually decreases in the east and south. The minimumET0appears in the southeast part of the study area, andET0is less than 800 mm.
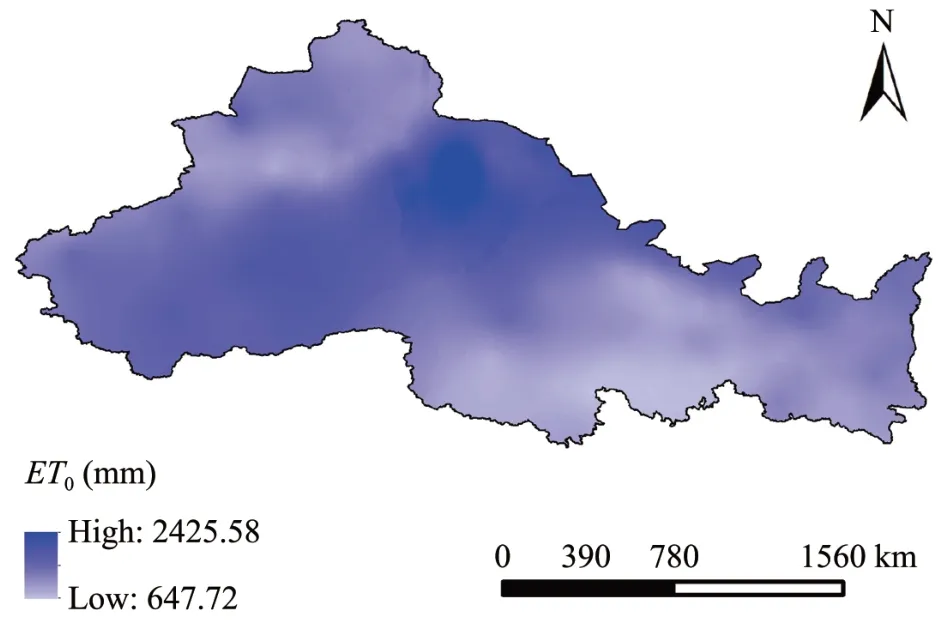
Figure 3 Difference in spatial variation of ET0
4.2 Classification results of natural factors
The classification information of each natural factor classified byk-means is presented in Figures 4a − 4h. Taking elevation as an example, the eleva‐tion is divided into eight categories, numbers 1 −8 represent different strata, 1 represents elevation <742.2 m, 2 represents 742.2−1,206.5 m, 3 represents 1,206.5−1,679.4 m,4 represents 1,679.4−2,475 m,5 represents 2,475−3,189 m,6 represents 3,189−3,719 m,7 represents 3,719−4,278 m,and 8 represents 4,278−4,216.2 m (Figure 4a). The same method divides other natural factor variables for different strata,based on thek-means cluster method, the original continuous numerical variables are divided into cat‐egorical variables. In the same way,Tmax,Tmin,Tmean,RH, SD, and U2are also divided into eight strata.As presented in Figure 4, elevations in the eastern and central parts of northwestern China are lower,and the southern part of northwest are higher (Fig‐ure 4a). The spatial distribution ofTmax,TminandTmeanare consistent, and are high in the east and low in the northwest and southeast (Figures 4b −4d).The change of SD is characterized by the low southeast and high northwest (Figure 4e). RH is low in the middle, high in the southeast and north‐west (Figure 4f). The middle part of U2is higher,and the spatial changes in other areas are not obvi‐ous(Figure 4g).
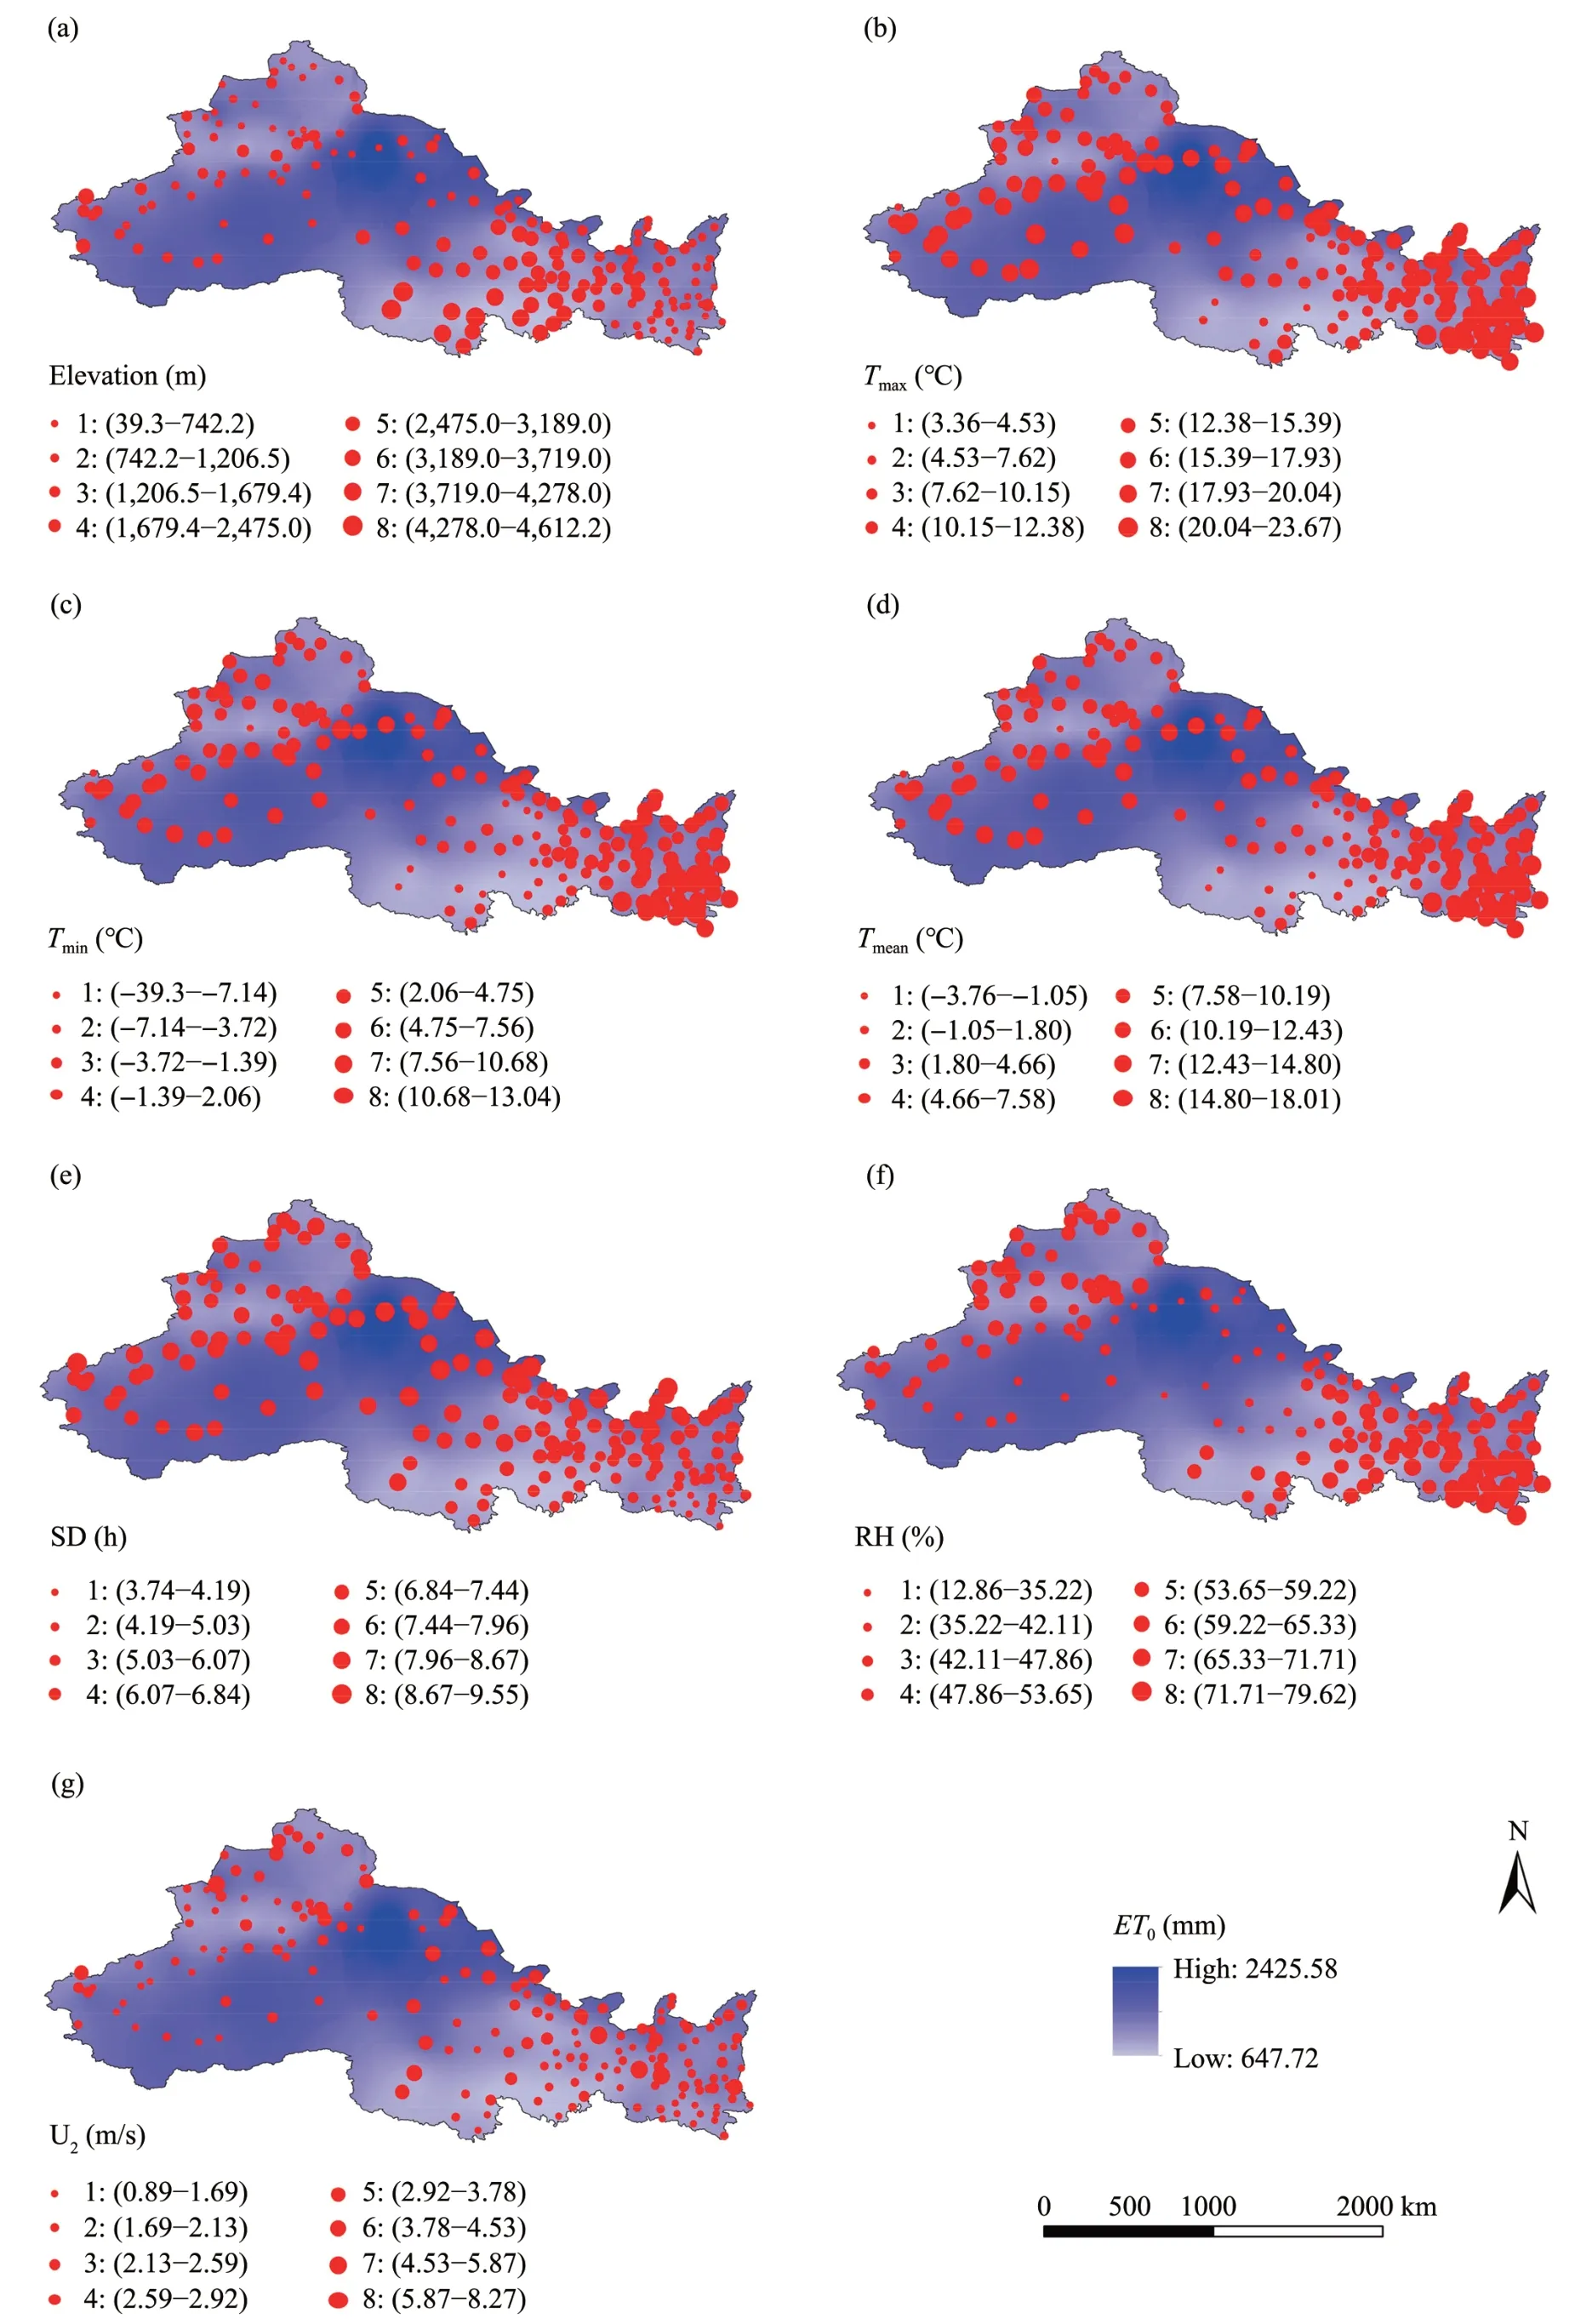
Figure 4 Strata information and spatial distribution of natural factors
4.3 Sensitivity analysis of ET0
4.3.1 Analysis of the factor detection results
Using the factor detector module of the Geode‐tector, the q value of each natural factor is detected on the spatial variation ofET0(Table 2), theqvalue of each factor toET0is as follows: RH (0.47) >Tmax(0.35)> SD (0.32)>Tmean(0.31)>U2(0.30)>Tmin(0.27)> Elev (0.26). Higher values ofqindicate that natural factor is more strongly associated with the spatio-temporal distribution ofET0and thus could be a dominator. In this research, RH is the dominator factor that influences the spatial distribu‐tion ofET0,followed byTmax,Sd,Tmean,andWs.
4.3.2 Analysis of the interactive detection results
ET0is not determined by a single factor, but by interactions of multi-factors, therefore, Geodetector is designed to perform an interaction analysis and the results can objectively and quantitatively de‐scribe the influence of natural factors onET0.The re‐sults of the interactive detection are presented in Ta‐ble 3, which shows that among the eight natural fac‐tors selected, the effect of an interaction of two fac‐tors is more significant than that of a single factor onET0. Among all the interactive factors of nonlin‐ear enhancement, the interaction of RH∩TmeantoET0results in largestqvalue, which can explain 89.3%of spatial variation ofET0. The interaction of RH∩Tminis second, and can explain 86.3% of the spatial variation ofET0. The interactions of RH∩Elev,Tmin∩SD and U2∩TmaxtoET0are all above 80%, reaching 84.3%, 82.6%, and 80.7%, respectively. The interac‐tion analysis revealed the stronger synergistic influ‐ence of RH and temperature onET0than the other factors.
4.3.3 Analysis of ecological detection results
To assess whether the influence of meteorologi‐cal factors on the spatial variation ofET0is a sig‐nificant difference, the ecological detector module of Geodetector is used for analysis. The results are classified into two categories Y and N as presented in Table 4. The Y category is reflected from the ecological detection of the RH row which indi‐cates that the influence of RH on the spatial distri‐bution ofET0is a significant difference compared with other factors. The influence of other factors on the spatial distribution ofET0is not significant difference.

Table 2 The explanatory power of each factor on the spatial change of ET0
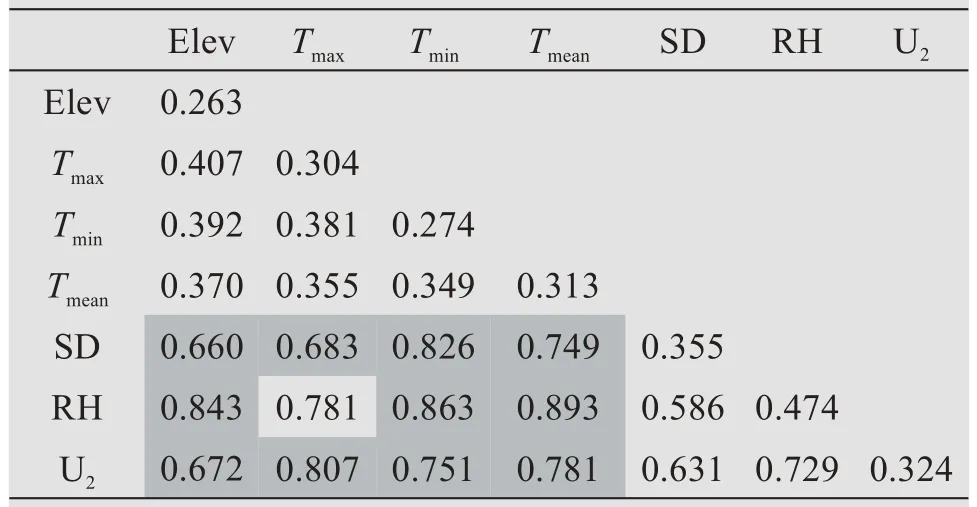
Table 3 Result of interaction detection
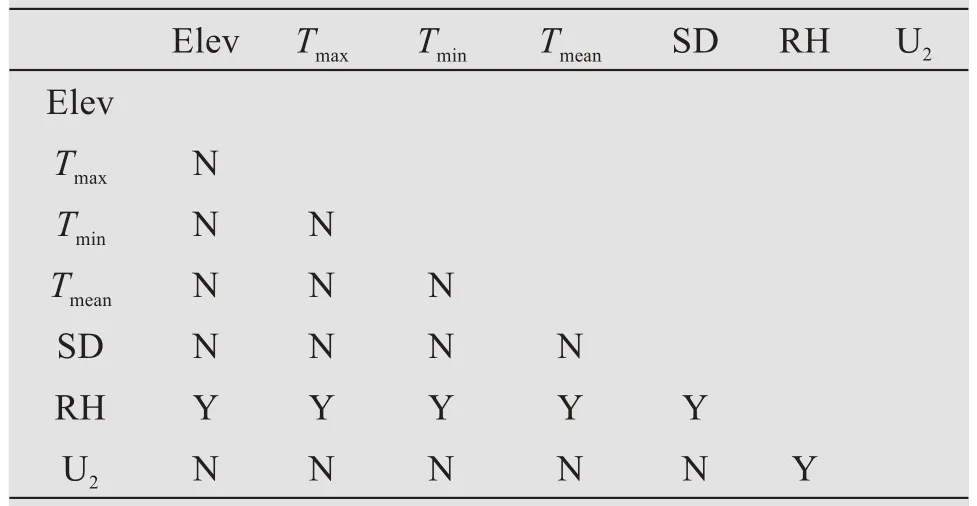
Table 4 Results of ecological detection
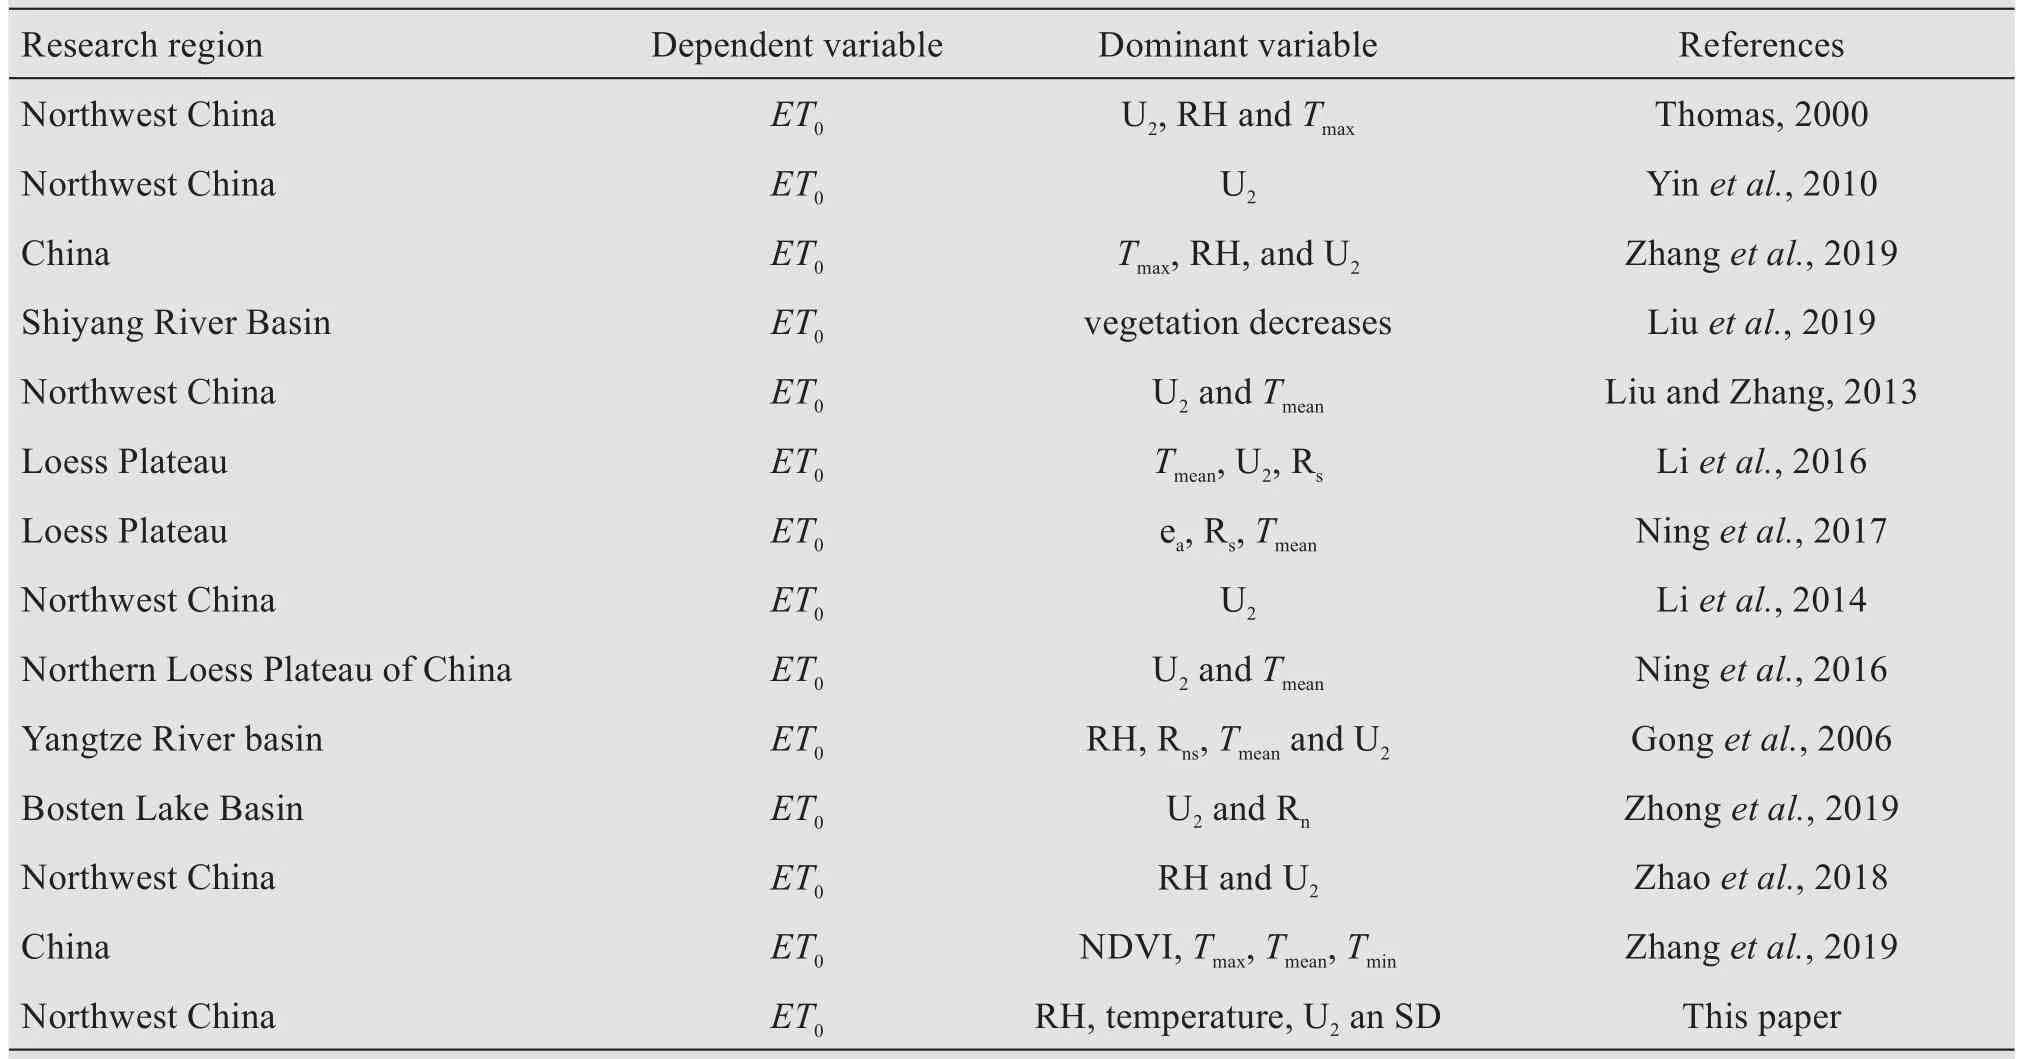
Table 5 Recent studies on factors affecting spatial and temporal changes of ET0 in Northwest China or some regions in China
5 Discussions
5.1 The suitability and advantages of Geodetector
Recent studies on the sensitivity analysis ofET0were summarized in China and Northwest China (Ta‐ble 5). The analytical methods used in previous stud‐ies mainly included the sensitivity coefficient, multi‐ple regression, differential equation, and local geo‐graphic weighted regression methods. Thomas (2000)considers U2,RH andTmaxas the main influencing fac‐tors affectingET0in Northwest China. Liu and Zhang(2013) used a differential equation method to analyze factors influencingET0, and formulated a conclusion that the increase in air temperature and wind speed to‐gether reversed theET0trend and led to an increase inET0since 1994.Liet al.(2014)used a multiple regres‐sion model to detect the relative contribution of inde‐pendent variables toET0and the result shows that U2plays an important role in changingET0in Northwest China. Zhonget al. (2019) calculated the sensitivity coefficient and contribution rate of meteorological factors toET0in Bosten Lake Basin of Northwest Chi‐na and the result shows thatRnand U2have the largest contribution rate. In other studies, it is generally be‐lieved that temperature, RH, U2and radiation were the main factors affectingET0(Gonget al., 2006; Liet al.,2016;Ninget al.,2016;Ninget al.,2017;Yanget al., 2019; Zhanget al., 2019). The results of this study shows that RH and temperature SD are the main influencing factors, and RH has the largest explanato‐ry power to the spatial distribution ofET0, which is consistent with previous research results which shows that RH and U2are the dominant factors for the change ofET0in Northwest China (Zhaoet al.,2018).However, there are other studies which ranked U2as the prominent factor ofET0in Northwest China (Yinet al.,2010;Liet al.,2014;Liet al.,2015).The simi‐larity of the results from Geodetector methods and those from different methods support the applicability of Geodetector methods to conduct the sensitivity analysis.
The advantages of Geodetector are:1)The interac‐tion detector module of the Geodetector can detect re‐al interactions, not limited to the pre-specified multi‐plicative interactions in econometrics (Wang and Xu,2017). In previous studies on sensitivity analysis ofET0changes, there was no concern about the interac‐tion of two influencing factors onET0,but in the natu‐ral sciences perspective, multi-factor interactions are ubiquitous. The aforementioned traditional methods cannot calculate the effect of multi-factor synergy.The Geodetector can calculate theq-value of singlefactor strata first, then superimposes strata of two fac‐tors, and calculate theq-value of the new polygon strata formed by the tangent of the two strata (q (X1∩X2)) (Figure 5), and obtain the explanatory power of the interaction of the two factors.In summary,Geode‐tector can calculate the impact of two-factor interac‐tion, and is more accurate and comprehensive to the sensitivity analysis. 2) The Geodetector method can simultaneously detect the effects of spatial and tempo‐ral changes onET0. The detection of the influence of natural factor changes onET0at time scale, the time series is divided into several periods, consider each period as an independent variable. 3) Theq-value ob‐tained from Geodetector method has a physical mean‐ing,and it can objectively detect the independent vari‐able, use 100×q% to interpret the dependent variable.4) The principle of the Geodetector ensures that its calculation results will not be affected by the collin‐earity of multiple independent variables.
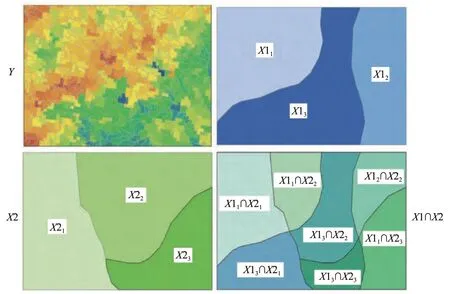
Figure 5 Schematic diagram of interaction detection(Wang and Xu,2017)
5.2 The effect of the number of classifications on the results
Because the Geodetector requires the numerical dependent variable and the categorical independent variable, it is necessary to convert the continuous nu‐merical independent variable into a categorical vari‐able by a classification algorithm, and each scheme of classification may affect the estimated results. Geode‐tector is mainly based on spatial stratified heterogene‐ity,so the classification of variables with the strongest spatial stratified heterogeneity is needed. Wang and Hu (2012) noted that different classifications had an impact on the results, and generally, the classification scheme with the largestq-value is selected. In this study,the classification scheme of 4−9 classes was de‐termined, and the factor detector module from the Geodetector was used to detect theq-values of each classification scheme.TakeTmaxas an example,the nu‐meric factorTmaxas dependent variables and categori‐cal variablesTmaxas independent variables, from 4−9 classes, theqvalues are 0.914, 0.948, 0.958, 0.971,0.975, 0.976, respectively. It was found that from class 4 to class 9, theq-value exhibited an increasing trend, and became stable from 8th to 9th classes,therefore, in this study, divided independent variables into eight classes. Under the classification of eight classes, theq-values of Elev, U2,Tmin,Tmean,Tmax, RH and SD were 0.979,0.963,0.972,0.971,0.975,0.973,and 0.978, respectively. However the classification of 4−8 classes, shows the contribution rate of U2, Elev,Tmax,Tmin,Tmean, SD, RH toET0to be 29.0%−31.0%,24.5%−27.3%,28.9%−30.4%,25.5%−28.3%,27.3%−31.8%, 30.0%−35.5% and 42.0%−47.4%, respective‐ly. Overall, the impact of different classifications on the contribution rate ofET0is less than 6%.Thus,The difference of classification will affect the contribu‐tion of independent variables, which suggests further research.
6 Conclusions
1) The main factors affecting the spatial distribu‐tion ofET0are RH, SD, temperature and U2. Among them, the contribution rate of RH toET0can reach to 47.4%, and the contribution rate ofTmax, SD,Tmeanand U2evolves between 30% and 40%.The synergistic ef‐fect of RH andTmeancontributes toET0by 89.3%,indi‐cating that the synergistic effect of RH andTmeanhas a significant impact onET0.
2) The influence of RH on the spatial distribution ofET0is significantly different from that of other fac‐tors. Combined with the results of factor detection and ecological detection, it indicates that RH is the best factor to explain the spatial variation ofET0.
3) Compared with traditional methods, the Geode‐tector can detect the synergistic influence of two fac‐tors onET0, which is more objective and convincing than the traditional single factor contribution method.Moreover, the Geodetector has no linear hypothesis,and can objectively explain the dependent variable as 100×q%from the independent variable.
4) Different classifications will have an impact on the results with a maximum error of less than 6%.The classification of the independent variables relies on the combination of theq-values obtained from the fac‐tor detector, and theqvalues are used to select the best classification scheme with strong spatial strati‐fied heterogeneity.
The meteorological data that support the findings of this study are openly available respectively in China meteorological data service center at http://data.cma.cn/data/cdcdetail/dataCode/SURF_CLI_CHN_MUL_DAY_V3.0.
The DEM data that support the findings of this study are openly available in Resource and Environmen‐tal Science Data Center of the Chinese Academy of Sci‐ences at http://www.resdc.cn/data.aspx?DATAID=123.
Acknowledgments:
This research was supported by the Inner Mongolia Key Research and Development program (zdzx2018057)and the National Key Research and Development Pro‐gram(2016YFC0400908).
 Sciences in Cold and Arid Regions2021年4期
- Sciences in Cold and Arid Regions的其它文章
- Progress,problems and prospects of palynology in reconstructing environmental change in inland arid areas of Asia
- 10Be exposure ages of Quaternary Glaciers in Antarctica
- Ground temperature variation and its response to climate change on the northern Tibetan Plateau
- Ecophysiological responses to drought stress in Populus euphratica
- The driving force of water resource stress change based on the STIRPAT model:take Zhangye City as a case study