
Quality and inventory decisions in loss-averse distribution channels considering consumer heterogeneity
2021-09-29 09:08ZhangJinxiHeHaonanWangShanyongSunQipengMaFeiMaTianshan
中国科学技术大学学报 2021年3期
Zhang Jinxi, He Haonan, Wang Shanyong, Sun Qipeng, Ma Fei, Ma Tianshan
1. College of Transportation Engineering, Chang'an University, Xi'an 710064, China;2. School of Economics and Management, Chang'an University, Xi'an 710064, China;3. School of Public Affairs, University of Science and Technology of China, Hefei 230026, China
Abstract: In this paper, we examine firms’ quality and inventory decisions with consumers who behave heterogeneously not only on the product’s valuation (horizontal) but also on the reference price setting (vertical). Through a three-stage Stackelberg leader-follower model, we derive cost-effective solutions for channel members in two distribution scenarios. Counter-intuitively, the analytical result illustrates that profit-maximizing inventory and quality decisions can be higher when the uncertainty of the market increases because the two-dimensional impacts of market uncertainty on demand are diametrically opposite to each other. Specifically, the vertical uncertainty (difference in reference effects) has a buffering effect on the aggregate market demand, which is further amplified by loss-aversion behaviors. However, the horizontal uncertainty (heterogeneity of consumer valuation) has a promoting effect on the market demand and induces firms to order more. The numerical result further shows that market demand may not inherit the behavioral bias of individual consumers, leading to an inconsistent relationship between the sensitivity of market demand to gain/loss and consumers’ loss-aversion behaviors. Our findings have implications not only for understanding the stochastic market demand with behaviorally biased consumers but also for determining the channel members’ optimal inventory and quality decisions.
Keywords: aggregate market demand;loss-averse market;product quality and inventory;newsvendor model;distribution channel
1 Introduction
Does market demand uncertainty induce firms’ decisions to reduce inventory? The answer seems to be clear as overstocking may pinch the cash flow and make doing business much more difficult. For example, the unprecedented public health challenge created by the coronavirus disease of 2019 (COVID-19) caused an incredible fluctuation in demand for oil futures. The price of the United States (US) benchmark crude that was to be delivered in May 2020 collapsed from $15 per barrel to $-40 in one day because of the most prominent supply-demand disparity in history. By contrast, irrational panic buying consumers are widely accepted as a stable source of market demand, which fosters stockpiling. Cleanera, an exporter of purification supplies in China, multiplied its face mask inventory as a COVID-19 response just before the U.S. government tightened its rules. Although it is not hard to derive the expected profit-maximizing solution, firms are generally characterized by a lack of incentive to align with the economically profit-maximizing inventory. This general rule about the negative relationship between market uncertainty and manager’s inventory decision is commonly recognized as “loss-averse” behavior, which is in line with extensive empirical studies and anecdotal evidence[1-4].
However, the effect of market demand uncertainty on inventory decisions is theoretically controversial due to the ambiguity in the definition of demand uncertainty. Most seminal inventory management studies capture market demand uncertainty as exogenous by assuming it follows a deterministic distribution[5-7]. However, firms’ inventory decisions under endogenous demands is a fast emerging literature, in which, the consumer heterogeneity in 2 product evaluation is widely analyzed in terms of quality evaluation[8,9], price expectation[10,11], functional needs[12,13], or transaction costs[14,15]. Consumer evaluations for a product in these studies contain not only the economic surplus but also a psychological surplus. The latter captures the difference between the product’s price and the consumer’s expectation. It measures how much benefit consumers perceive during purchase and could differ remarkably among consumers. Despite the importance, consumer-level behavioral bias has received little attention in these studies. One potential reason is that the input to a firm’s decision model is usually the general description of the market demand. As a result, it is always intuitively assumed that the market demand consists of “loss-neutral” consumers who are equivalently responsive to losses and gains[10,16]. However Ref.[17] argued that this approach is misguided, that is, the overall market demand may not always inherit consumer-level behavioral bias. Therefore, in this paper, we attempt to take a fresh look at the impact of consumers’loss preferences on overall market demand’s loss preferences, which will lead to different conclusions about newsvendor decisions.
Consider a case where a manufacturer sells one product through a retailer to “loss-averse” consumers versus a case where consumers are “loss-neutral”. Intuitively, on the one hand, “loss-averse” behavior causes consumers to perceive more pain of dissatisfaction when retail prices exceed their expectations than satisfaction when prices are lower than their expectations.This asymmetry increases the discrepancy of consumers’ evaluation, and thus, enhances market uncertainty, which negatively affects the market demand[18]. Consequently, keeping other conditions unchanged, the manufacturer and retailer in the “loss-averse” setting would have more incentive to lower the quality as well as the inventory level than in the neutral case. On the other hand, the market demand in the “loss-averse” setting is more sensitive to losses than to gains, which means that the marginal impact of a unit reduction in product quality on the market demand could be more significant than the impact of a unit increment. The loss of market demand caused by the reduction in quality could be more significant than in the “loss-neutral” setting. Based on this, the manufacturer may have more incentives to increase the quality, and the retailer may order more to cope with the demand growth fostered by high quality. Thus, the impact of demand uncertainty on a firm’s decisions in a distribution channel, which is the fundamental focus of our paper, is theoretically not straightforward.
To bridge the gap between individual behavioral biases and a firm’s optimal decisions, we consider heterogeneous consumers and divide the demand uncertainty into horizontal and vertical dimensions to examine market demand uncertainty generated by consumers’ behavioral bias. The impacts of consumer behavioral bias on the quality and inventory decisions are of interest to many parties. For example, consumers may worry about the fate of their ideal products in terms of quality after the channel becomes decentralized. Meanwhile, manufacturers and retailers may consider adjusting product quality and order quantity according to consumers’ status under risks. Thus, we strive to understand the impact of consumer behavioral bias on the firm’s optimal decisions in a decentralized distribution channel. The goal of this paper is to answer the following questions: What are the firms’ optimal decisions when the market consists of “loss-averse” heterogeneous consumers, and what are the key drivers of the difference in the decision of channel members when taking consumer behavioral biases into account.
The remainder of the paper is organized as follows. Section 2 provides a brief review of the related literature. Section 3 presents a baseline decision model in a distribution channel to explain how a manufacturer and a retailer make optimal decisions when considering the distribution of the consumer’s reference points and the behavioral bias. In Section 4, we extend the model to incorporate more commonly applied distribution and illustrate the result. Section 5 concludes with the findings as well as the limitations and discusses potential directions for future studies. All proofs and technical derivations are presented in the Appendix.
2 Literature review
The goal of this study is to identify and explore critical drivers underlying the effects of consumer behavioral bias on various optimal decisions in a distribution channel. Three streams of literature are related to our paper. The first stream involves market demand and newsvendor decisions. The second includes product evaluation and reference price, and the third comprises consumer behavioral bias.
2.1 Market demand and newsvendor decisions
Firms in many industries have to make a series of decisions before the selling season arrives. It takes a significantly long time for product design, manufacture, transport, and to decide aspects such as product quality, selling price, and production quantity. All these problems must be solved before the actual demand is generated, while any subsequent adjustment cannot be allowed. As a fundamental method to capture these situations, newsvendor decisions have been widely studied in the operation management literature[2,3,19]. In such situations, a firm decides the product quality, the price to be charged, and the quantity to be produced, without knowing about the market demand. The main principle of this decision is to balance the costs and benefits of overstocking while meeting expected market demand to the extent possible.Conventional wisdom indicates that a pre-determined exogenous market demand uncertainty hampers both inventory and quality decisions[18,20-22]. Although a few studies assume market demand to be endogenous, this consensus seems still exists[23,24], unless specific assumptions on the consumer demand are made[4,14]. Ref.[14] studied the effect of distribution channels and consumer heterogeneity on quality and demonstrated that a longer channel might improve the product quality. However, the consumer heterogeneity that they considered mainly focused on transaction costs; besides, unlike this study, they did not consider consumer behavior biases or discuss the impact of demand uncertainty on quality. Ref.[4] presented an elasticity function to capture the substitutability relationship between quality and inventory, and showed that quality always decreases with demand uncertainty while inventory can be U-shaped. However, they considered the manufacturer as a dominator in the channel, who can choose to sell directly or indirectly. As a result, in their setting, the retailer may decrease the inventory as a response to lower the unsold cost when the quality and wholesale price increase simultaneously. However, in line with Ref.[25], this paper considers a retailer-dominated channel, in which the retailer may order less when the manufacturer decides to lower product quality. Contrary to the previous literature, we show that the demand uncertainty leads to a higher inventory level as well as product quality, even under a traditional distribution channel. This is because the increase in consumers’ aversion to loss not only reduces the expected value of the market demand but also changes the market reaction to the firm’s various pricing strategies.
2.2 Product evaluation and reference price
Traditional economic models of the firm’s decisions consider product prices as the only variable related to rational consumers. In contrast, there is an increasingly growing amount of pricing literature taking the mental surplus into account to thoroughly understand various irrational purchase behaviors[26-28]. The focus of those models is to incorporate a reference price effect on the economic model to determine the total surplus consumer perceived while purchasing a product. In particular, different reference prices may lead consumers who are not prepared to buy under the classic model to buy the product instead, which is commonly recognized as the reference price effect. Numerous researches further discussed its formation process and identified the critical influencing factors. For example, Ref.[29] indicated that a pricing strategy based on consumers’ reference price effects could sufficiently improve a firm’s profitability. Refs.[30,31] indicated the different impacts of price contexts, historical prices, and benchmarking prices on the formation of consumers’ reference prices. Ref.[32] showed the significant impact of the reference price effect on the supply chain advertising decisions.
Although the reference effect plays a critical role in consumers’ product evaluations, its impacts on the market demand, as well as the newsvendor decisions, have not been determined. Ref.[33] first integrates the reference price into a one-period newsvendor model, in which the demand is linear in both price and the reference price. This linearity implies the loss neutrality and is also proposed in the multi-period joint pricing and inventory control models in Refs.[34,35]. Furthermore, using the average demand as a decision variable, Ref.[36] showed the superiority of the state-dependent order-up-to policy when the demand function is concave. Ref.[37] further considered the reactions of loss-averse consumers to the reference price and proposed a more complicated joint inventory and pricing algorithm. The results showed that the optimal steady-state price might decrease in the presence of reference effects, where the base-inventory could be higher. However, the research framework and decision variables in our paper are very different from these works. First, only a few articles have incorporated reference effects into inventory or quality models. Even Refs.[36,37] studied a joint inventory and pricing optimization problems, they typically ignored the quality decisions. However, this paper considers the reference effect on a distribution channel framework, where a retailer and a manufacturer decide various substantial factors such as ordering quantity and product quality.Second, to our best knowledge, except for the exogenous noises captured in reference price formation in Ref.[11], most inventory optimization models failed to consider consumer heterogeneity on the reference price. In contrast, our research is characterized by an aggregated market demand function which counts potential buyers with high reference surpluses. Third, a loss-averse variable given to heterogeneous consumers enables us to capture the consumer behavioral bias, as well as various reactions of the market demand relative to different reference prices.
2.3 Consumer behavioral bias
The perception of gains and losses is asymmetric. Generally, losses loom larger than gains, which is widely confirmed as loss-aversion. This bias has been successfully introduced to the principle of economic decision by Refs.[38,39] as prospect theory. Behavioral economics further studies realistic decision-making, which is not always consistent with the neoclassical paradigm predictions. However, as the downstream behavioral bias (of an individual consumer) seems to be not as important as the upstream bias(of the firm’s decision-maker), the newsvendor decisions literature typically ignores the in-depth description of the formation of market demand. Consequently, a series of behavioral-based economic models considered an exogenous market demand and provided abundant evidence that upstream managers’ decisions are often systematically biased[3,16,40].
However, the effect of loss-aversion at the downstream level on a firm’s decisions is still frustratingly mixed.Conventional wisdom concludes that the loss preference of the overall market demand should be consistent with the loss preference of each homogeneous consumer in the market[8-10,16]. However, some studies such as Refs.[41-43] have reported that individual loss-averse behavior hardly affects the overall market response if consumer heterogeneity is analyzed. Further research by Ref.[17] suggests that loss preference differs at the individual level from the aggregate level. In other words, when all individuals in the market are loss averse, the aggregate market demand does not necessarily exhibit loss aversion. This paper’s central focus is to investigate various newsvendor decisions in the presence of the loss-averse behavior of consumers. Our contribution to the extant literature can be divided into two parts. First, we analyze individual consumers’ purchase decisions to endogenize the market demand. Specifically, a consumer’s evaluation of a product includes an economic surplus and a mental surplus. The latter captures how consumers mentally perceive the benefit derived from the transaction. By considering consumers’ behavioral bias, we can describe individual evaluations in more detail and derive market demand more accurately. Second, it is the behavioral bias that amplifies the reference effect[44]. If non-linearity in the product valuation triggered by the loss-aversion behavior is absent, then the market demand and upstream decisions are less affected by the reference price at the individual level.
3 Model development
In this paper, we consider a monopoly in which a manufacturer produces a seasonal commodity for sale to consumers through a retailer. The product produced has a relatively short shelf-life. Thus, the retailer can only place one order to the manufacturer ahead of the selling season and has no opportunity for further replenishment. The retailer then sells the product during the shelf-life until either the inventory is depleted or the market demand has been exhausted. It is assumed that the leftover inventory has zero salvage value, while the unmet demand is lost and cannot be carried to the subsequent period. Besides, consumers in the market are not only heterogeneous about the estimation of the product’s worth but also the transaction’s assessment. In particular, an individual consumer’s valuation for the product isv. LetF(·) denote the cumulative distribution function for valuations in the market, which is continuously differentiable on its support. Both the retailer and the manufacturer know that the market valuations are continuously distributed over an interval with a density functionf(·). A heavy left tail of the function implies that a considerable share of consumers has written the product off. They are typically price-sensitive consumers, and thus, tend to have low valuations about product quality. By contrast, a heavy right tail implies that consumers with high valuations make up the majority of the market, that is, most consumers are quality-sensitive instead.
In line with Ref.[45], in this paper, we consider a consumer’s utility that depends not only on the economic surplus but also on a mental surplus related to the different reference prices. The former determines the economic benefit buyers derive from the purchase, which is denoted asv-p. The latter captures how buyers feel about the transaction. Based on their past shopping experiences, consumers would form a reference price about the product in advance, that is, an expectation of the selling price. It provides a benchmark against the actual gain/loss surplus, which describes the psychological response. We define the second item as the differencex=r-pbetween the price,p, and the reference price,r. Ref.[38] proposed that similar to the characteristics of many sensory and perceptual dimensions, the psychological response is a concave function of physical change. Thus, we can use a general value function to describe the consumers’ psychological responses.
(1)
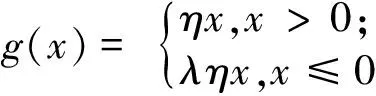
Consumers feel a “loss” about their transactions when the selling price exceeds their psychological reference prices (x<0), whereas they obtain a “gain” whenx>0. Meanwhile,ηcaptures the strength of reference effects andλis the coefficient of “loss-aversion” behaviors. In particular,λ>1 indicates that a consumer is loss-averse, which means he or she is more sensitive to losses than gains in transactions. Moreover,λ=1 indicates gain/loss-neutral, whileλ<1 implies gain-seeking, which means he or she tends to underestimate the loss and does not feel terrible when the quality is not up to his or her expectation. This parameter could have a magnifying effect on the reference effect, leading to the non-linearity of the psychological surplus over the entire domain. Consequently, by integrating the psychological utility as in Eq.(1) into the traditional utility function, an individual’s overall utility perceived from the purchase can be written asu(x,p)=v-p+g(x). Moreover, consumers are heterogeneous in product valuationsvand the transaction happens only ifu(x,p)≥0, in other words,v≥p-g(x). Above all, based on the distribution function ofv, a standardized aggregate market demandD(x,p) can be derived as
D(x,p)=Pr(v≥p-g(x))=1-F(p-g(x))
(2)
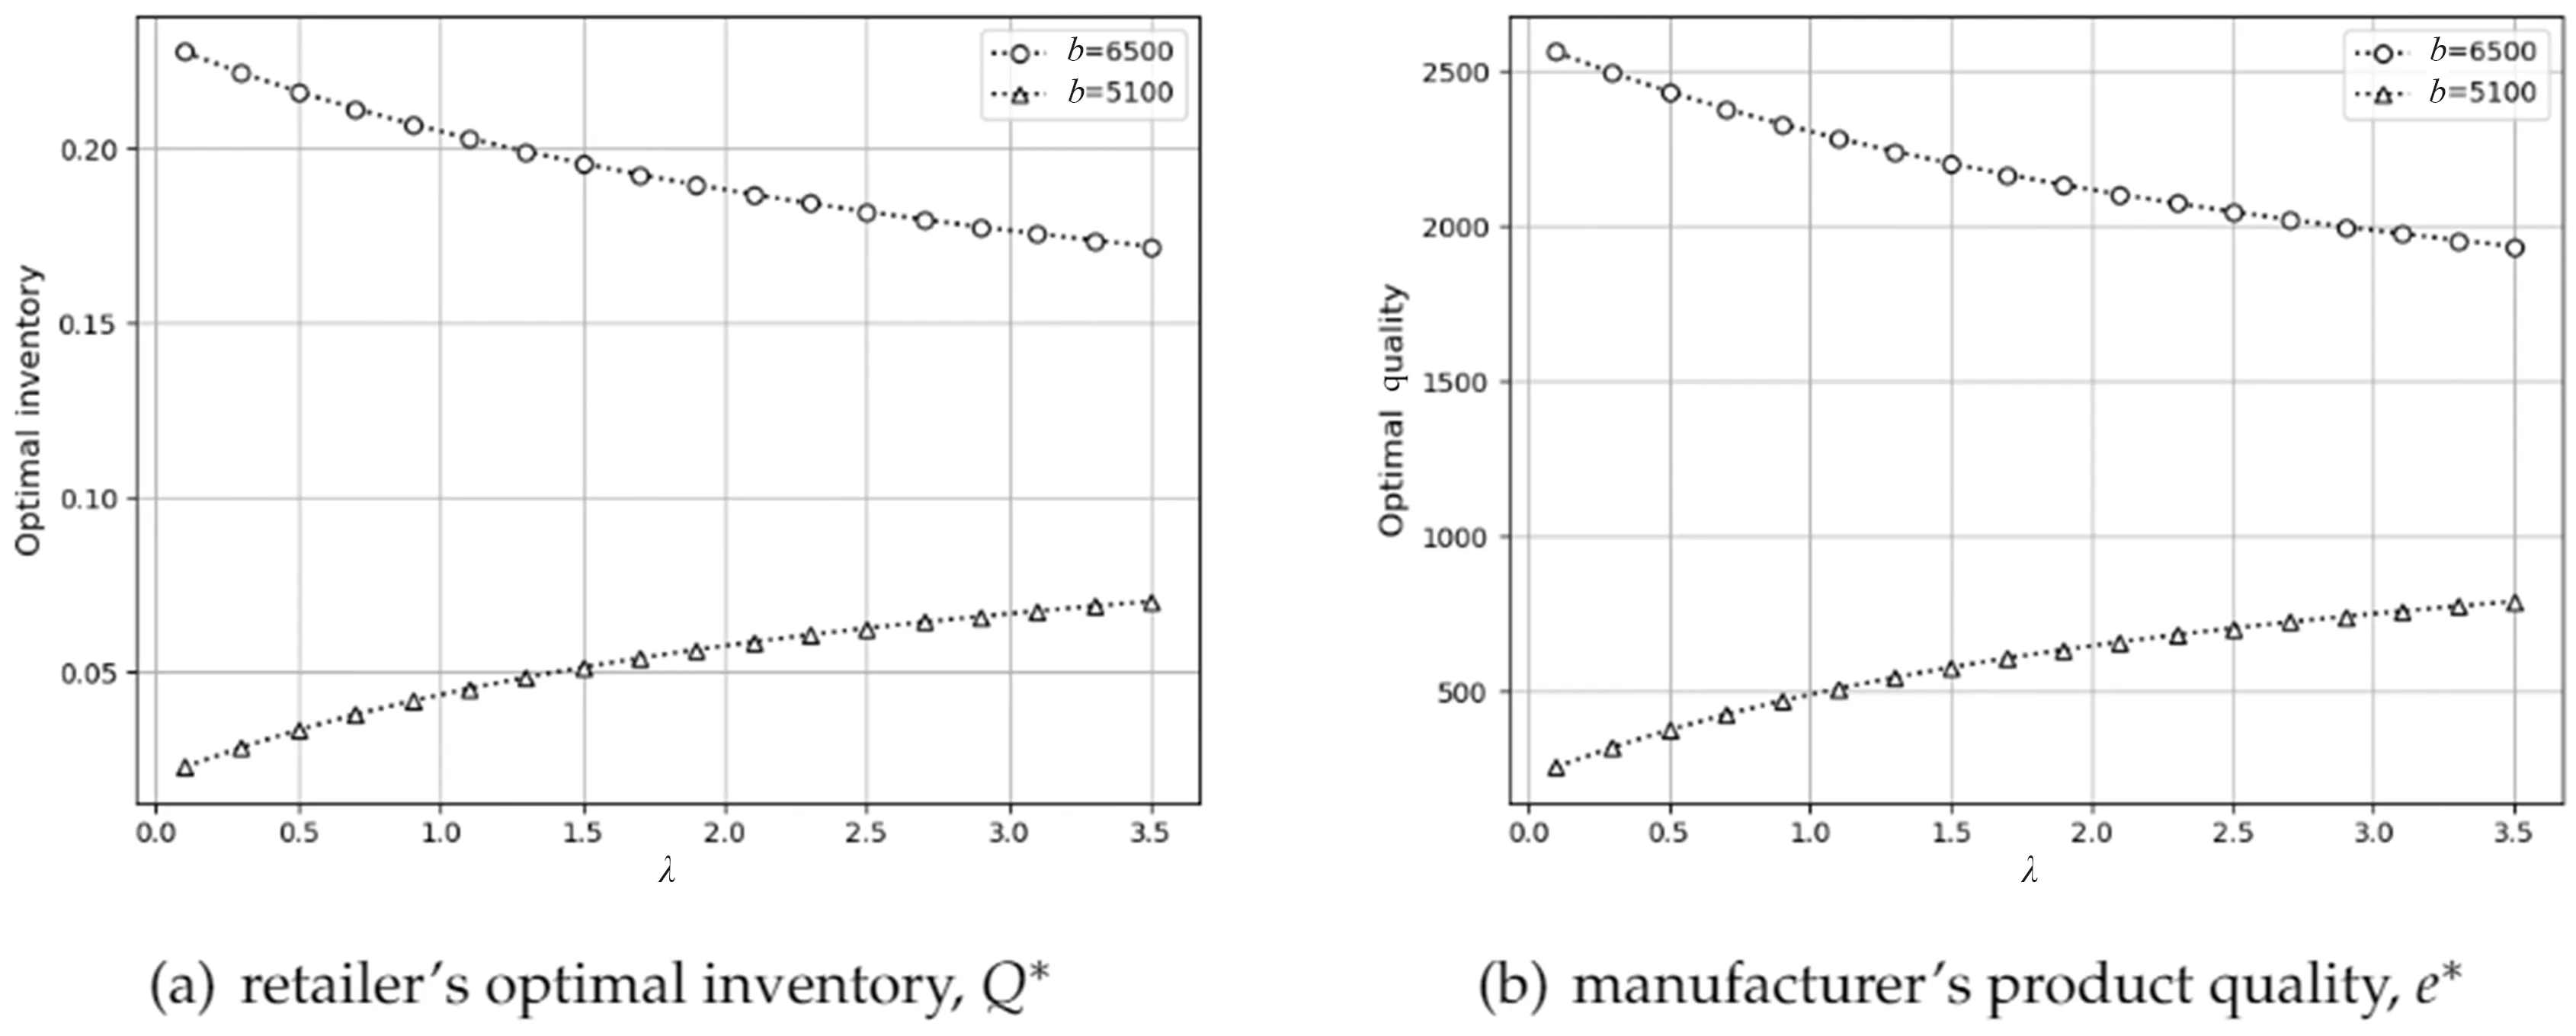
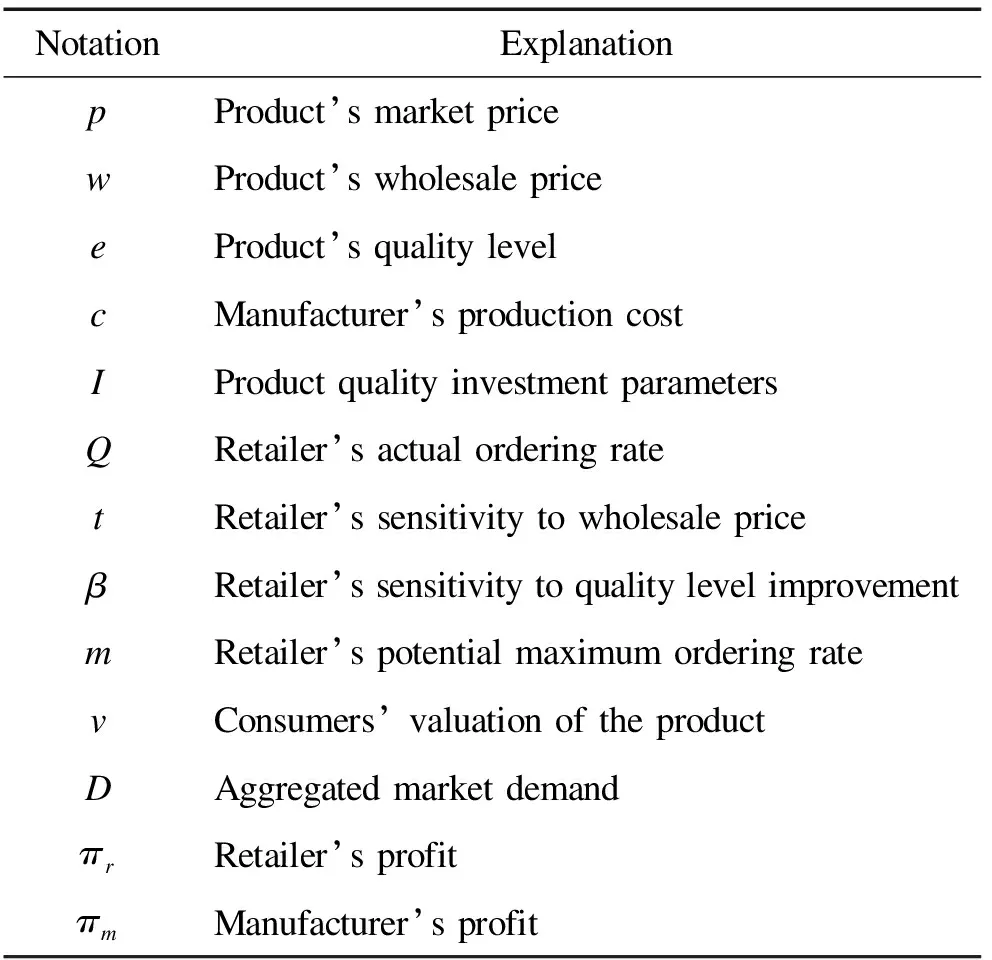
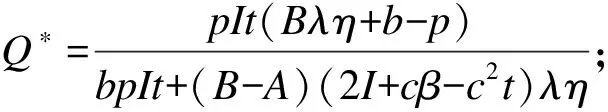
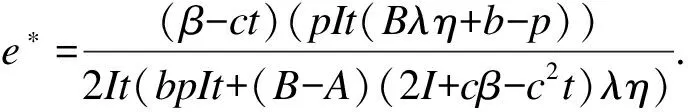
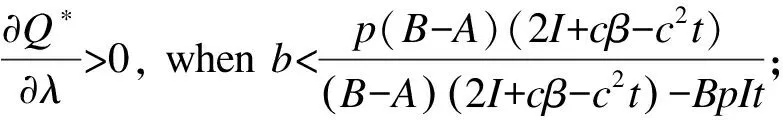
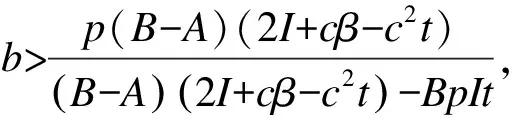
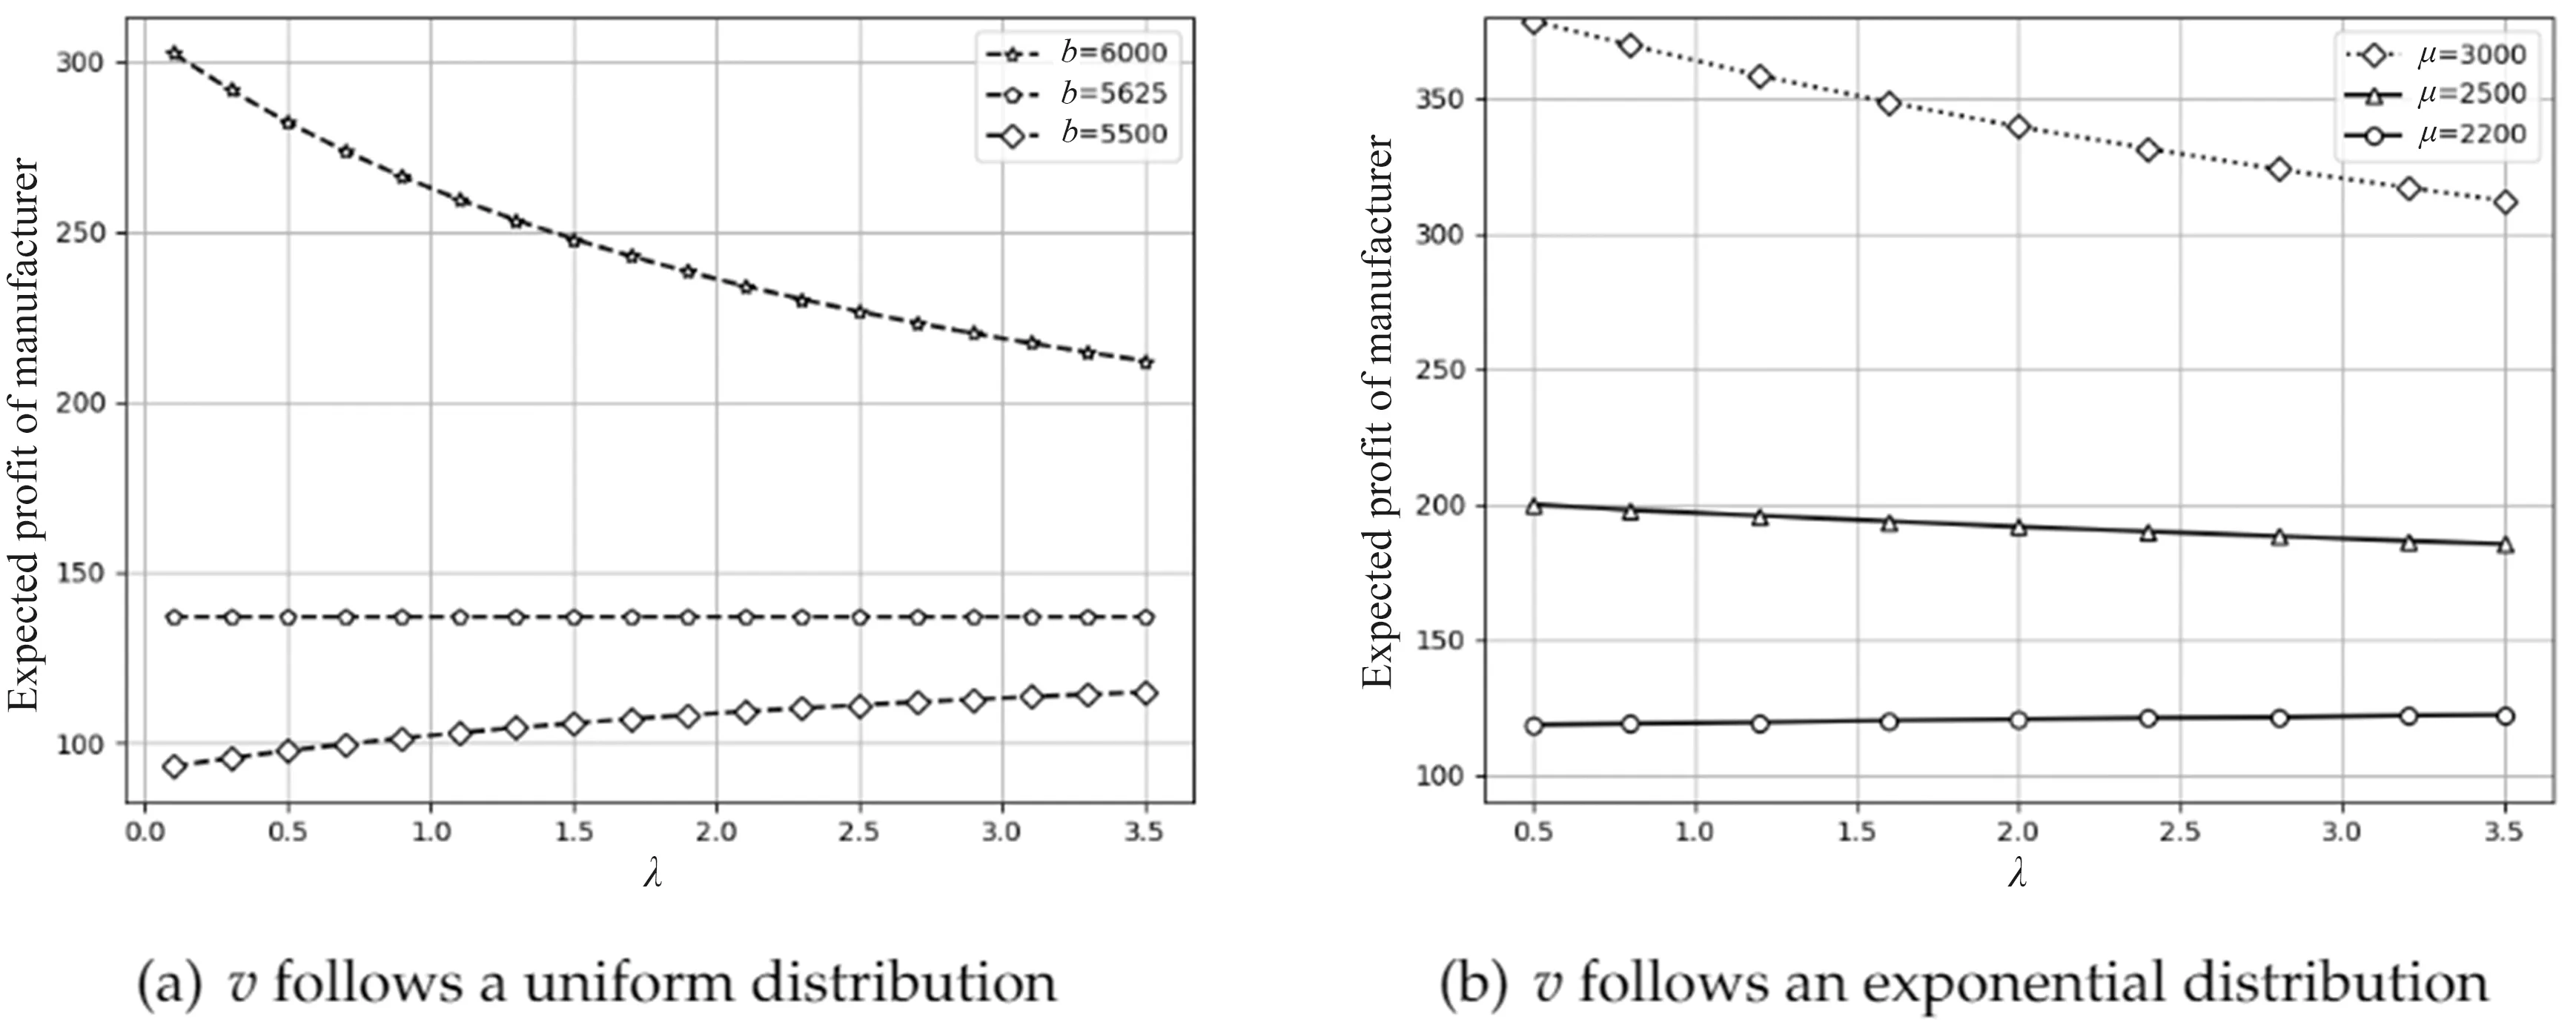
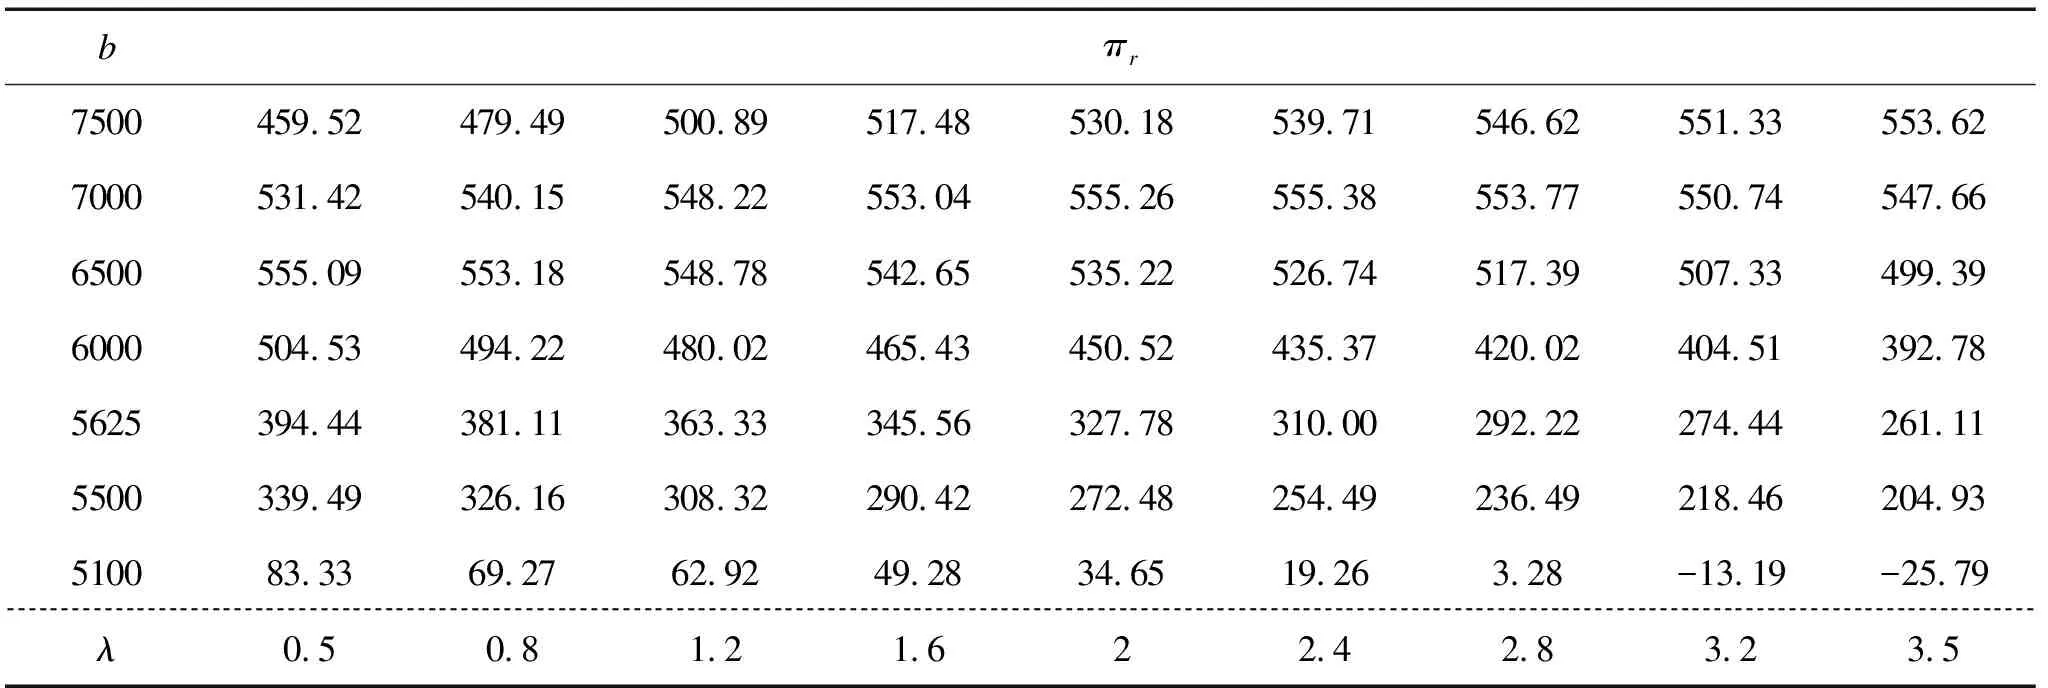
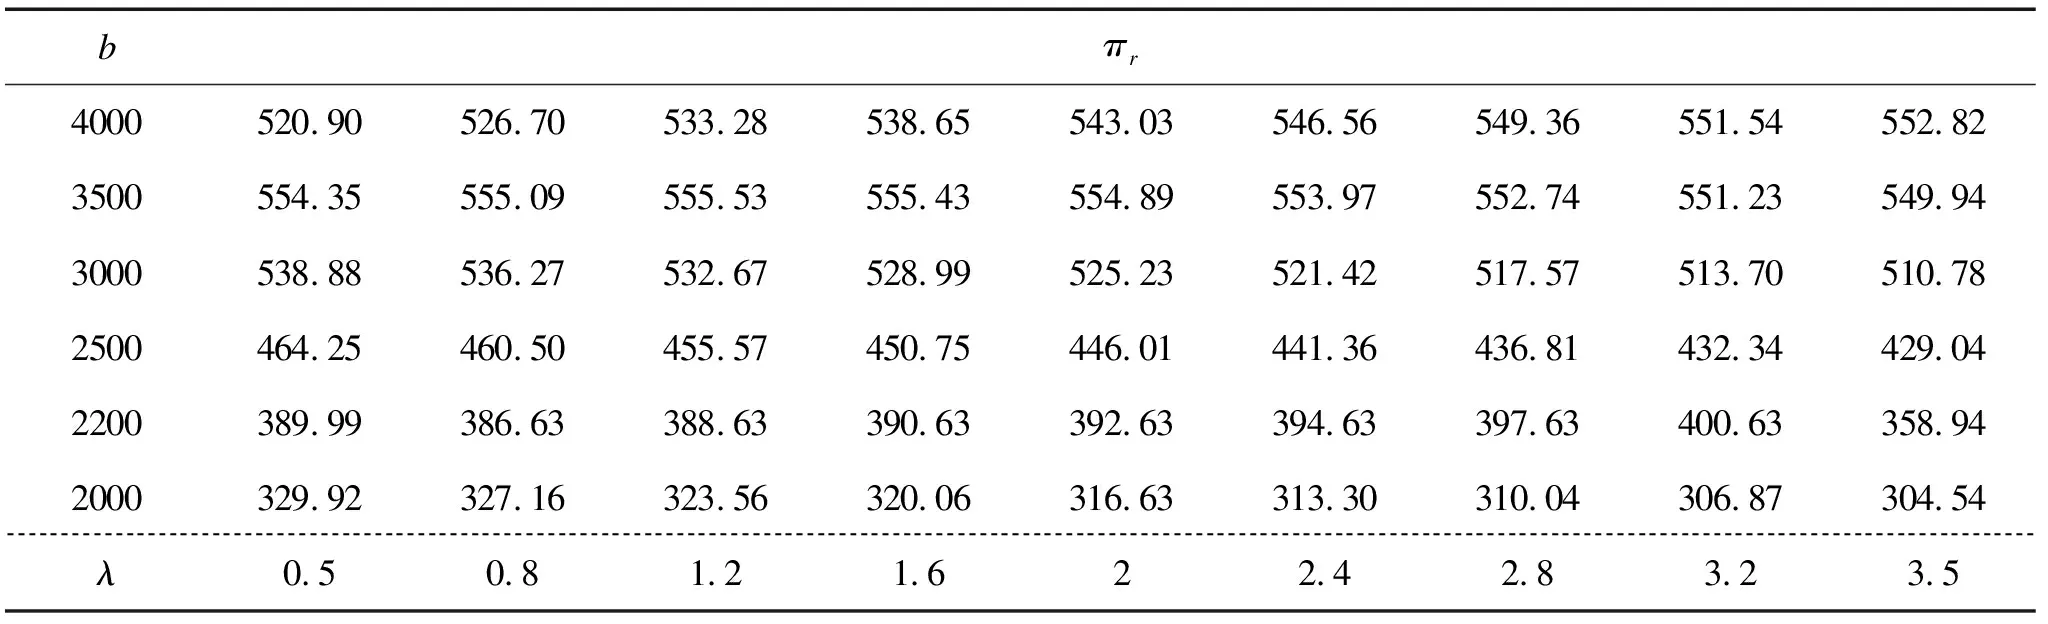
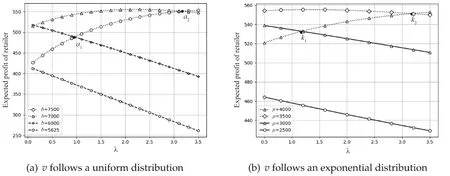
where 0 The information on the channel is complete and symmetric and the market price,p, is given exogenously. Each channel member pursues the maximization of his or her profit. For the manufacturer, following Ref.[46], we divide the production cost per unit into two parts, both of which are related to the product quality,e. The first part is the direct expenses,ce. Explicitly, given a certain quality level, the unit variable cost of the manufacturer increases or decreasescein proportion to the change in orders from the retailer. The second part is the research and development (R&D) overhead,Ie2, which is a convex function with increasing marginal cost. The manufacturer often uses it to update the product quality to an adequate level. As for the retailer, we assume that the unsold products have no salvage value. To maintain consistency with the demand function derived before, we consider the retailer’s ordering quantity,Q∈[0,1], as a relative value, that is, the ratio of actual ordering quantities to all potential consumers in the market. The rapid development of information technology has made retailers’ role in distribution channels more important. Therefore, in many channels, retailers, such as Walmart, Target, and Macy’s, are often the dominant force and determine how to organize and operate the entire distribution process. According to Ref.[25], we assume that the retailer can affect the wholesale price and product quality by setting a maximum potential ordering rate,m, in advance. The actual order quantity depends on both the wholesale price and product quality, that is,Q=m-tw+βe.t(t>0) andβ(β>0) are the sensitivity coefficients of the retailer’s actual order to the manufacturer’s wholesale price,w, and the product’s quality,e, respectively. Without loss of generality, we have 0≤w≤p. Finally, following Refs.[47,48], we discuss the expected profit-maximizing decisions of the two-channel members during a single period via a three-stage Stackelberg game. Specifically, the retailer moves first as a leader to decide the potential maximum ordering rate and declares the sensitivitytandβ. The manufacturer then decides the wholesale price,w, and the quality,e. Finally, the retailer decides the actual ordering rate. The sequence of decision-making of this game is illustrated in Figure 1. Figure 1. The sequence of decision-making in a distribution channel. Figure 2. Impact of consumers’ loss-aversion, λ, on retailer’s optimal inventory, Q*, and manufacturer’s product quality, e*, under the uniform distribution setting. Based on the above explanation, the Stackelberg leader-follower model with the retailer being a leader is as follows: max[πr]=p·min{D,Q}-w·Q s.t.Q*=arg max[πr(Q)] (3) max[πm]=(w-ce)×Q-Ie2 s.t.w*=arg max[πm(w)] ande*=arg max[πm(e)] (4) whereπrandπmare the expected profit functions of the retailer and the manufacturer, respectively. A summary of the parameters used in this paper is presented in Table 1. These parameters are further estimated and determined analytically in Section 4. In this section, we discuss how individual consumers’ responses to gains and losses affect channel members’ decisions under different consumer valuation distributions. Table 1. Model notation. Motivated by the results of Ref.[17], the response of market demand to losses or gains may not always be consistent with the consumer’s psychological biases. Therefore, in this paper, we attempt to validate the relationship between the degree of individual loss-aversion and the response of the market as a whole to losses and gains. Furthermore, we delve into the optimal decisions of channel members when considering consumers’ loss-aversion behaviors. In the first part, we discuss a situation when the valuation’s distribution is uniform. To illustrate the above problems, we let the valuations be uniformly distributed on the interval [0,b]. Every consumer who perceives a non-negative surplus is assumed to make the purchase; thus, the aggregate market demand can be written as (5) wherexis uniformly distributed on the interval [A,B] withA<0 andB>0. According to the decision-making sequence, results of the Stackelberg game are presented in Propositions 3.1 and 3.2. Proposition 3.1If the product valuation of consumers in the market is distributed uniformly on the interval [0,b], the retailer’s optimal inventory level and the manufacturer’s cost-effective quality in a distribution channel whenbQ-b+p<0 are as follows: Proposition 3.1 provides analytical results of optimal decisions of channel members, including the retailer’s inventory level and the manufacturer’s quality level.bQ-b+p<0, that is,b>p/(1-Q), indicates that the market has a relatively high valuation of the product, and the demand would be relatively sufficient. In this scenario, the degree of loss-aversion of consumers affects the decision-making of channel members. Proposition 3.2When consumers’ valuation is distributed uniformly andbQ-b+p>0, the retailer’s optimal inventory and the manufacturer’s cost-effective quality must be as follows: Interestingly, Proposition 3.2 shows that channel members’ optimal decisions are no longer related to the consumer’s behavioral bias whenbQ-b+p>0 asQ∈[0,1],Q-1≤0. Contrary to the situation in Proposition 3.1,bQ-b+p>0 implies that 0 In practice, this phenomenon often occurs when purchasing some essential commodities that cannot be substituted, such as housing and salt. For example, first-time homebuyers’ valuations for a small dwelling-size apartment often far exceed that of other people, especially many upgraders. When everyone in the market except them chooses to withdraw because of the low valuations, this part of rigid-demand consumers keeps the market relatively stable. Above all, regardless ofλincreasing or decreasing, the optimal quality and inventory level remain almost unchanged whenbQ-b+p>0. Assume that consumer valuations are distributed exponentially with meanμ. We can get the piecewise linear demand functions from the previous explanation, that is (6) Results of the Stackelberg game in an exponential distribution setting are presented in Proposition 3.3. μlnQ+p<0 andQ∈[0,1] indicate thatμ>p/lnQ, which shows that consumers in the market have a high valuation of products. Similar to Proposition 3.1, in this case,λimpacts the channel members’ decision effectively. It is difficult to get an analytical expression ofQ*when consumers’ valuation follows an exponential distribution with meanμ. However, for a given distribution of consumers’ valuation, the optimal decision (Q*,e*) can be determined numerically in Section 4. μlnQ+p>0 andQ∈[0,1] indicates thatμ<-p/lnQ, which means that the market has a relatively lower valuation for the product, on average, compared with the setting in Proposition 3.3. In this situation, the market is sluggish and demand is inadequate. Although those with lower valuations or lower psychological reference prices would withdraw from the market, there is a minority with the highest valuations that would still have the incentive to buy. Therefore, in this case, no matter howλchanges, the optimal decision of channel members remains unchanged. The main objective of this subsection is to numerically discuss the influence of different parameters in our model on the channel member’s optimal newsvendor decisions. Two different distributions of consumers’ product valuation are considered. The assignment of parameters and explanations are described below. Given that the market demand in our model has been determined as a probability for potential buyers, the numerical simulations of other related parameters, such as product price and production cost, is standardized in this section. Therefore, in light of the parameters’ value set by Ref.[47], we assume an exogenous retailing pricep=5000 and production costc=1000. Meanwhile, the weighing factor of reference effect,η, is set to be one, which means there is no overestimating or underestimating reference effect. We also assume that the gain/loss surplus,x, follows a uniform distribution on the interval [-200,200]. Furthermore, we define the coefficient of the retailer’s actual order quantity concerning wholesale price and product quality ast=0.00009 andβ=0.1, respectively. In line with Ref.[49], we assume the R&D investment costI=400 based on the quality benchmark. Following Ref.[8], the reference effect on the aggregate market demand can be written as R(x,p)=D(x,p)-D(0,p)=F(p)-F(p-g(x)) (7) For a givenp∈[0,1] andx∈[0,B], the market demand would be (i) more responsive to gains ifR(x,p)>-R(-x,p); (ii) equally responsive to gains and losses ifR(x,p)=-R(-x,p); or (iii) more responsive to losses ifR(x,p)<-R(-x,p). We apply this function to measure the change in demand at the price level,p, due to the changes in the consumers’ psychological reference price. The following numerical analysis and discussion are conducted under the conditions thatbQ-b+p<0 andμlnQ+p<0. Based on Ref.[17], it can be concluded that market demand inherits the characteristics of consumer behavior when the consumer’s valuation is distributed uniformly. In this subsection, we discuss the relationship between the degree of an individual’s loss-aversion behavior and the firm’s optimal decisions in a uniform distribution setting. In particular, we assume consumers’ valuation is uniformly distributed on the interval [0,b]. Two scenarios, wherebis set to 5100 and 6500, are considered. The impact ofλon the optimal inventory is illustrated in Figure 2(a), while Figure 2(b) depicts the impact ofλon optimal quality. As illustrated in these figures, the optimal inventory and product quality decisions underb=6500 are always higher than those underb=5100. Specifically, keepingλ=2, the optimal inventoryQ*is 0.188 whenb=6500 but falls by 69.68% to 0.057 whenb=5100. Intuitively, when the consumer valuation is uniformly distributed, a higherbimplies the product quality and overall valuations of the products in the market are better than those in the scenariob=5100. Relatively sufficient market demand is then generated. Therefore, the manufacturer has a greater incentive to positively update the quality to reduce loss-averse consumers’ concern about the product, thereby further enhancing the market demand. Meanwhile, as the leader in the channel, the retailer’s actual order quantity would also increase because of the high quality. In reality, if two products have a customer group of similar size, then this difference in evaluation interval may originate from the design, performance, brand, or word of mouth. A typical phenomenon that occurred all these years is that emerging products of international big names were more likely to be better placed in the race for quality superiority than traditional domestic brands. For example, Mijia dishwashers, launched by the world’s fourth-largest smartphone brand Xiaomi, successfully achieved a series of technological advantages over the many traditional competing brands such as Wahin and Ocooker. Our findings may provide a potential explanation for this mechanism. Besides the effect ofbon channel members’ optimal decisions discussed above, we are also interested in the impact ofλ. Results in Figure 2 show that the optimal inventory and product quality decrease withλwhenb=6500 but increase whenb=5100. Specifically, whenb=6500, the optimal quality and inventory decrease by approximately 10.02% asλincreases from 0.8 to 2. However, this negative effect does not exist anymore whenb=5100. Unexpectedly, these optimal decisions increase by 41.61% with an increase inλ. To understand the decisions, we attempt to further illustrate the process of the manufacturer’s decision about quality adjustment when consumers are loss-averse. Analytically, on the one hand, loss-aversion behaviors enhance the valuation boundary of potential customers, and the aggregate demand decreases as a result. Considering that retailers may reduce the order quantity, manufacturers are likely to respond by restricting the quality. On the other hand, the sensitivity of market demand to losses and gains varies when individual consumers are more loss-averse. High sensitivity to loss at the level of the overall market indicates that the market demand declines more sharply than the increment due to one unit change in quality. This sensitive effect should make manufacturers think twice about their decisions on quality reduction. Above all, manufacturers in different markets make various cost-effective decisions that balance the marginal benefits and costs. Figure 3. Impact of consumers’ loss-aversion, λ, on retailer’s optimal inventory, Q*, and manufacturer’s product quality, e*, under the exponential distribution setting. We now analyze the decisions described in the figures. First, a relatively highb(6500) means that consumers in the market have high valuations of the products. At this time, the manufacturer faces a high marginal cost for product upgrading, whereas the increase in demand caused by quality improvement is relatively small. Besides, it can be observed from the demand function expression that a largerbhas a buffering effect on the market sensitivity to loss, implying that the demand is not too sensitive to losses even though all consumers are rather loss-averse. Therefore, with the increase in consumers’ loss-averse degree,λ, the manufacturer has more incentives to reduce the quality to resist the increasing uncertainty when considering the marginal benefits and costs of product upgrades. Eventually, it leads to a decline in order quantity. However, contrary to the above statement, whenbis at a relatively low level (5100), which means consumers in the market have low valuations, the negative effect ofλon the optimal decisions reverses. Specifically, in this case, when other conditions remain unchanged, the marginal benefit of demand increment caused by quality improvement has a more significant impact on manufacturers. Besides, the market demand is much more sensitive to the losses asbdeclines to 5100. In other words, the loss incurred by reducing quality increases significantly, and the manufacturer faces consumers with an increasingly higher degree of loss-aversion. This sensitivity of loss prevents manufacturers from lowering the product’s quality. Consequently, although the increase inλincreases market uncertainty, reduces aggregate demand, and thus, hampers quality improvement, manufacturers may still choose to increase the product quality to avoid suffering a more substantial loss in market demand. This decision eventually increases the retailer’s inventory decision,Q*. In this subsection, we consider a situation when the consumer valuation follows an exponential distribution and further discuss the effect of consumer loss-aversion behaviors on channel members’ optimal decisions. Let the valuations be distributed exponentially with meanμ=2200 andμ=3500. The result is depicted in Figure 3. From Figure 3, we find that the optimal quality and inventory are significantly higher whenμ=3500 than whenμ=2200. Specifically, when the degree of consumers’ loss-aversion equals 2 and remains unchanged, the optimal inventory increases by 207% asμchanges from 2200 to 3500. Meanwhile, the result also shows that optimal product qualities and inventory quantities decrease and increase withλwhenμ=3500 and whenμ=2200, respectively. In particular, whenμ=3500 andλchanges from 0.8 to 2, the optimal inventory decreases to 0.2153. However, the optimal inventory increases to 0.1042 whenμ=2200. Figure 4. Impact of market demand to gains and losses. First, we consider the situation whenλis unchanged. Similar to the previous scenario, consumers in the market have a low valuation of products on average whenμis low. Intuitively, the market is relatively sluggish in this scenario, the retailer maintains a low inventory level, and the manufacturer has less incentive to increase market demand and profit by improving product quality. Therefore, this situation corresponds to lower product quality and inventory. Similarly, the quality and inventory levels can be higher whenμis high. However, results in the situation whereμis fixed butλchanges merit further illustrations. In the case where the valuation follows an exponential distribution, why is the result different for high and lowμ? Unlike the previously analyzed case where the valuation is uniformly distributed, the manufacturer is now driven by three forces when making quality decisions under loss-averse consumers. One is the marginal effect. Whenμis at a relatively high level, the marginal benefit of increasing quality could be lower than its marginal cost. Therefore, the market demand prompts the manufacturer to reduce product quality levels. Next, from the reference effect function R(x,p)=exp(-p+g(x)/μ)-exp(-p/μ) we can find, when the valuation follows an exponential distribution, during the process of increase inλ, the market demand changes from being more sensitive to income to being more sensitive to loss. Figure 4 illustrates this change. Furthermore, it also shows thatμhas an amplifying effect on market sensitivity to loss. In other words, a higherμindicates that market demand is more sensitive to losses. This demonstrates that with an increase inλ, the loss in demand for the manufacturer increases with a reduction in quality, which prevents the manufacturer from reducing the product quality. The last is the effect ofλon the aggregate market demand, which is the same as discussed in the previous scenario. The counter-intuitive results in Figure 3 can be better understood based on the analyses above. Specifically, whenμis at a higher level of 3500, a higherμmeans that consumers have a high valuation of the product. The demand under this scenario is also high, which drives the manufacturer to reduce product quality due to the role of the first force. Simultaneously, asλincreases, the market begins to show a more sensitive response to gains, which means that the manufacturer has an incentive to improve quality. Afterλincreases to a certain extent, the market appears to be more sensitive to losses, and the cost for manufacturers to reduce quality becomes higher. Therefore, due to the second force’s effect, the manufacturer is driven to improve the quality. Moreover, the third force drives the manufacturer to reduce product quality. Whenμis at a high level, the decline in quality driven by the first and third forces offset the increase in quality caused by the second force. Finally, the quality increases, and hence, the retailer’s order increases. Figure 5. Impact of loss-aversion degree, λ, on manufacturer’s profit. Contrary to the scenario whereμ=3500, a lowerμ(2200) means lower market demand, implying that the manufacturer improves the quality. At the same time, consistent with the above analysis, asλincreases, consumers change from being motivated to increase quality at the beginning to be unwilling to reduce quality. This second force still drives manufacturers to improve quality. On the other hand, the increase inλmakes the manufacturer reduce the quality. However, whenμis low, an increase in quality due to the first and second forces offsets the decrease in quality caused by the third force. Therefore, in this case, the manufacturer improves the product quality, and then, the retailer eventually raisesQ*. In the previous subsection, we conducted a numerical analysis of the optimal decision-making of decentralized channel members. The results show that when the upper limit,b, of a uniform distribution or the mean,μ, of the exponential distribution is at a relatively low level, an increase in the degree of loss-aversion behaviors does not induce manufacturers and retailers to reduce product quality and order quantities, respectively. This finding provides essential guidance for channel members’ decisions facing loss-averse consumers. However, although the retailer and manufacturer’s optimal decisions in various valuation levels andλhave been determined, we are interested in the highest profits of channel members among these optimal decisions. Therefore, in this subsection, we specifically analyze the impacts ofλon channel member’s optimal profits. Corollary 4.1 shows that the impact ofλon optimal profits can be opposite at different valuation levels. According to the analysis in Section 3, we have ∂Q*/∂λ<0 whenb>5625 orμis high, implying that the larger is theλ, the smaller is the corresponding optimal inventory. By contrast, ∂Q*/∂λ>0 whenb<5625 orμis low. Therefore, we find that the decrease in the retailer’s order has a significant impact on the manufacturer’s profit. The impact ofλon the manufacturer’s profit is fairly similar to that on the optimal inventory. Figure 5 shows this result, that is, the manufacturer’s profit decreases withλwhenb(6000) orμ(3000) is at a high level. However, the result reverses whenb(5500) orμ(2200) is low. Besides, a more extensivevrepresents a higher valuation in the market. From the analysis in Sections 4.1 and 4.2, keepingλunchanged, a higher valuation level directly leads to a higher inventory and product quality. Figure 5 further illustrates that the manufacturer’s profit level is closely related to the consumer valuation level and the manufacturer’s profit whenborμis high is always higher than that when they are low. Our model may provide theoretical guidance of brand re-positioning decisions for various firms facing loss-averse consumers. The results of the retailer’s profit when consumers’ loss-aversion is integrated into the consumer’s utility function, and the uncertainty of the market in both vertical and horizontal dimensions is considered, are presented in Tables 2 and 3. Tables 2 and 3 show that the retailer’s profit increases asλincreases whenb=7500 orμ=4000, which indicates that there is local monotonicity betweenλand retailer’s profit. However, these tables also show that whenb=7000 orμ=3500, the retailer’s profit increases at first and then decreases with the increase inλ. Besides, the retailer’s profit decreases with an increase inλwhenbis less than 6500 orμis less than 3000. These results suggest that the relationship between retailers’ profits and consumers’ loss-aversion behavior is worth analyzing further. Intuitively,λhas two effects on retailers’ profits. The first is a hampering impact by affecting the demand. In particular, asλincreases, the aggregate market demand decreases, and thus, resulting in a decrease in the retailer’s profit. Table 2. Retailer’s profits when valuations are distributed uniformly. Table 3. Retailer’s profits when valuations are distributed exponentially. The second is thatλmay affect the retailer’s profits by affecting the inventory cost. In other words, the increase inλmay lead to a reduction (increment) in product quality and a reduction (increment) in the retailer’s optimal inventory, which in turn reduces (increases) the retailer’s inventory cost and leads to an increment (reduction) in the retailer’s profit. These two effects work together to influence the retailer’s profit. As shown in Figure 6, when the upper limit,b, of a uniform distribution or the mean,μ, of the exponential distribution are at a relatively high level, the retailer’s profit increases withλ. To explore the reason, we attempt to analyze it from the two relevant factors mentioned above. On the one hand, whenborμis high, the optimal inventory decreases withλ(see Sections 4.1 and 4.2) and the market demand can be relatively high. Therefore, although a reduction in quality reduces demand, its effect is less in this scenario. Thus, this reduction has less effect on the retailer’s profit, which reflects the hampering effect ofλon the profit. On the other hand, the reduction in optimal inventory also reduces the inventory cost of the retailer, which reflects the promoting effect ofλon the retailer’s profit. Consequently, when the reduced revenue caused by demand reduction is less than the retailer’s saved inventory cost, the retailer’s profit increases. This finding can be found in curvesb=7500 in Figure 6(a) andμ=4000 in Figure 6(b). Similarly, when the upper limit,b, of a uniform distribution or the mean,μ, of the exponential distribution are at the median level, the market demand level is also at the median level. At this time, the increase inλreduces the market demand, which increases the impact of quality decline on the demand and retailer’s profits. Besides, the decline in product quality reduces the retailer’s inventory cost simultaneously. Therefore, with the increase inλ, once the reduced profit due to demand reductions exceeds total inventory costs saved, the retailer’s profit changes from an increase with the increase inλto a gradual decrease with its increase. The curvesb=7000 in Figure 6(a) andμ=3500 in Figure 6(b) reflect this phenomenon. Figure 6. Impact of loss-aversion degree, λ, on retailer’s profit. Finally, when the upper limit,b, of a uniform distribution or the mean,μ, of the exponential distribution are low, the optimal inventory increases withλ, which further increases the inventory cost. Besides, the demand decreases withλ, which also has a downward effect on the retailer’s profits. Therefore, in the process of increasingλ, the combined effect of these two aspects eventually reduces the retailer’s profit. Besides, spotsa1anda2in Figure 6(a), andk1andk2in Figure 6(b) further indicate that retailers’ optimal profits in different markets may reach the same level under different valuation levels. Moreover, givenλ=0.5, we can find from Figure 6 that the retailer’s profit is higher whenb=7000 orμ=3500 than whenb=7500 orμ=4000. Our results have important implications for retailers’ market selections. For example, customer groups with the best valuation levels often fail to help companies maximize profits. It may be more effective to invest in markets with sub-optimal consumer valuation levels and realize profit maximization. Taking consumer’s loss-aversion behavior into account, this paper examined various cost-effective decisions of different firms in a market with loss-averse consumers. Heterogeneous consumers’ purchase decisions were considered to better understand the market demand facing consumers’ behavioral bias. Unlike previous literature, in our paper, consumers were assumed to behave distinctly in the valuation of the product (horizontal heterogeneity) and the setting of the reference price (vertical heterogeneity). Meanwhile, an endogenous aggregate market demand formed by individuals’ purchase intentions was introduced to firms’ decision models, which also distinguished our work from traditional newsvendor models. Through a three-stage Stackelberg leader-follower model, we derived the optimal solutions for both the retailer and manufacturer under two consumer valuation distributions. Besides, our analytical and numerical studies also attempted to validate (i) the monotonicity between loss-aversion behaviors of individual consumers and the firm’s optimal decisions and expected profits; (ii) the consistency between the loss-aversion behavior of the overall market demand and individual consumers. The main results of this study were as follows: First, contrary to conventional wisdom, as the uncertainty of market demand increases, the manufacturer may not reduce product quality, and retailers may not reduce inventory, either. The effects of demand uncertainties in two dimensions considered in this paper could be opposing each other. Specifically, the vertical uncertainty, which captures the difference in reference effect, has a buffering effect on the aggregate market demand, inducing the manufacturer to restrict quality improvement. By contrast, the horizontal uncertainty, determined by the interval width of consumer valuations, has a promoting effect on the overall demand. Therefore, a larger horizontal uncertainty enhances the market demand and induces the retailer to order more. Besides, when the interval length of consumers’ valuation follows a uniform distribution or the mean value of the exponential distribution is low enough, then the optimal quality and inventory is unaffected by the degree of loss-aversion of consumers. Second, among the channel members, the increase in consumers’ loss-aversion reduces the expected profits of the manufacturer. However, this monotonicity does not exist in the relationship between consumers’ loss-aversion and retailer’s profits. Specifically, the increase in consumers’ loss-aversion degree has a promoting effect on the retailer’s profit when the consumers’ valuations are at a high level. With the increase in consumers’ loss-aversion degree, this promotion effect is transformed into a hampering effect when the consumers’ valuations are at a middle level. The consumers’ loss-aversion degree maintains a hampering effect on the retailer’s profit when the consumers’ valuations level is low. The results of profit analysis demonstrated that it may not be optimal for firms to stubbornly pursue high valuation markets. Third, market demand may not inherit the behavioral bias of individual consumers. Specifically, when individual consumers are loss-averse and their valuations follow a uniform distribution on the interval[0,b], the market demand is more sensitive to quality reductions than improvements asbbecomes increasingly smaller. This provides evidence that the manufacturer should not stubbornly stick to quality-reducing and cost-saving strategies when facing the ever-growing uncertainty of market demand. However, although an increase in the degree of consumers’ loss-aversion behaviors increases market demand uncertainties in both cases, the result can be reversed when the valuation follows an exponential distribution with a meanu. In other words, market demand becomes more sensitive to quality improvements than reductions asudecreases. Although reducing the quality is an effective solution for manufacturers to handle the challenge involved in the uncertainty of market demand, especially as a follower in a decentralized channel, the specific strategy is not as simple as presented in the existing literature. Manufacturers first need to have a deep understanding of consumer evaluations and then determine the direction of quality development in uncertain markets. Though it provides some interesting conclusions and remarkable implications, our model has several limitations, which we hope to solve in future studies. First, the model relies heavily on the assumption of complete information game and retailer-leading setting to ensure the improvement of product quality positively promote retailers’ inventory quantity decisions. In practice, retailers’ inventory decisions are affected by other factors, such as retailers’ risk attitudes and policy environments. Therefore, more relationships and decision sequences between channel members should be analyzed. Second, the optimal decisions we discussed in this paper are not always mutually beneficial. Joint inventory and quality decisions in a centralized channel are not considered. Future studies can consider various chain contracts, such as revenue-sharing and buyback contracts, to investigate how to coordinate the whole channel taking downstream behavioral biases into account. Acknowledgments The work is supported by the National Natural Science Foundation of China (72104034, 71974177), Humanities and Social Science Fund of Ministry of Education of China (21YJC630037), Science and Technology Planning Project of Shaanxi Province, China (2020JQ-398), Fundamental Research Funds for the Central Universities, CHD (300102231616), USTC Research Funds of the Double First-Class Initiative (YD2160002002), and China Postdoctoral Science Foundation (2020M683403). Conflictofinterest The authors declare no conflict of interest. Authorinformation ZhangJinxiis currently a PhD candidate under the supervision of Prof. Ma Tianshan at Chang’an University. Her research interests focus on the supply chain management, transportation planning and economy, and low-carbon behavioral decision. HeHaonan(corresponding author) received his BS degree in statistics in 2014 and PhD degree in business administration in 2019, both from University of Science and Technology of China. In 2019, he joined Chang’an University, where he is currently a lecturer. His research interests include supply chain management and environmental policy. He has published several articles in some high quality journals such asTransportationResearchPartD,JournalofRetailingandConsumerServices, andEconomicModelling.
3.1 Uniform distribution


3.2 Exponential distribution


4 Numerical analysis
4.1 Uniform distribution

4.2 Exponential distribution

4.3 Profits of channel members

5 Conclusions
