
Formation mechanism of interfacial microstructures and mechanical properties of Ti2AlNb/Ni-based superalloy joints brazed with NiCrFeSiB filler metal
2021-07-30 14:05:18HishuiRenXinyuRenWeiminLongBoChenShujiePngHupingXiong
Hishui Ren ,Xinyu Ren ,Weimin Long ,Bo Chen ,Shujie Png ,Huping Xiong,*
a Welding and Plastic Forming Division,Beijing Institute of Aeronautical Materials,Beijing,100095,China
b Department of Material Science and Engineering,Beihang University,Beijing,100191,China
c State Key Laboratory of Advanced Brazing Filler Metals and Technology,Zhengzhou Research Institute of Mechanical Engineering,Zhengzhou,450001,China
Keywords:Ti2AlNb alloy Ni-based superally Brazing Microstructure Mechanical properties
ABSTRACT Dissimilar brazing of Ti2AlNb-based alloy and Ni-based wrought superalloy(GH536)was studied using NiCrFeSiB filler metal.The Ti2AlNb/GH536 joints were analyzed by scanning electron microscope (SEM) equipped with an electron probe micro-analyzer(EPMA),X-ray diffraction(XRD)and transmission electron microscopy(TEM).The formation mechanism of interfacial microstructure and mechanical properties of Ti2AlNb/GH536 joints were studied.The results indicated that Ti2Ni(Al,Nb),AlNi2Ti and TiB2 reaction layers were formed in the joint adjacent to Ti2AlNb base metal.These layers resulted in high micro-hardness and the weak link of the joint.γ solid solution was formed through isothermal solidification and β1-Ni3Si phase precipitated in the γ solid solution during cooling process.Ni3B,β1-Ni3Si and CrB phases appeared in the centre of the joint.Blocky and needle-like borides formed within the diffusion affected zone of GH536 base alloy.The maximum tensile strength of Ti2AlNb/GH536 joints reached 425 MPa at room temperature and the strength value of 373 MPa was maintained at 923 K.
1.Introduction
Ti2AlNb alloy is a potential structural material for aerospace applications due to its low density,high creep and oxidation resistance at elevated temperatures [1,2].Its long-term service temperature can be up to 923 K–973 K.And therefore Ti2AlNb alloy is inclined to be adopted as one of the candidate materials for heat-resistance components in advanced aero-engines[3].At present,Ni-based superalloys are extensively used in aero-engine hot-section components.Then,the joining between Ti2AlNb alloy and Ni-based superalloy for producing dissimilar joints is of great importance to realize the expected material combination design.
In the past decades,several joining techniques had been applied to join Ti2AlNb alloys to themselves,including brazing [4,5],diffusion bonding[6],electron beam welding[7]and laser beam welding[8,9]as well as linear friction welding[10].With regard to dissimilar joining,the studies mainly focused on the joining of Ti2AlNb to Ti-based alloys[11,12]or TiAl intermetallics [13,14].However,the research on the dissimilar joining between Ti2AlNb-based alloy and Ni-based superalloy has hardly been reported.
The dissimilar joining is extremely difficult due to the following reasons.Firstly,the dissolution enthalpy of Ti in liquid Ni solvent is-170 kJ/mol [15],and according to the Ti–Ni binary alloy phase diagram [16],several kinds of Ti–Ni intermetallics such as Ti2Ni,TiNi and TiNi3could be formed between them.These intermetallic phases will increase joint brittleness and deteriorate the joint properties.Secondly,the thermal expansion coefficient of Ni-based superalloy(~13.0×10⁻⁶K-1)is substantially higher than that of the Ti2AlNb alloy(~9.1×10⁻⁶K-1) [17].This difference could influence the heat transfer during the welding process and induce large residual thermal stresses,which would easily result in micro-cracks within the joint.Finally,chemical composition becomes a parameter that varies over a wide range across the joint.Hence,it is difficult to obtain a single liquidus isotherm defining the solid-liquid interface as it does in similar metals joining.Therefore,the joining of Ti2AlNb alloy to Ni-based superalloy is not only an extremely difficult technology problem but also a key scientific issue.It is a great importance to depress the formation of interfacial brittle phases at the joining interface and to ensure good metallurgical quality.
An attempt was made to join Ti3Al-based alloy to Ni-based superalloy using arc welding method with Ti–Nb and Ti–Ni–Nb filler alloys.The average room-temperature tensile strength of the joint welded with Ti–Nb was 202 MPa,and the strength value of the one welded with Ti–Ni–Nb was 128 MPa [18].In addition,the dissimilar joining of Ti3Al-based alloy to a Ni-based superalloy was carried out using Ag–21Cu–25Pd (wt.%) brazing filler metal [19].But Ag-based brazing alloys have low thermal resistance and the corresponding joints can’t meet the requirement of 923 K service temperature.So far,the study on the dissimilar joining of Ti2AlNb alloy to nickel-based superalloy is rather insufficient.
In a previous study,the brazing of a Ni-based superalloy using Ni–Cr–Fe–Si–B system filler metal was investigated,and a high joint strength was achieved [20].Hence,in the present study the dissimilar joining of a Ti2AlNb-based alloy to a Ni-based wrought superalloy was conducted using Ni–7Cr–3Fe–4.5Si–3B (wt.%) brazing filler alloy to obtain the sound bonding between the filer metal and Ni-based superalloy.The microstructure and mechanical properties of the joints were investigated,the diffusion behavior of elements and the reaction mechanism at the joining interface were discussed as well.
2.Experimental procedures
The Ti2AlNb-based alloy used was Ti–24Al–15Nb–1Mo (at.%) alloy composed of α2-Ti3Al,O–Ti2AlNb and β/B2 phases.The alloy was prepared by the following steps:vacuum-consumable electrode arc melting,breaking down in the β/B2 phase fields,forging and rolling in the α2+B2 phase field,and heat treating at 1253 K for 1 h followed by cooling in air.The other parent material to be joined was GH536 wrought superalloy with long-term service temperature of 1173 K.The chemical composition of GH536 superalloy was given in Table 1.The filler material was Ni–7Cr–3Fe–4.5Si–3B (wt.%) (Ni–6.6Cr–2.6Fe–7.9Si–13.7B at.%) alloy with the liquidus temperature of about 1256 K.This alloy was fabricated into filler foils with a thickness of about 30 μm by a rapid solidification technique,and double foil layers were laminated in the subsequent brazing experiment.
Cylindrical samples were machined from Ti2AlNb and GH536 alloys as shown in Fig.1a.Prior to brazing,the joined samples were ultrasonically cleaned in acetone,and then the Ni–Cr–Fe–Si–B filler alloy was sandwiched between the two base metals (Fig.1a).The brazing experiment was conducted at 1283 K with a varying dwell time of 3–15 min.During the brazing experiment the vacuum was kept between 7 × 10⁻³Pa and 8 × 10⁻⁴Pa and the heating rate was 6 s/K.After the brazing experiment the joint was cooled down to 773 K with a rate 5 K/min followed by furnace cooling.
The microstructures of the brazed joints were examined by a scanning electron microscope (SEM,JAX-8100) equipped with an electron probe micro-analyzer (EPMA).An X-ray diffraction (XRD) spectrometer with Cu–K radiation (D/max-RB) was used to identify the reaction phases within the joint.Furthermore,the structure of the reaction phases was also examined through a transmission electron microscopy (TEM,JEM-2010).The TEM samples were prepared as follows:A cylinder sample was cut from the as-brazed Ti2AlNb/GH536 joint.Then slice samples including the joining interface were cut from the cylinder sample and ground to the thickness of 30 μm.Finally,the ground slice samples were further prepared by an ion thinning instrument(PIPS-691).
Micro-hardness test of various areas across the Ti2AlNb/GH536 joints was carried out using a Vickers hardness tester(450-SVD)with a load of 50 g and load time of 15 s.At least 3 indentations were performed for each kind of microzone.The tensile strength of the brazed joints was measured at room temperature and 923 K,respectively.The details of the joint specimen for tensile test were illustrated in Fig.1b machined from the joint in Fig.1a.

Fig.1.Illustration of brazed joint in mm:(a) assembly for brazing experiment;(b) tensile specimen.
3.Microstructure evolution of Ti2AlNb/GH536 joints
Fig.2 shows the backscattered electron images of Ti2AlNb/GH536 joints brazed with NiCrFeSiB filler metal using various bonding parameters.When the dwell time was 3 min,grey phases (“1”,“2”),black phases(“3”)and dark grey phases(“4”)formed in the centre of the joint(Fig.2a).In order to analyze the phase constitution in these zones,a locally magnified morphology was given in Fig.2b.It can be seen that microzone“3”consists of the black laths(“5”)with a thickness of about 0.5 μm and dark grey phase (“6”).Microzone“4”,similar to microzone“8”,is composed of grey phase(“9”)and dispersed particles with a size of about 0.5 μm.In addition,prolonging the brazing time caused the decrease of the grey phases (Fig.2d) and the black phases in the joint central area.
Furthermore,adjacent to Ti2AlNb substrate,three reaction layers as marked by“11”,“12”and“13”were visible(Fig.2d).With the increase of dwell time,the reaction layers were thickened.For instance,when the brazing experiment was conducted at 1283 K for 5 min,the reaction layers as marked by“11”and“12”were 2.7 μm and 3.2 μm,respectively(Fig.2a),but under the brazing condition of 1283 K/15 min (Fig.2d)their average thicknesses increased to 3.4 μm and 5.6 μm,respectively.
The element concentration profiles along the red line in Fig.2d are displayed in Fig.3.As shown in Fig.3a,the content of element Al decreased gradually from the Ti2AlNb side to the joint centre.At the position Distance=17 μm corresponding to the reaction layer“12”in Fig.2d,the concentration peak formed for the line of element Ni,and the concentration valleys are visible for element Ti and Nb.Contrary phenomenon occurred at the position Distance=21 μm corresponding to the reaction layer“13”.Furthermore,the concentration peak presented for the element Cr when the red line crossed the black phase in microzone“15”.
According to the EPMA analysis results listed in Table 2,the grey phases in microzones“1”and“2”were γ solid solution dissolved with little Cr.Different from the grey phases,more elements Si and Cr were detected in the microzones“3”and“4”.The EPMA analysis results in Table 2 indicated that the main elements in the black laths(“5”in Fig.2b)were Ni,Cr and B.However,for light element B its concentration could not be determined by EPMA due to its insufficient accuracy.The phases in microzone“5”were deduced to be Ni3B+CrB.Based on the atom proportion of Ni and Si in the dark grey phase(“6”in Fig.2b),the phase was identified as β1-Ni3Si blocks.Microzone“3”in Fig.2a contained the black laths and dark grey phase.Thus the phases in microzone“3”should be the mixture of Ni3B,CrB and β1-Ni3Si.Besides,the phases inmicrozones“7”and“9”were γ solid solution.By contrasting the EPMA results in microzones“8”and“9”,the dispersed particles within microzone“8”was β1-Ni3Si particles and microzone“8”should consist of γ solid solution and the precipitated β1-Ni3Si particles.

Table 1 Chemical composition of GH536 superalloy(wt.%).

Fig.2.Backscattered electron images of Ti2AlNb/GH536 joints brazed at 1283 K for:(a) 3 min;(b) locally magnified morphology of the Ti2AlNb/GH536 joint in Fig.2a;(c) 5 min;(d) 10 min;(e) 15 min.
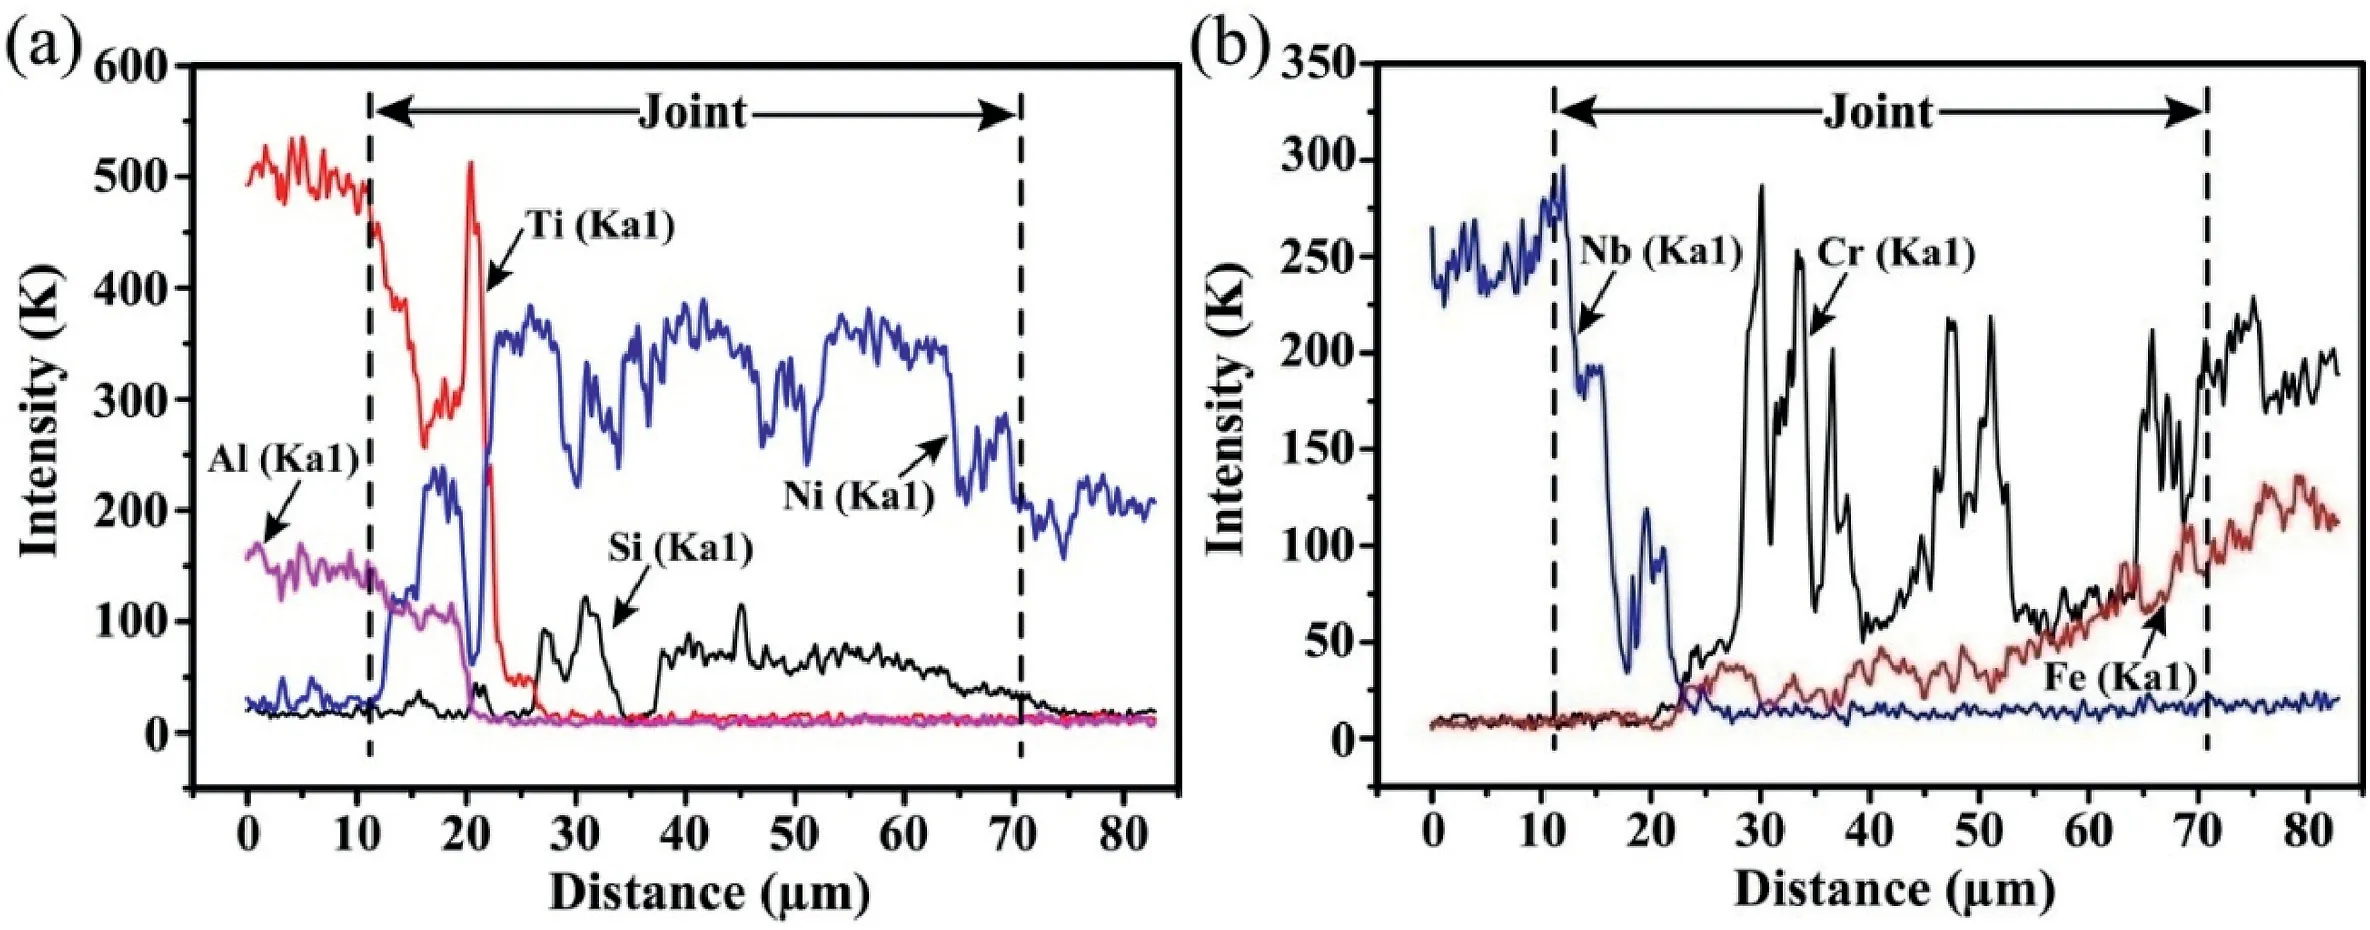
Fig.3.Concentration profiles of major elements across the joint in Fig.2d.
For the joint in Fig.2d,the main elements in microzone“10”were Ti,Al and Nb (Table 2) and no columnar α2-Ti3Al phase precipitated.Thephase in this zone should be β/B2 phase dissolved with Ni,indicating the diffusion affected zone (DAZ).During the brazing process,elements Ti and Al from the Ti2AlNb alloy diffused towards the brazed seam and reacted with the NiCrFeSiB filler metal.The change of chemical composition leaded to the transformation of α2-Ti3Al phase and O–Ti2AlNb phase to β/B2 phase.Concerning layer“11”(Fig.2d),the content of Al was close to that in microzone“10”as inferred by the EPMA map scanning results in Fig.4a.On the other hand,the concentrations of elements Ti and Nb in layer“11”exhibited an obvious decrease(Fig.4bc),but element Ni increased apparently (Fig.4d) up to 24.769 at.%,as shown in Table 2.Thus this layer is deduced to be Ti2Ni(Al,Nb) compound.The selected area electron diffraction results (Fig.5a) confirm Ti2Ni phase in layer“11”,with a face-centred cubic structure(a=0.296 nm).The XRD peaks associated with Ti2Ni phase was also labeled in Fig.6 at the surface of Ti2AlNb side of the fractured specimen.
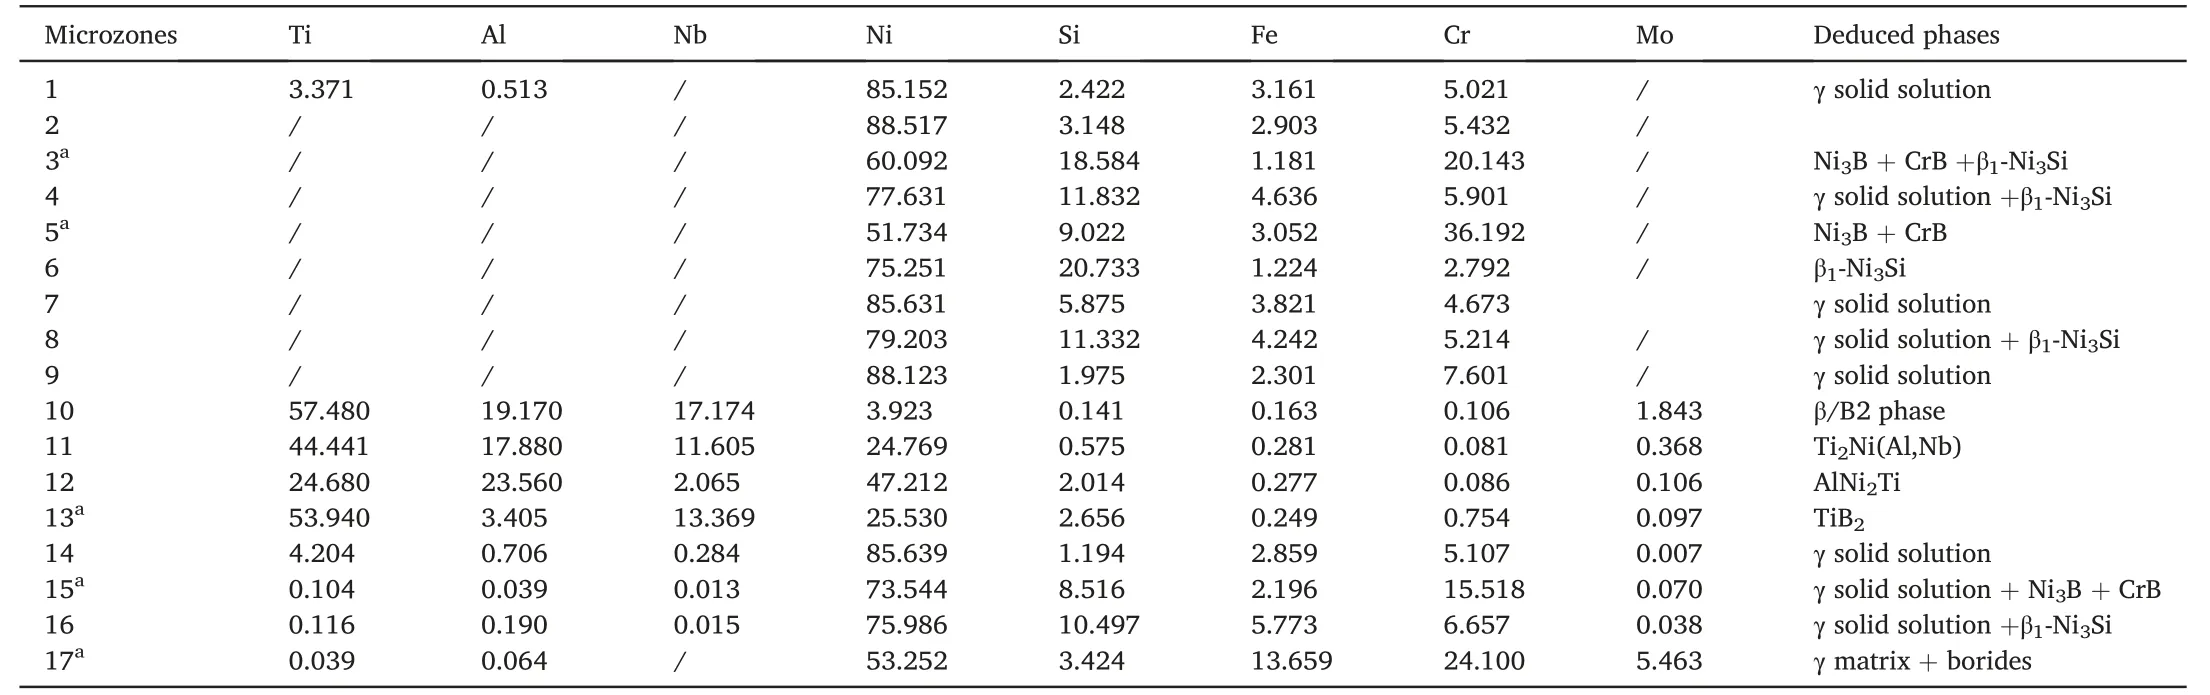
Table 2 EPMA analysis results for the microzones in Fig.2,at.%.
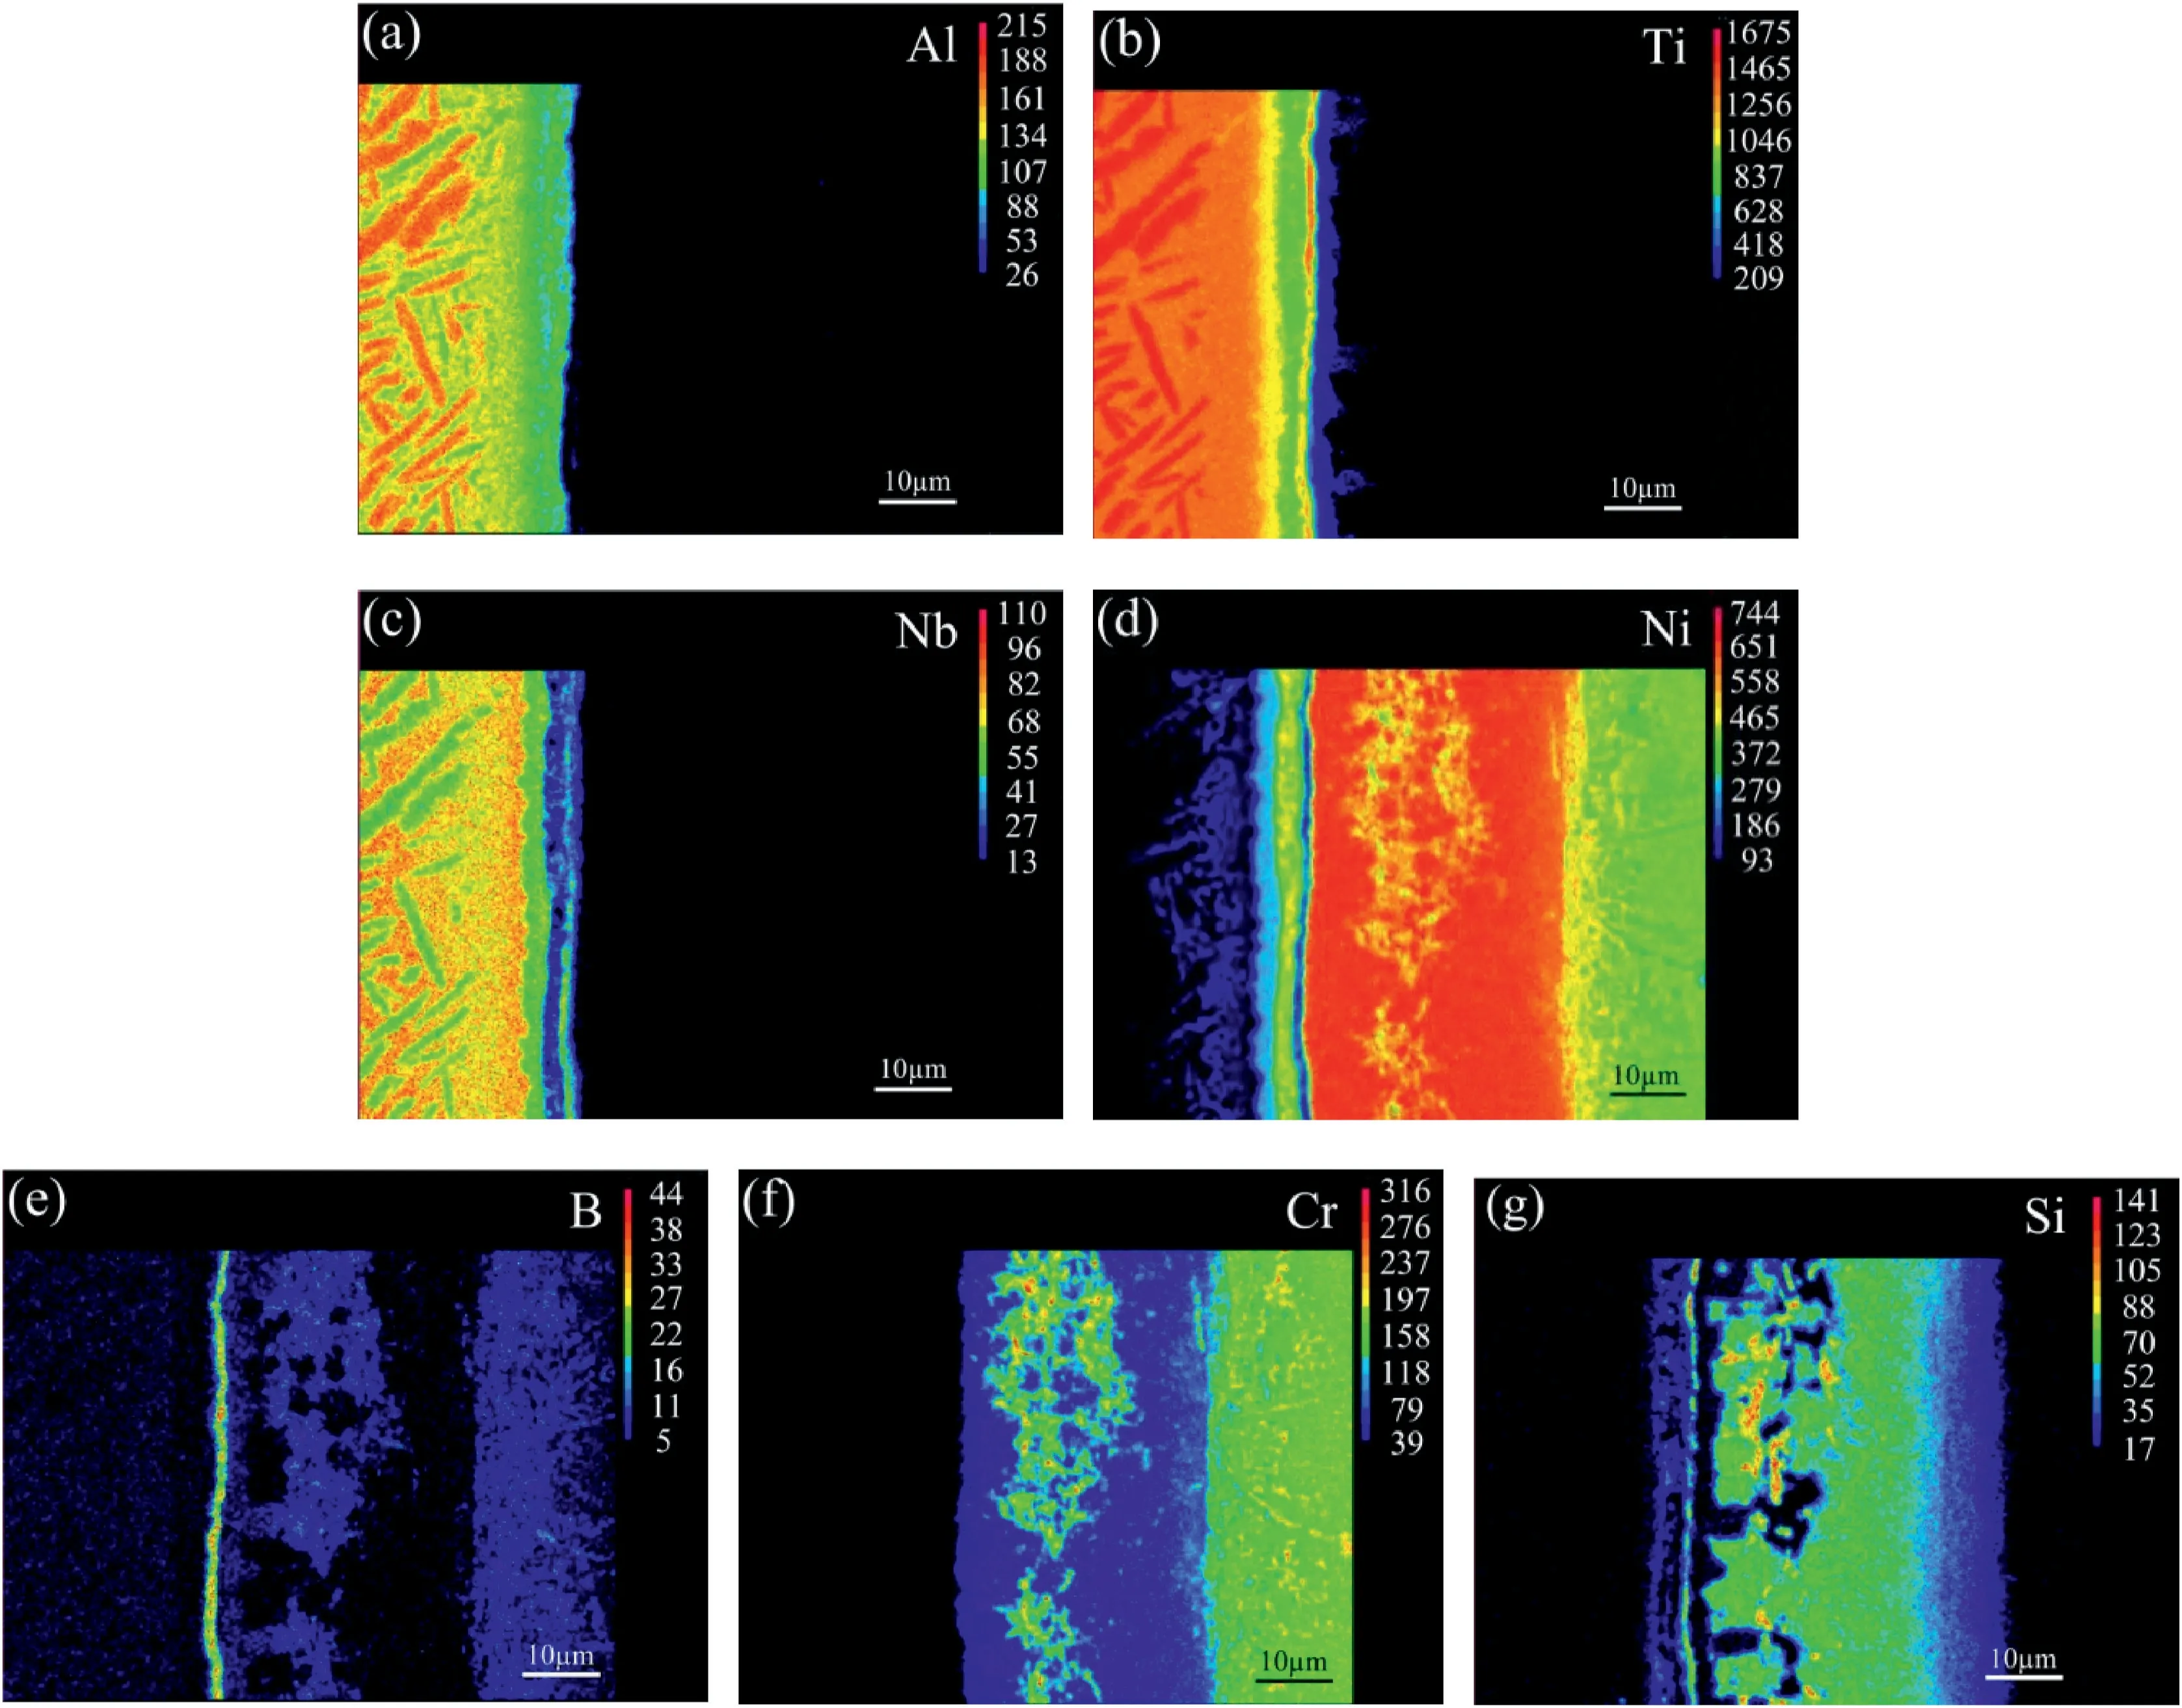
Fig.4.Element area distribution maps:(a) Al;(b) Ti;(c) Nb;(d) Ni;(e) B,(f) Cr and (g) Si in Fig.2d.
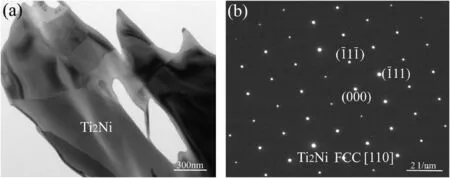
Fig.5.(a) TEM micrograph of Ti2Ni phase;(b) selected area electron diffraction (SAED) pattern of Ti2Ni phase ([110]).
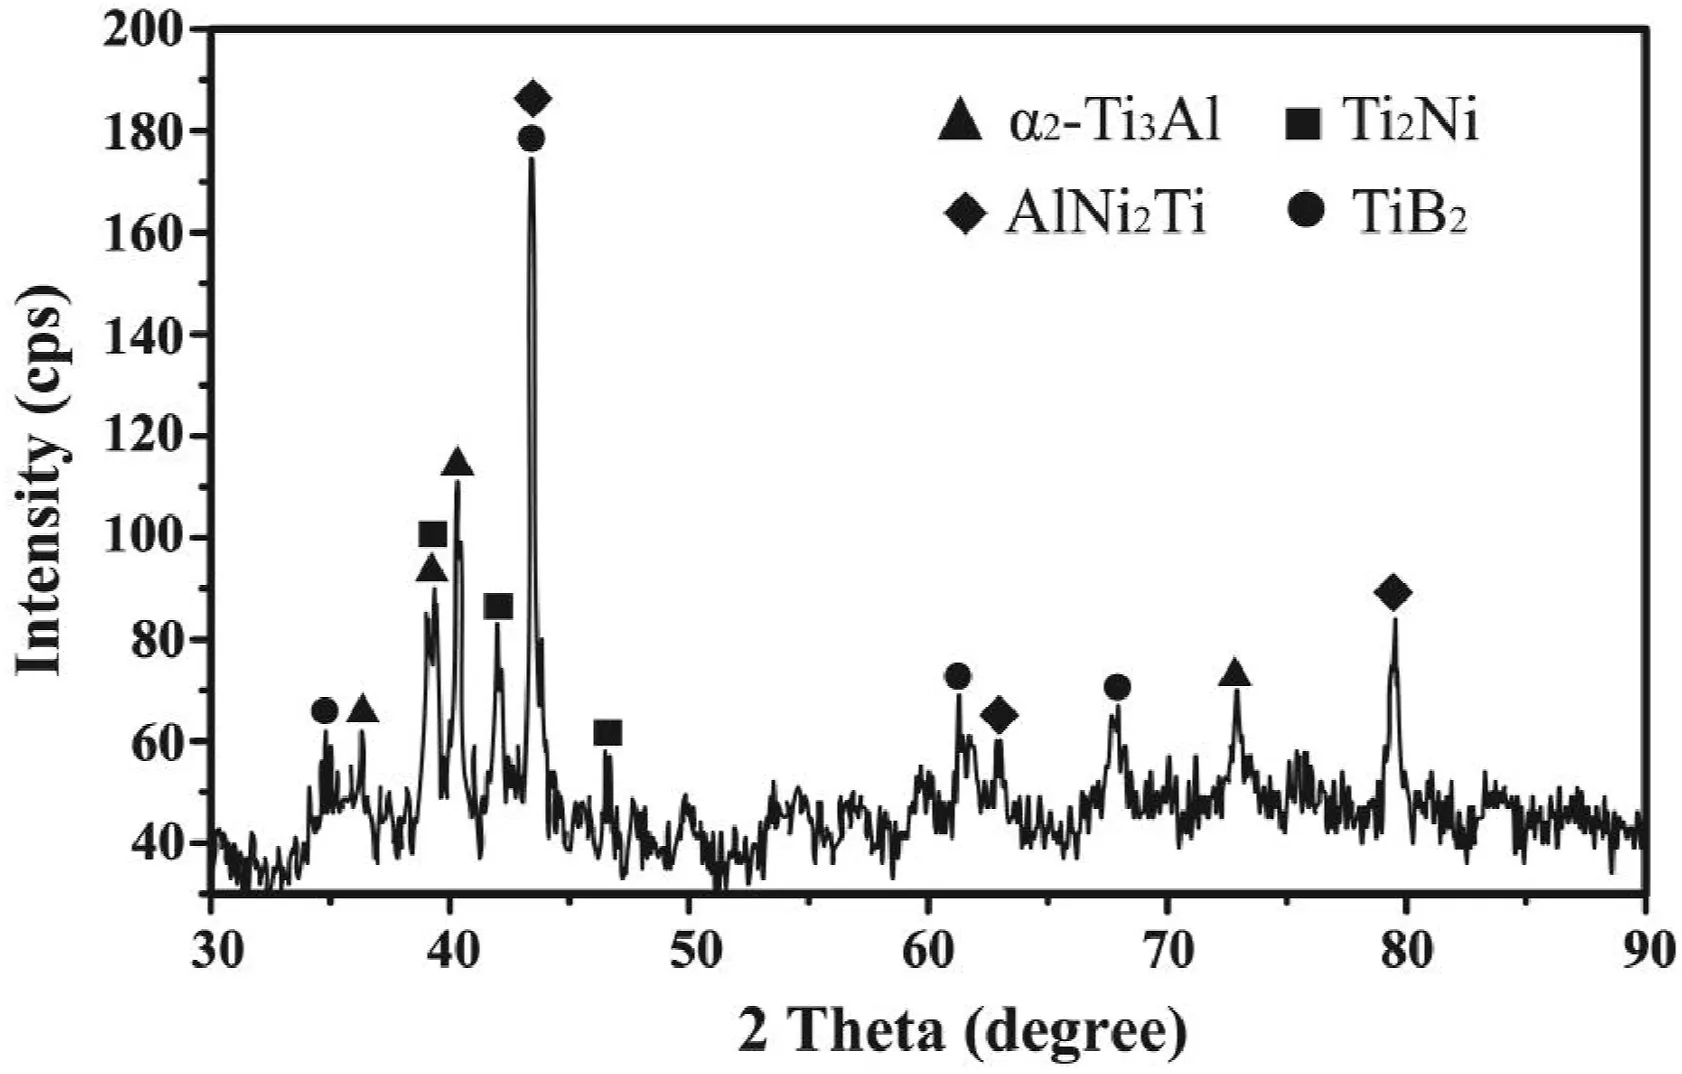
Fig.6.XRD pattern of the surface at Ti2AlNb side of the specimen brazed at 1283 K/10 min.
In addition,according to Fig.3,the concentration peak of element Ni was visible and the valleys of Ti and Nb were observable in layer“12”,which is in line with the results in Table 2.Based on the proportion of elements Al,Ni and Ti,the phase in layer“12”is identified as AlNi2Ti compound.Both the corresponding XRD pattern (Fig.6) and selected area electron diffraction results(Fig.7a)further confirm the presence of AlNi2Ti with a body-centred cubic structure (a=0.303 nm).
Fig.4e demonstrates that element B was enriched in layer“13”and its concentration was much higher than other areas.Meanwhile,more Ti atoms were detected in this zone than that in layers“11”and“12”(Fig.4b).On the contrary,the concentration valley formed for element Ni.As presented in Fig.6,the XRD peaks associated with TiB2phase is labeled.Furthermore,the presence of TiB2with a hexagonal structure(a=0.331 nm,c=0.320 nm)is confirmed through selected area electron diffraction analysis result(Fig.7d).The phase in layer“13”is deduced to be TiB2.According to previous study about the brazing of Ti3Al alloy with NiCrSiB filler metal[21],the Gibbs free formation energy(J/mol)of TiB2through the equation of Ti+2B→TiB2is about -346.95 kJ/mol.It is meaning that the reaction between element Ti and B is easy and spontaneous.Therefore,element B was enriched in layer“13”.In addition,during the transient liquid phase (TLP) bonding of γ-TiAl intermetallic compound to IN718 Ni-based superalloy using a Ni–7Cr–3Fe–4.5Si–3.2B(wt.%) filler metal,reaction layers Ti2Ni,AlNi2Ti and TiB2phase were also confirmed[22].
Additionally,the composition in microzone“14”(Fig.2d)is listed in Table 2.According to the Ni–Cr binary alloy phase diagram[23],Ni2Cr can be formed under the content of Cr 25–36 at.%.Therefore,Ni–Cr phases can’t be formed for the content of Cr 5.107 at.%.Besides,Ti2Ni,TiNi and Ni3Ti phases can be formed between elements Ti and Ni[23].In the Ni3Ti phase,the content of Ti is about 13.5%.Based on the content of Ti in microzone“14”,it is inferred that Ti–Ni phases were not present.Hence,the phase in microzone“14”,shown in Fig.2d,is considered to be γ solid solution,similar to microzone“1”.As mentioned above,a concentration peak of Cr occurred in microzone“15”(Fig.3).As presented in Fig.4d-f both elements B and Cr were enriched in this zone.Combining Table 2,microzone“15”is composed of γ solid solution,Ni3B and CrB.Fig.4g illustrates that different from microzone“14”,microzone“16”contains high concentration of Si.Similar to microzone“8”,microzone“16”consisted of γ solid solution and β1-Ni3Si.For the diffusion affected zone(”17”),element B was also detected in this area(Fig.4e).The blocky and needle-like precipitations should be borides.Due to the difference in dwell time,the interfacial microstructure (”2–4”) in Fig.2a is distinct from others(”15”,“16”in Fig.2d).
4.Discussion
The formation of microzones“15”and“16”in Fig.2d could be explained through transient liquid phase (TLP) bonding mechanism.During the bonding process,the NiCrFeSiB alloy melts and forms a liquid zone when the temperature is higher than its liqiudus temperature.Rapid inter-diffusion of alloying elements occurs between the liquid zone and GH536 substrate.The nickel base metal subsequently dissolves into the liquid NiCrFeSiB alloy and volume of liquid zone increases.This changes the compositions of the liquid phase and solid base metal [24].The increase of liquid volume continues until a local solid-liquid equilibrium is created [25].Further diffusion of alloying elements especially melting point depressants (MPD) Si and B between the liquid phase and nickel base metal raises the liqiudus temperature of the liquid phase to the bonding temperature,and then isothermal solidification starts from the solid/liquid interface towards the joint centre.The zone marked by“16”in Fig.2d is the isothermal solidification zone(ISZ).
During the isothermal solidification process,the solid/liquid interface does not meet any super cooling and non-equilibrium segregation of solute elements cannot occur.As a result,the phase formed in ISZ is solid solution phase and the formation of secondary phases is basically prevented [26].However,secondary phases can precipitate during subsequent cooling process.It should be noted that the content of Si in microzone“16”(Fig.2d)is 10.497 at.%,as shown in Table 2.According to Ni–Si binary diagram,the maximum solubility of Si in Ni is about 15.8 at.% at eutectic temperature 1416 K [27].However,the solubility at room temperature is only about 8 at.% [28].Ni-rich silicide (β1-Ni3Si)might be formed through a solid-state precipitation reaction during cooling process [29].Therefore,the phases in microzone“16”(Fig.2d)should be γ solid solution and β1-Ni3Si phase,which is similar to that in microzone“4”.The dispersion strengthening for the γ solid solution can be achieved by the presence of β1-Ni3Si phase,which is beneficial to the joint strength.
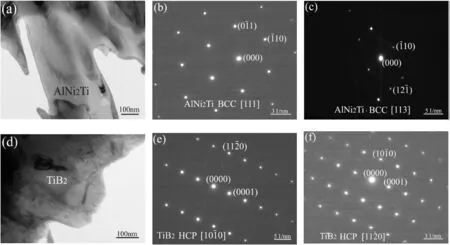
Fig.7.(a) TEM micrograph of AlNi2Ti phase;(b) SAED pattern of AlNi2Ti phase ([111]);(c) SAED pattern of AlNi2Ti phase ([113]);(d) TEM micrograph of TiB2 phase;(e) SAED pattern of TiB2 phase ([100]) (f) SAED pattern of TiB2 phase ([110]).
If the joints are cooled down before the completion of isothermal solidification process,the remained liquid will be subjected to athermal solidification during cooling process.Based on Ni–B binary diagram the solubility and partition coefficient of B in Ni is about 0.3 at.%and 0.008 at.%,respectively [23].Thus,element B is rejected into liquid with solidification progressing and little B is residual in microzone“16”.The liquid will be enriched by boron gradually and its composition is shifted towards eutectic composition.In ref.[25]about the TLP bonding of IN738LC and Nimonic 75 superalloys using Ni–15Cr–3.5B (wt.%) filler alloy,it was demonstrated that due to boron enrichment,liquid phase transformed to γ-eutectic and Ni-rich boride(Ni3B)at 1315 K.Moreover,based on the simulation of the solidification behavior of residual liquid during TLP bonding of nickel-based superalloy with Ni–Cr–B ternary filler metal,Ohsasa et al.[30]pointed out that γ solid solution formed as the primary phase,then the eutectic reaction L→γ+Ni3B occurred at 1315 K,and solidification was completed with a ternary eutectic reaction L→γ +Ni3B+CrB at 1270 K.
For the joint in Fig.2d,eutectic constituents(γ+Ni3B)is believed to have formed in microzone“15”in Fig.2c before cooling because the bonding temperature (1283 K) is lower than the eutectic temperature(1315 K).As Fig.4e and f indicated,the distribution of element Cr is in good agreement with that of B.CrB phase might be formed in microzone“15”(Fig.2d) and solidification is completed with the ternary eutectic reaction L→γ+Ni3B+CrB at 1270 K during cooling process.Due to the formation of CrB phase,element Cr was enriched in microzone“15”.Based on the discussion,it is speculated that microzones“2”and“3”in Fig.2a formed through isothermal solidification process,and the formation of microzone“4”can be attributed to athermal solidification process.
For the DAZ(microzone“17”in Fig.2d)adjacent to GH536 substrate,element boron was detected.EPMA map scanning result in Fig.4e also shows that boron was enriched in this zone,signifying that element boron was diffused from molten filler alloy into the base metal.Moreover,the elements Cr,Fe and Mo in GH536 substrate are strong boride formers.When the boron concentration exceeds the solubility limit in base metal,the borides will precipitate there[31].Thus,it is speculated that the blocky and needle-like second phases are considered to be borides precipitated within γ matrix.
In the standard models of TLP bonding process[32,33],it is assumed that the liquid-solid equilibration and solid-state diffusion processes happen sequentially,and solid-state diffusion of elements takes place under equilibrium conditions.Gale et al.[34]confirmed that secondary precipitates formed in base metal before the local equilibrium was established at solid/liquid interface,indicating the occurrence of the solid-state diffusion of element boron into base metal before the completion of dissolution process.Actually,the diffusion of B proceeds continuously and the solid-liquid equilibrium cannot be maintained.It can be seen in Fig.5e,element B was detected in the GH536 base metal.Nevertheless,little B was found in the isothermal solidification zone(microzone“16”in Fig.2d).This means that before the beginning of isothermal solidification process the element boron has been diffused into GH536 base metal and then borides precipitate.
In addition,according to the standard models of the TLP bonding process [32,33],further diffusion elements break the solid-liquid equilibrium and then isothermal solidification occurs.Within the present joints,the isothermal solidification zone (ISZ) should connect to the GH536 base metal.In Fig.2,microzones“4”and“16”,which consists of γ solid solution and β1-Ni3Si,were the ISZ.However,different from microzone“4”,the phase in microzone“2”was γ solid solution.On the one hand,it did not connect to the GH536 base metal.On the other hand,the compositions of microzones“2”and“4”indicate that the melting point of the former was higher than that of the latter.Microzone“2”solidified prior to microzone“4”.The base metal dissolution behavior and element inter-diffusion process are complicated.These might lead to the melting point increase of some areas in the liquid phase.As a consequence the solidification behavior has already proceeded probably before the solid-liquid equilibrium.
Based on the present experiment results and discussion,some phenomena are deserved to be concluded.Three stages in the standard models of TLP bonding process:base metals dissolution,isothermal solidification and solid state homogenization do not occur in sequence,there are no boundaries among them.Isothermal solidification does not only happen at the solid/liquid interface adjacent to base metals.And the solidification behaviors possibly firstly occurred within the liquid phase before the base metal dissolution process finished.The elements interdiffusion is always present during the bonding process,and secondary phase will precipitate when the concentration exceed the solid solubility limit in matrix.Secondary phase precipitation might happen ahead of the end of base metals dissolution or isothermal solidification process.
In order to describe the brazing process intuitively,a simplified schematic diagram of the microstructure evolution was proposed in Fig.8.When the temperature reached about 1256 K,the NiCrFeSiB brazing filler began melting and meanwhile the base metals partially dissolved into the liquid brazing filler.Due to the concentration gradient,elements Si and B in the brazing filler diffused towards the two base alloys and element Ni mainly diffused to the Ti2AlNb substrate(Fig.8a).In the meantime the diffusion phenomenon of elements Ti,Nb,Ni,Fe and Cr from the base metals into the brazed seam also occurred.
Along with the elements diffusion between NiCrFeSiB brazing filler and base metals,metallurgical reaction happened,and some phases and even reaction layers formed,as shown in Fig.8b.Owning to the diffusion of Ni and B towards Ti2AlNb substrate,phases Ti2Ni,AlNi2Ti and TiB2were visible adjacent to Ti2AlNb side.Meanwhile,element B diffused into Ni-based superalloy,then blocky and needle-like borides precipitated within this base metal.In addition,γ solid solution with low content of Si and that with high content of Si formed through isothermal solidification process.Element B were rejected into liquid phase.During the cooling process,Ni3B and CrB were solidified and β1-Ni3Si precipitated within the γ solid solution with high content of Si.

Fig.8.Schematic diagram of the microstructure evolution process:(a)Ni–7Cr–3Fe-4.5Si–3B filler melting and atomic diffusion,(b) formation of reaction phases,(c) evolution of reaction phases.
If the dwell time at the brazing temperature was prolonged,more sufficient element diffusion occurred so that more liquid phase solidified through isothermal solidification process.Thus few Ni3B and CrB phases formed through athermal solidification process in the joint centre,as shown in Fig.8c.
5.Mechanical properties of Ti2AlNb/GH536 joints
Fig.9a shows the average tensile strengths of the Ti2AlNb/GH536 joints as a function of dwell time with the brazing temperature fixed at 1283 K.All the joint strengths at room temperature were above 350 MPa.Particularly,the dwell time of 10 min offers the maximum strength of 425 MPa.For the test results at 923 K,the average strengths of joints under the brazing condition of 1283 K/3–5 min reached up to 373 MPa.However,with the dwell time prolongation the strengths at 923 K decreased gradually.When the brazing time was 10 min,the average joint strength at 923 K was 310 MPa.
In previous studies,laser welding was also used to join Ti3Al-based alloy to Ni-based superalloy with a titanium interlayer as filler,but the tensile strength of the dissimilar joint was only 177 MPa at room temperature[35].Chen et al.studied the arc welding between the two parent metals with gradient fillers and the obtained joint tensile strength was 353 MPa[36].Concerning the brazing method,Ag–21Cu–25Pd[19]and Au-17.5Ni[37](wt.%)filler metals was applied to join Ti3Al to Ni-based superalloy.Even the joint tensile strengths at room temperature reached above 400 MPa,the strengths at 923 K were 158 MPa and 314 MPa for Ag–21Cu–25Pd and Au-17.5Ni filler metals respectively,obvious lower than the present results.
The micro-hardness profile along the joint brazed at 1283 K for 10 min was displayed in Fig.9b.In general,the whole joint exhibited a higher micro-hardness than the two parent materials.From the right side of Fig.9b,the micro-hardness was gradually increased.At the interface adjacent to the Ti2AlNb alloy,the micro-hardness reached the maximum value of 1200 HV.The corresponded phase constituent in this area included Ti2Ni,AlNi2Ti and TiB2.Based on previously reported data,the hardness values of Ti2Ni and AlNi2Ti were 700 HV [38]and 14.1 GPa(1438 HV)[39],respectively.And that of the pure TiB2ceramic reached up to 34 GPa [40].Thus these reactive layers resulted in a high micro-hardness.
Fig.10a presented the fracture surface(Ti2AlNb side)of the Ti2AlNb/GH536 joint.Two kinds of typical fracture characteristics were visible at the surface.Based on the EPMA analyzed results(Table 3)the square“1”could be identified as Ti2Ni phase dissolved with Ni and Nb(microzone“11”in Fig.2d),whereas the square“2”should be the mixture of Ti2Ni and TiB2phases(corresponded to microzones“11”and“12”in Fig.2d).Furthermore,Fig.10b presented the cross section of the fracture surface.The joint fractured in TiB2phase and the interface between Ti2Ni and AlNi2Ti phases.In other words,the joint high-hardness area is the weak link.Fig.10c presents the total thickness of reactive layers Ti2Ni,AlNi2Ti and TiB2in Ti2AlNb/GH536 joints in Fig.2.With the prolongation of brazing time,the total thickness increased obviously.Furthermore,the high-hardness area increased the joint brittleness and deteriorated the joint strength.

Table 3 Compositions of the regions marked by squares in Fig.10a,at.%.
6.Conclusions
(1) Sound Ti2AlNb/GH536 joints have been achieved at 1283 K for 3–15 min using Ni–7Cr–3Fe–4.5Si–3B (wt.%) filler metal.The brazed seam dominated by γ solid solution can be obtained.Disperse β1-Ni3Si particles with a size of about 0.5 μm precipitate within the γ matrix,and β1-Ni3Si blocks have been detected within γ solid solution.Ni3B and CrB phases with a thickness of about 0.5 μm form through ternary eutectic reaction.Three kinds of reaction layers,Ti2Ni(Al,Nb),AlNi2Ti and TiB2,with a thickness of 2.7–5.6 μm are also visible in the joint adjacent to Ti2AlNb base metal and result in a high hardness value.
(2) The average tensile strength of all the joints is above 350 MPa at room temperature,in which the joints brazed at 1283 K/5 min exhibit the maximum strength of 425 MPa at room temperature and 373 MPa at 923 K.
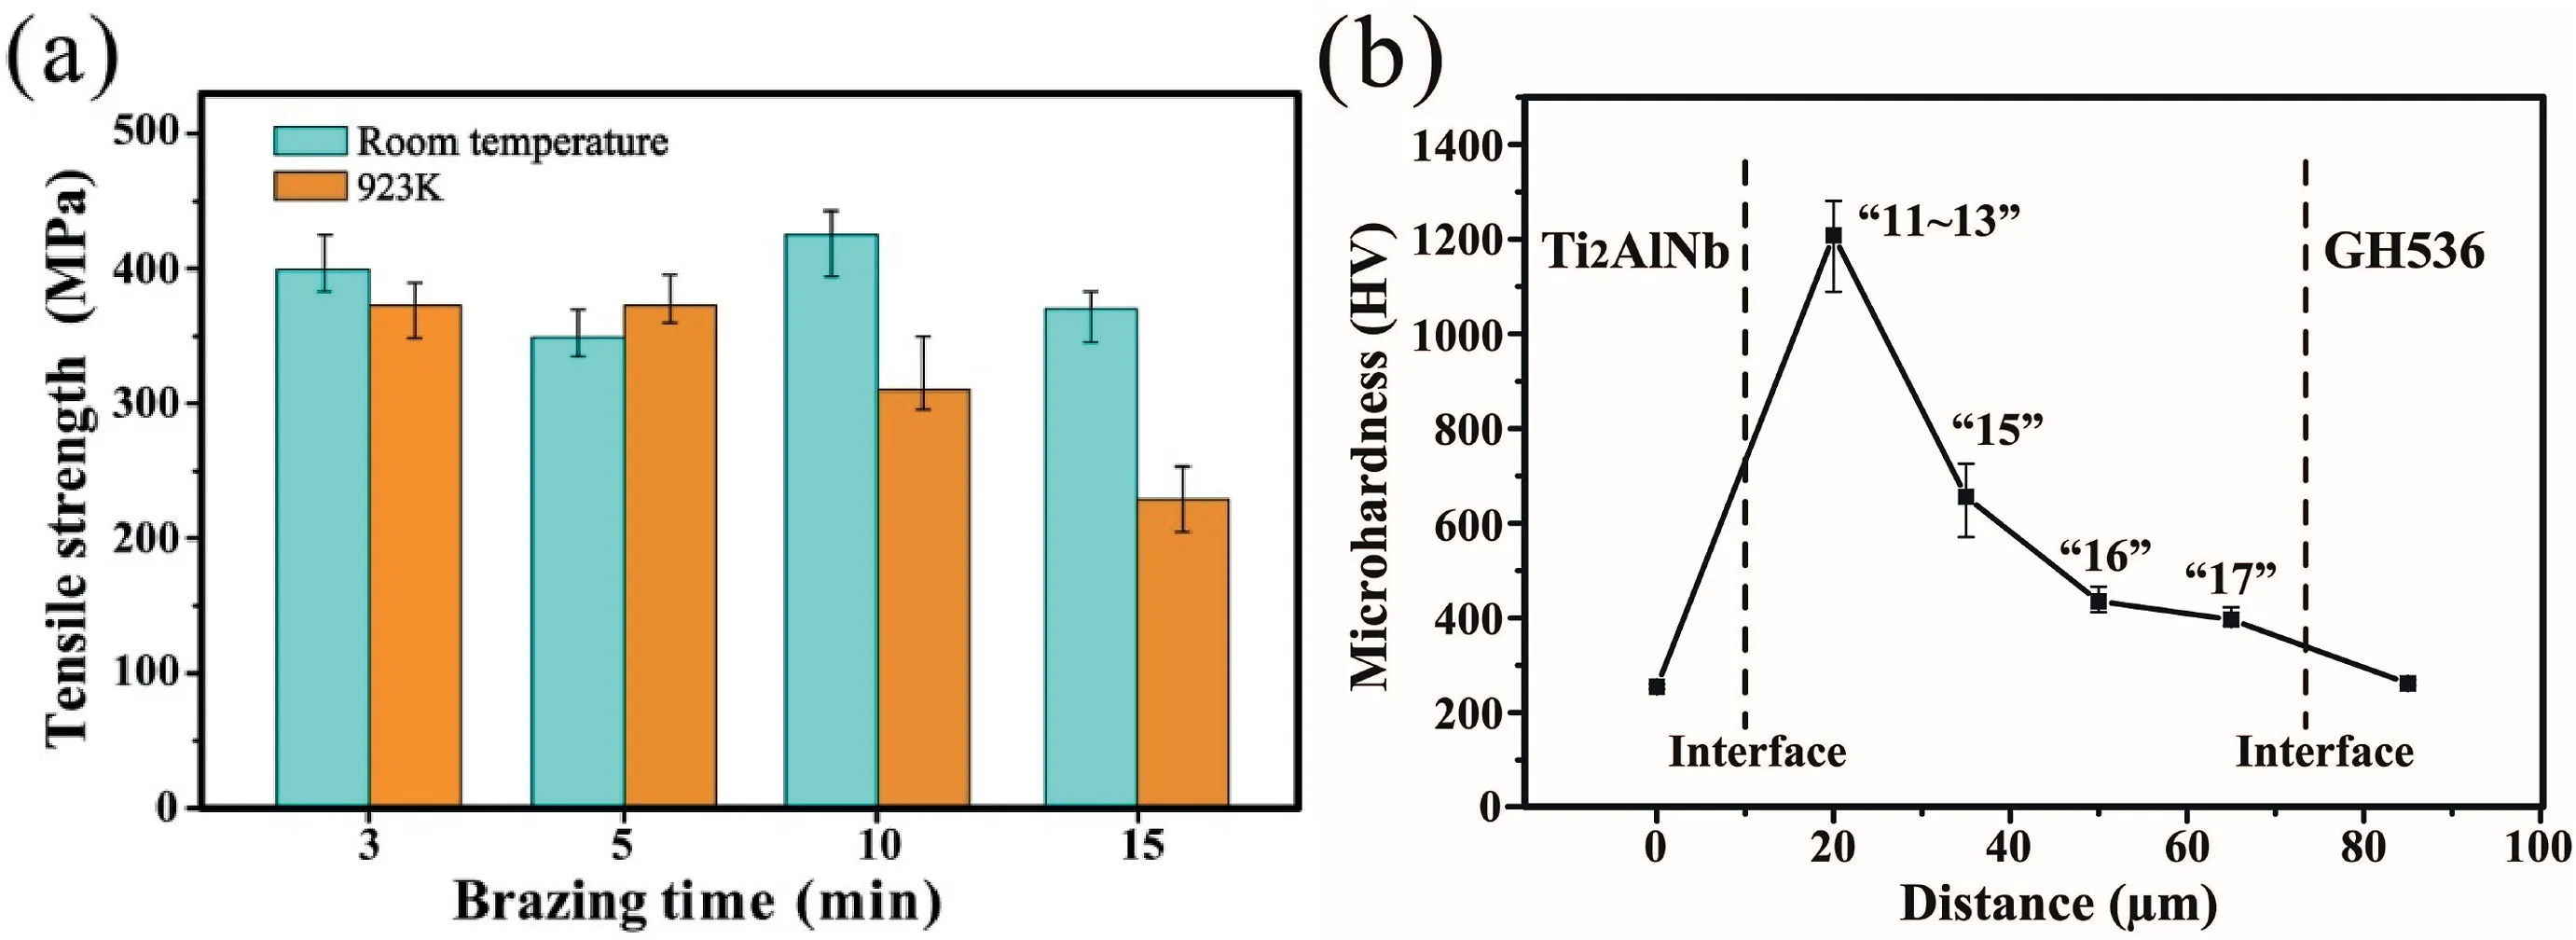
Fig.9.(a) Effect of brazing time on the tensile strengths of Ti2AlNb/GH536 joints;(b) Vickers micro-hardness profile across the joint shown in Fig.2d (1283 K/10 min).

Fig.10.Fracture surface(Ti2AlNb side)(a)and cross section(b)of the joint brazed at 1283 K/10 min;(c)Total thickness of reactive layers Ti2Ni,AlNi2Ti and TiB2 in Ti2AlNb/GH536 joints.
(3) γ solid solution forms through isothermal solidification process.Except the solid/liquid interface adjacent to base metals,isothermal solidification behaviors also occur within the liquid phase in joint centre.The element inter-diffusion always presents during the bonding process,and secondary phase borides precipitate within Ni-based superalloy before the end of base metal dissolution or isothermal solidification processes.
Declaration of competing interest
The authors declare that they have no known competing financial interests or personal relationships that could have appeared to influence the work reported in this paper.
Acknowledgements
This research work was sponsored by the National Natural Science Foundation of China (No.51705489,51671008),Preliminary Research Project (No.JCKY2016220C003),Beijing Municipal Science and Technology Commission(No.Z171100002217048)and State Key Laboratory of Advanced Brazing Filler Metals and Technology (No.SKLABFMT201603).
 Progress in Natural Science:Materials International2021年2期
- Progress in Natural Science:Materials International的其它文章
- Introduction to Progress in Natural Science:Materials International
- Effect of superplastic deformation on precipitation behavior of sigma phase in 3207 duplex stainless steel
- Hydrothermal synthesis of hydroxyapatite coating on the surface of medical magnesium alloy and its corrosion resistance
- Reversible hydrogenation of AB2-type Zr–Mg–Ni–V based hydrogen storage alloys
- Influence of γ’ precipitate on deformation and fracture during creep in PM nickel-based superalloy
- Tuning microstructure,transformation behavior,mechanical/functional properties of Ti–V–Al shape memory alloy by doping quaternary rare earth Y