Microstructure evolution and mechanical properties of a hot-rolled Ti alloy
Xinjie Zhu ,Qunbo Fan,* ,Xin Liu ,Hong Yu ,Duoduo Wang
a School of Materials Science and Engineering,Beijing Institute of Technology,Beijing,100081,China
b National Key Laboratory of Science and Technology on Materials Under Shock and Impact,Beijing Institute of Technology,Beijing,100081,China
c Beijing Institute of Technology Chongqing Innovation Center,Chongqing,401135,China
Keywords:Titanium alloys Microstructure evolution Mechanical properties Hot rolling
ABSTRACT The microstructure evolution and mechanical properties of a hot-rolled Ti-5.1Al-2.5Cr-0.5Fe-4.5Mo-1.1Sn-1.8Zr-2.9Zn titanium alloy sheet along the thickness direction were investigated.The results indicated that the hotrolled titanium alloy sheet presented different microstructures along the thickness direction owing to the uneven distribution of stress and temperature during the hot rolling.The grains in central region underwent a larger deformation,leading to relative complete grain fragmentation and the formation of fine grains.During the air cooling process followed by hot rolling,the fraction of α phase precipitated in the central region was lower than that in the regions near the surface of the sheet.During hot rolling process,more deformation energy transformed to thermal energy and lower cooling rate in the central region promoted the α→β phase transformation,resulting in the increasing of the dynamic recrystallization in the β phase.By contrast,the dynamic recrystallization for α phase decreased.Distinct {0001}α and {001}β textures were observed,and these textures were markedly strengthened with the increasing distance from the central region.Due to the softening induced by dynamic recrystallization and the strengthening by concentrated dislocations,the surface of the sheet exhibits highest yield strength and lowest elongation.
1.Introduction
Titanium alloys are widely used in many different applications for their advantageous corrosion resistance [1,2],high strength-to-weight ratio and low density.One example is the α+β type titanium alloy applied in the compressor discs and blades of aeroengines [3].These excellent properties for titanium alloys are closely related to the technological process of rolling or forging.Among these processes,the advantage of the rolling process is obvious for its low cast and convenience.During the rolling process,the titanium alloy deforms acutely and the microstructure and mechanical properties can be modified via adjusting the rolling parameters,such as strain rate [4-8],strain path[9-11],thickness reduction [12-14] and controlling the rolling temperature [4,12,15,16].However,the deformation of titanium alloys is inhomogeneous,especially in the thickness direction.
Research on the microstructure evolution along the thickness direction of rolled titanium alloys has attracted the attention of many scholars.Previous researches indicated that during sub β-transus and (α+β) processing of Ti-6Al-4V alloys [17,18],the disharmonious deformation of the microstructure formed in some macro-regions for the α-colony orientations.Sander [19] proposed that the through-thickness texture and microstructure gradients were strengthened with a thickness reduction increase from 50%to 90%,which primarily was caused by the presence of shear deformation near the surface.Chen[20]also supported this point of view based on the investigation on the textural evolution and dynamic recrystallization(DRX)of a hot-rolled β-titanium alloy with different deformations.Although the variety of the microstructure in the thickness direction of the rolled titanium alloy sheets has been investigated directly and indirectly,the law of microstructure distribution along the thickness direction is neither clear nor quantitatively studied.It is believed that the variation of the microstructure parameters has a significant effect on the mechanical properties of hot-rolled titanium alloy sheets.In addition,the inhomogeneous microstructure seriously affects the mechanical properties and the service life of titanium alloys.Therefore,it is of great significance to study the microstructure distribution along the thickness direction of hot-rolled titanium alloy sheets.
In this study the variation of the microstructure parameters,including the grain size,the fraction of α and β phases,DRX and texture characteristics,along the thickness direction of a hot-rolled Ti-5.1Al-2.5Cr-0.5Fe-4.5Mo-1.1Sn-1.8Zr-2.9Zn titanium alloy sheet is investigated,and the influence of microstructure on the mechanical properties discussed.
2.Materials and experimental
The original material was a near β-type as-cast titanium alloy ingot with a size of Φ470 mm,prepared by the method of triple vacuum consumable arc melting.The nominal composition of the titanium alloy is shown in Table 1.The β-transus temperature (Ttrans) for this titanium alloy was measured to be 985± 5°C by a metallographic method.

Table 1 Nominal composition of alloy.
To investigate the microstructure distribution along the thickness direction of the hot-rolled titanium alloy sheet,a 60 mm-thick as-cast titanium alloy ingot was machined from the original material by wirecutting technology.The microstructure in the central region of the 60 mm-thick as-cast titanium alloy ingot consisted of β phase and lamellar α phase with an average width of 1.8 μm distributed at β phase boundaries,exhibiting obvious feature of Widmanst¨atten structure.The corresponding phase fractions of α and β phases were about 82.4% and 17.6%,respectively.The as-cast ingot was hot rolled at room temperature after soaking at 970°C for 1 h.The temperature of alloy was 970°C at the beginning of rolling and 870°C at the end of rolling.After hot rolling by nine passes,followed by air cooling,a 20-mm thick hot-rolled titanium alloy sheet with a reduction of 66.7% in the thickness direction was achieved.
The specimens for microstructure observation and quasi-static tensile testing were machined from the center to the surface of the hot-rolled titanium alloy sheet along the normal direction(ND),and the loading direction was parallel to rolling direction(RD).Fig.1 shows the schematic of the locations of the samples,i.e.,at the center(S0,labeled as 1#),the 2/5(S0.4,labeled as 2#)and 4/5(S0.8,labeled as 4#)of the 1/2 rolled sheet thickness,respectively.
The microstructures of the RD-ND plane of the hot-rolled titanium alloy sheet were characterized via EBSD technology with a step size of 0.14 μm.In order to further understand the influence of the microstructure distribution along the thickness direction on mechanical properties,the geometrically necessary dislocation (GND) density was also calculated via EBSD technology by analysis of the lattice curvature measured through Nye's tensor [21].The specimens for EBSD investigation were prepared by electropolish(25°C,25 V,~30 s and solution:6%HClO4,34%CH3(CH2)3OH and 60%CH3OH)to eliminate the surface stress in order to achieve the surface quality.A Nova NanoSEM 430 field emission gun scanning electron microscope (FEI,Hillsboro,MO,USA)was operated at 20 kV.The tensile tests were performed on an Instron 5985 testing machine(Instron®,Norwood,MA,US)at room temperature,at a strain rate of 10-3/s.
3.Results and discussion
3.1.Grain size distributions along the thickness direction
The microstructures of the three specimens and corresponding statistic relative frequency distribution of the grain size and aspect ratio in α phase via EBSD(the EBSD scanning area is limited in a red frame with a size of 55 μm×55 μm)are shown in Fig.2.It can be seen that the average grain size (A) and aspect ratioof α grains in the central region are 1.68 μm and 1.96,respectively,as shown in Fig.2(a).In the position of S0.4,the average grain size and aspect ratio of α grains are 1.88 μm and 1.86,respectively,as shown in Fig.2(b).When S0.8,the average grain size and aspect ratio of α grains increase to 1.98 μm and 2.11,respectively,as shown in Fig.2(c).
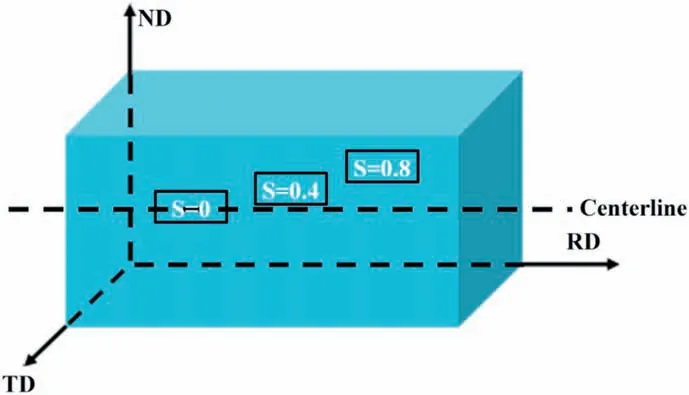
Fig.1.Schematic of the sampling of investigated areas.
The above analysis shows that α grains are refined with the decrease of distance from the central region,leading to the inference that α grains undergo more deformation compared to those in the regions near the surface.Moreover,the variations of deformation degree of grains along the thickness direction are closely related to the uneven distribution of stress[22,23].
3.2.Phase fraction distributions along the thickness direction
The phase distribution maps of α and β phases in the specimens observed from the transverse direction(TD)are shown in Fig.3,in which α and β phases are depicted as red and blue,respectively.It is interesting to see that the phase fraction changes obviously along the thickness direction.The fractions of α and β phases in the specimens are summarized as follows:S0:65.6%for α phase and 34.4%for β phase(Fig.3(a));S0.4:86%for α phase and 14%for β phase(Fig.3(b));S0.8:92.4%for α phase and 7.6%for β phase(Fig.3(c)).This indicates that the fraction of α phase increases with increasing distance from the central region,which may be correlated to the distribution of temperature along the thickness direction of the titanium alloy during hot rolling.
Soaking at 970°C for 1 h helps to maintain a uniform thermal field in the titanium alloy before hot rolling.In the short time of taking the ascast ingot out of the furnace to the beginning of rolling,the surface cooling rate of as-cast ingot is higher than the internal cooling rate,resulting in a surface temperature lower than the internal temperature.In addition,the larger deformation in the central region promotes more plastic deformation work to convert into heat during hot rolling,which inevitably elevates the temperature sharply.Moreover,the rolling temperature at 970°C is close to the β-transus temperature(Ttrans985±5°C).Therefore,the temperature in the central region may exceed the Ttransand a significant amount of α phase transforms into the β phase,resulting in a lower fraction of α phase in the central region compared with that near the surface.
3.3.DRX and dynamic recovery along the thickness direction and intrinsic mechanism
The data of EBSD grain boundaries,grain boundaries in inverse pole figures and the corresponding misorientation distribution of the hotrolled titanium alloy sheet are shown in Fig.4.Fig.4(a)-(c) show the grain boundary maps of the specimens in the position of S0,S0.4 and S0.8,respectively,in which low-angle grain boundaries (<15°,LAGBs),high-angle grain boundaries (≥15°,HAGBs) and phase boundaries are depicted as red,black and blue lines,respectively.Fig.4(d)-(f)show the grain boundaries in the inverse pole figures,in which LAGBs are depicted as white lines while HAGBs and phase boundaries are depicted as black lines.Moreover,the column diagrams of the corresponding misorientation distribution are shown in Fig.4(g)-(i).
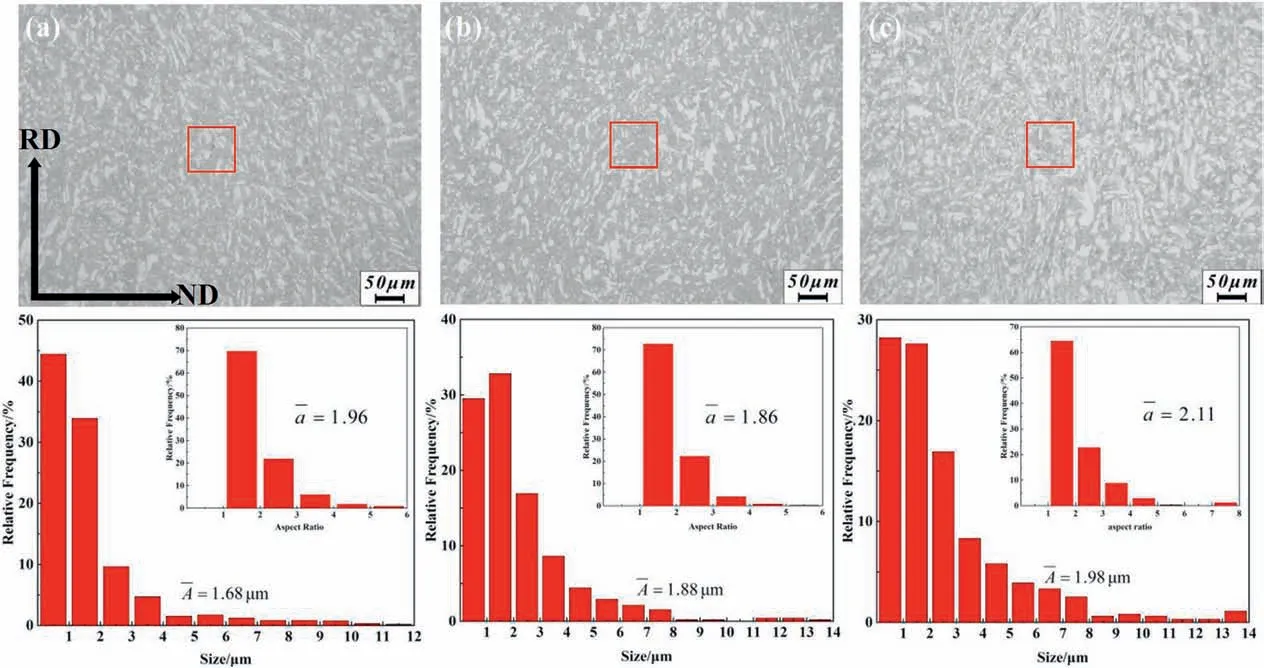
Fig.2.Microstructures and statistics of the grain size distribution in α phase of the hot-rolled titanium alloy sheet:(a) S 0;(b) S 0.4;(c) S 0.8.

Fig.3.Phase distribution maps of α and β phases:(a) S 0;(b) S 0.4;(c) S 0.8.
Based on the statistical data derived from Fig.4(a),the misorientation angle distribution of grain boundaries in the central region can be obtained and is displayed in Fig.4(g).The fraction of HAGBs in β phase is 23.4%.Moreover,the fraction of HAGBs in α phase is 27.2% and the transition from LAGBs to HAGBs is continuous.This indicates that dynamic recovery occurs mainly in β phase.In addition,relatively slight DRX also occurs in α phase.The misorientation angle distribution of grain boundaries in the position of S0.4 is obtained and displayed in Fig.4(h) based on the statistically derived data from Fig.4(b).The fraction of HAGBs in β phase is 8.4%,illustrating the occurrence of more intense dynamic recovery in β phase compared with that in the region of S0.Moreover,the fraction of HAGBs in α phase is 40% and the transition from LAGBs to HAGBs is continuous,indicating the occurrence of more intense DRX in α phase compared with that in the region of S0.The misorientation angle distribution of grain boundaries in the position of S0.8 is displayed in Fig.4(i) based on the statistical data derived from Fig.4(c).The fraction of HAGBs in β phase is 3.9%,illustrating the occurrence of extremely intense dynamic recovery in β phase.Moreover,the fraction of HAGBs in α phase is 49.9%and the transition from LAGBs to HAGBs is continuous.This indicates the occurrence of the most intense DRX in α phase compared with that in regions of S0 and S0.4.In contrast,the level of DRX in β phase in the region of S0.8 is the lowest among these specimens.
The above analysis indicates that the level of DRX in β phase increases,while it decreases in α phase,with the decrease of distance from the central region.In addition,the clearly decreasing number of the total DRX grains containing the DRX of α grains and the DRX of β grains from the central region to the surface indicates an overall decreasing trend of the DRX as shown in Fig.4(d)-(f).The levels of DRX in α and β phases along the thickness direction are exhibited more intuitively in Table 2,in which the symbol+represents the degree of DRX.

Table 2 Levels of DRX in different positions.
The increasing trend of DRX in α phase from the central region to the surface may be related to the allocation of the deformation energy accumulated during the hot rolling process and the variation of temperature.In the central region,the highest temperature leads to the most intense α→β phase transformation,which occupied most of the energy consisting of deformation energy and thermal due to the lower cooling rate in α phase,significantly weakening the DRX in α phase.With the increase of distance from the center region,the deformation energy descends down and the temperature becomes gradually lower.Therefore,the α→β phase transformation is inhibited and the driving force of DRX in α phase increases simultaneously,thus strengthening the DRX in α phase in the regions near the surface.
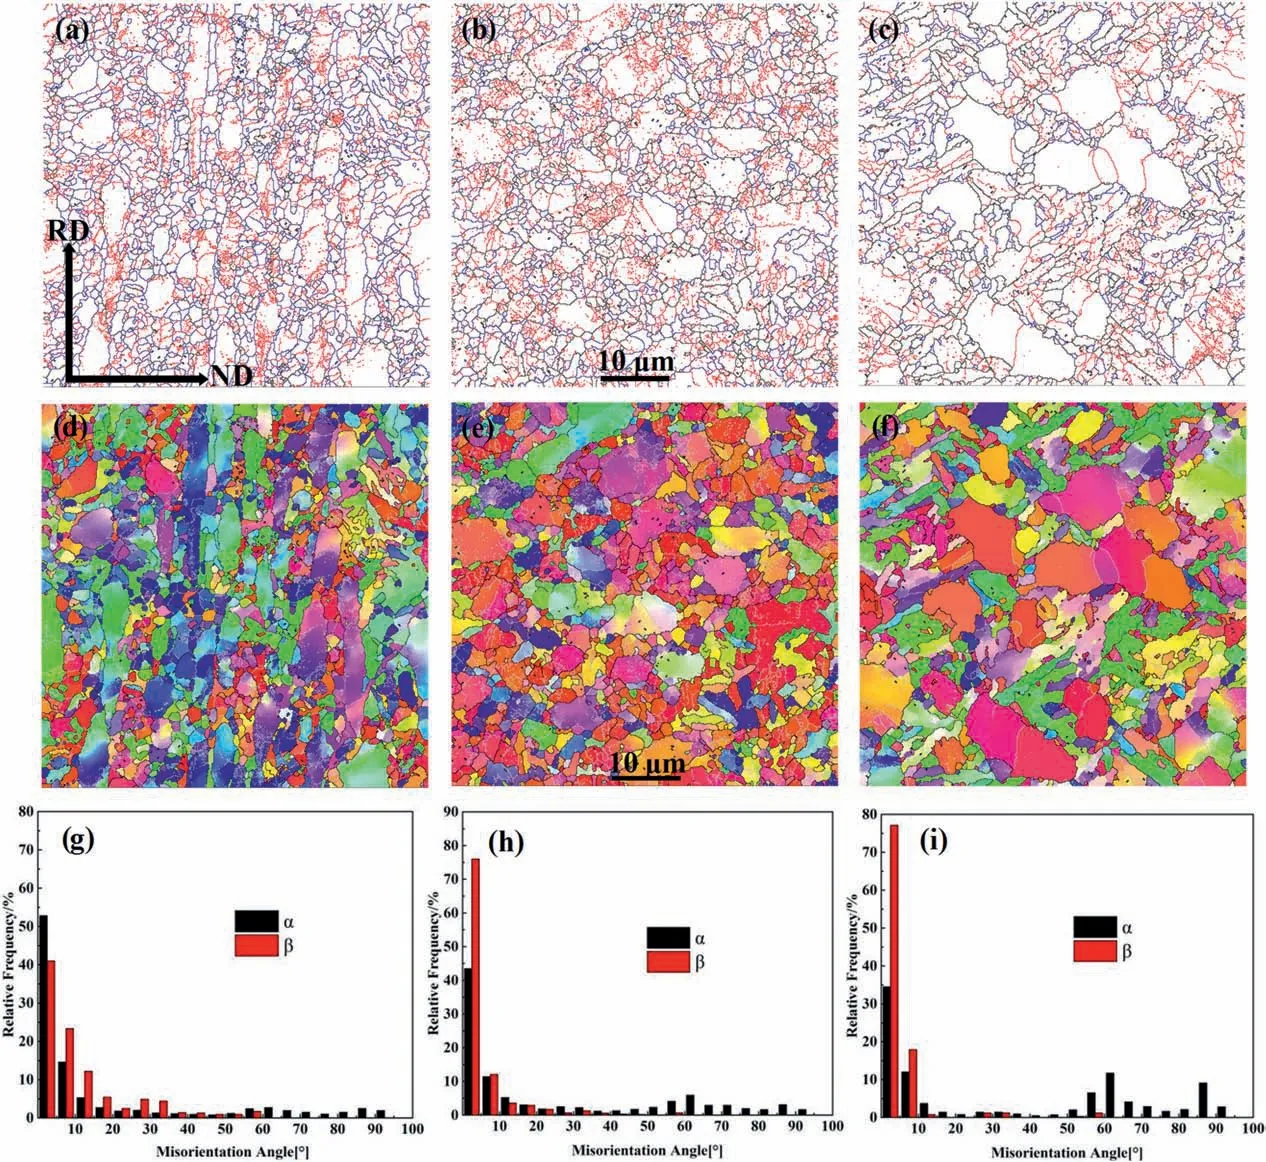
Fig.4.EBSD grain boundary maps,grain boundaries in inverse pole figures and corresponding misorientation distribution maps of the hot-rolled titanium alloy sheet:(a),(d),(g) S 0;(b),(e),(h) S 0.4;(c),(f),(i) S 0.8.
In addition,overall,the total DRX in the central region is obviously higher than that near the surface,as shown in Table 2.This is because the higher temperature and larger deformation in the central region provide more driving force for the total DRX.With the increase of distance from the central region,the driving force for the total DRX decreases,which makes the level of the total DRX decrease.Furthermore,the same trend of the DRX in β phase and the total DRX illustrates that the DRX in β phase is dominant in the total DRX.
3.4.Textures along the thickness direction
The microstructural orientation maps of α and β phases in the specimens observed from the TD are shown in Fig.5(a)-(f).The α and β phases gradually concentrate on some orientations with the increase of distance from the central region,such as the{0001}for the α phase and{001}for the β phase.
The pole figures of α and β phases in these specimens are shown in Fig.5(g)and(h),respectively.For α phase,the strongest texture locates in the{0001}pole figure compared to that in the{01-10}pole figure and the{-12-10}pole figure,as shown in Fig.5(g).In the central region(S0),the strength of the {0001}αtexture is 6.99.With the increase of distance from the central region,the strength of the {0001}αtexture increases to 11.29(S0.4) and 20.70(S0.8).
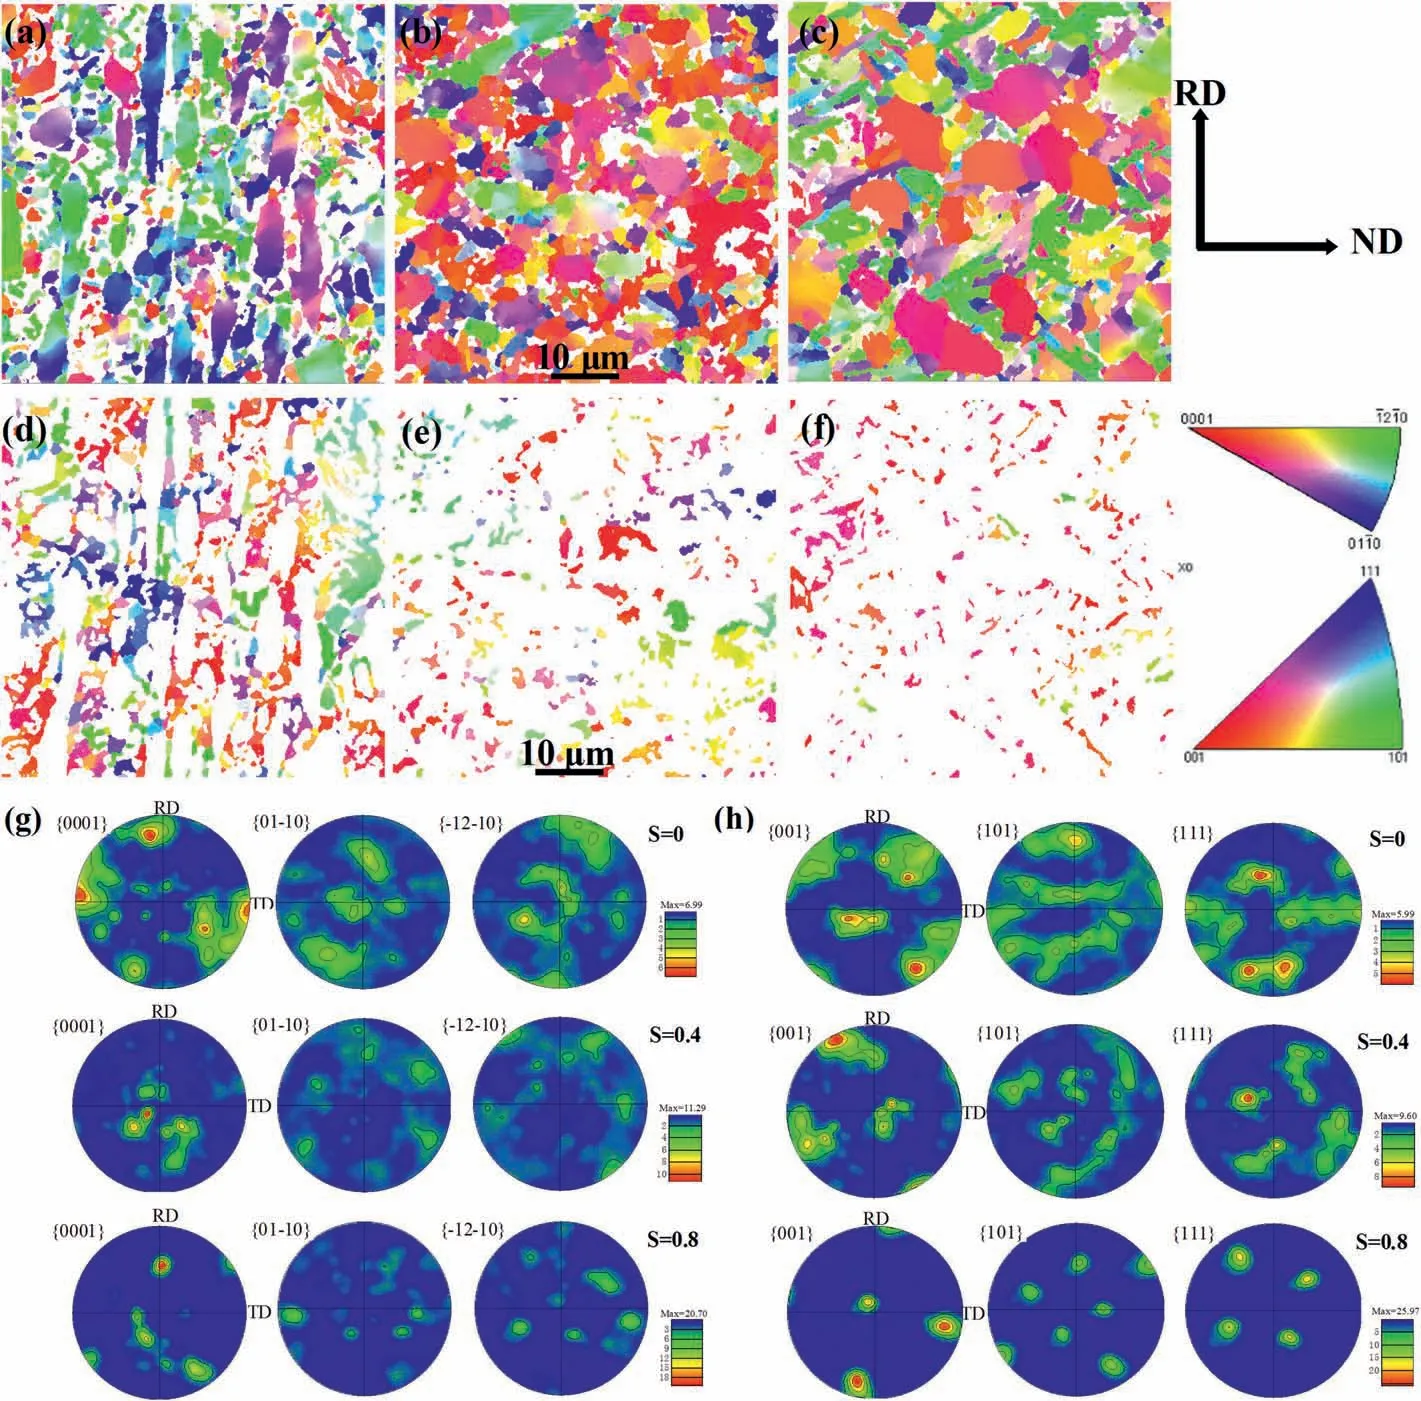
Fig.5.Orientation maps of specimens:(a)α phase and(b)β phase of S0;(c)α phase and(d)β phase of S0.4;(e)α phase and(f)β phase of S0.8;(g)and(h)pole figures of α phase and β phase in the hot-rolled titanium.
For β phase,the highest value of the texture mainly concentrated in the {001} pole figure compared to that in the {101} pole figure and{111}pole figure,as shown in Fig.5(h).In the central region(S0),the{001}βand{111}βtextures with a larger value of 5.99 compared to the{101}βtexture are found.In the position of S0.4,the strength of the{001}βand{111}βtextures is increased to a higher value of 9.60.In the region of S0.8,the {001}βtexture has the maximum value of 25.97,illustrating the formation of the unique preferred orientation in β phase.It can be summarized that the{0001}αand{001}βtextures are markedly strengthened with the increase of distance from the central region,which can be attributed to the inhomogeneous deformation of grains.
Due to the larger deformation of grains in the central region,the preferred orientation arrangement of grains formed in the early stage of the hot rolling process is disturbed,which weakens the texture in the central region.In contrast,the preferred orientation arrangement of grains near the surface is not seriously destroyed.Therefore,stronger textures are preserved in the regions near the surface of the hot-rolled titanium alloy sheet.
3.5.Relationship between mechanical properties and microstructural characteristics along the thickness direction
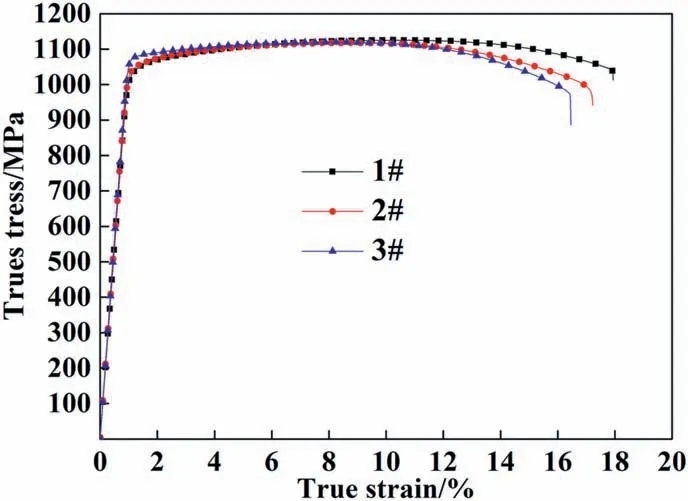
Fig.6.True stress-strain curves of specimens.
The true stress-strain curves of the three specimens are shown in Fig.6.It can be seen that the quasi-static tensile properties of the specimens are very similar,while a delicate difference exists among them.The 1#specimen exhibits the lowest yield strength(1035 MPa)with the highest elongation (17.9%).In contrast,the 3# specimen shows the highest yield strength (1075 MPa) with the lowest elongation (16.4%).Among them,the 2#specimen has moderate mechanical properties,and the yield strength and elongation are 1043 MPa and 17.1%,respectively.In addition,the yield strength and elongation show an opposite trend with the increase of distance from the central region.
The strength and ductility are related to the fractions of α and β phases and the levels of DRX.The results from our laboratory show that compared with α phase with hexagonal closed-packed(HCP) structure,the β phase with body-centred cubic(BCC) structure has higher strength[24,25].Therefore,theoretically,the strength will be weakened with increasing α phase fraction from the central region to the surface.However,in fact,the strength shows a weak increasing trend(from 1035 MPa to 1075 MPa) with increasing α phase fraction(from 65.6% to 92.4%).This may be related to the decreasing of softening effect of DRX[26,27],as shown in Fig.4 and Table 2,which counteracts the effect of α phase on strength.Furthermore,it is found in the present study that GND density might play a leading role in the variation of the quasi-static tension properties along the thickness direction.
Generally,the statistical data of the relevant GND density is obtained via the EBSD method by:
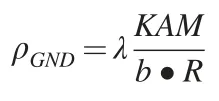
where λ is a constant that determined by the nature of edge or screw dislocations,the KAM values are given by the EBSD software,b is the magnitude of the Burgers vectors of dislocations and R is the kernel size taking into account the neighbor order considered in the KAM mapping.The GND density of these specimens are summarized as follows:S0:0.2984×10¹⁵/m2,0.1954×1015/m2for <a>dislocations and 0.1031×10¹⁵/m2for <c+a>dislocations;S0.4:0.3165×10¹⁵/m2,0.2011×1015/m2for <a>dislocations and 0.1154×10¹⁵/m2for <c+a>dislocations;S0.8:0.3616×10¹⁵/m2,0.2399×1015/m2for <a>dislocations and 0.1217×10¹⁵/m2for <c+a>dislocations.This suggests that the GND density increases gradually with the increase of the distance from the central region.
The diagram of yield strength and elongation varying with the total GND density is shown in Fig.7.Higher density dislocations exacerbate the dislocation accumulation and inhomogeneous deformation inducing the initiation of microcracks,resulting in the increase of the strength and the decrease of the ductility,which is consistent with the trend shown in Fig.7.In addition,the higher level of the DRX aggravating the softening of the titanium alloy reduces the strength.Therefore,the specimen in the central region with the lowest GND density and highest level DRX has the lowest yield strength while the highest elongation.In contrast,the specimen in the surface exhibits the highest yield strength while the lowest elongation due to the highest GND strengthening and lowest DRX softening.
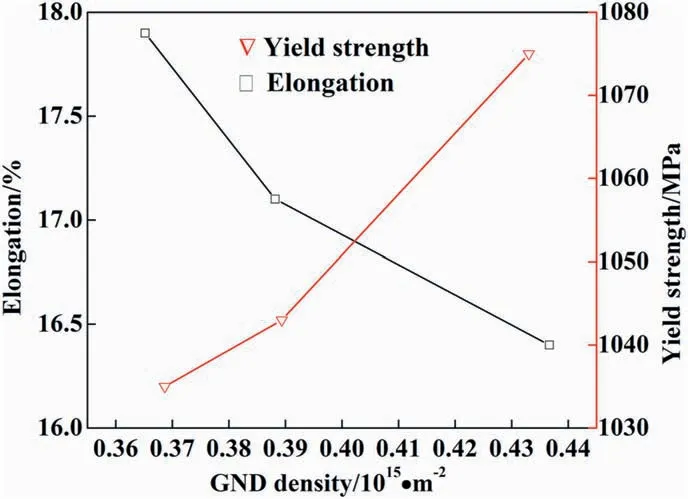
Fig.7.Yield strength and elongation as a function of GND density.
3.6.Evolution mechanism of microstructures during hot rolling process
Based on the above analysis regarding the variation of the microstructural details containing grain size,dynamic recrystallization,phase transformation and texture characteristics,the evolution mechanism of the microstructures along the thickness direction in the hot-rolled titanium alloy sheet is proposed and presented with a schematic diagram shown in Fig.8.Because of the symmetry of the microstructures to the central line during the hot-rolling process,the observation area is selected from the center to the surface of the titanium alloy,as shown in Fig.8(a).
The original microstructure of the specimen taken from the titanium alloy consists of coarse grains and grain boundaries,as shown in Fig.8(a).In the early stage of the hot-rolling process,the coarse grains are elongated first towards the rolling direction,and grains in the central region undergo greater deformation,resulting in a higher dislocation density compared with that in the regions near the surface,as shown in Fig.8(b).With the further increase of deformation,grains are further elongated towards the rolling direction,and the dislocation density in all regions increases distinctly.In this case,the dislocation density in the central region is much higher than that near the surface.Furthermore,the higher temperature induced by more deformation energy transforming to thermal energy and lower cooling rate in the central region promotes the DRX;therefore,DRX occurring in the α and β phases first appears in the central region,as shown in Fig.8(c).
In the last stage of the hot rolling process,a great number of elongated grains in all regions are fragmented into finer grains,especially in the central region.Moreover,the grain fragmentation disturbs the preferred orientation arrangement of grains concurrently,making the texture strength of α and β phases in the central region lower than that near the surface.At the same time,friction stress near the surface may weaken the strength of some textures [28],such as the {101}βtexture.In addition,the level of the total DRX is higher than that near the surface due to their more driving force of the total DRX in the central region.What should be noticed emphatically here is that the DRX in α phase exhibits an increasing trend with the increase of distance from the central region,which is not consistent with the theoretical prediction and contrary to that of the β phase,as shown in Fig.8(d).This phenomenon is attributed to the allocation of energy consisting of the accumulated deformation energy and thermal energy during the hot rolling process.With the increase of the distance from the center region,the deformation energy descends down and the local temperature becomes lower and lower gradually.Thus,the α→β phase transformation is inhibited,making the fraction of α phase increase correspondingly.Simultaneously,the driving force of DRX in α phase increases,strengthening the DRX in α phase in the regions near the surface.Therefore,the fraction of α phase and DRX in α phase exhibit an increasing trend with the increase of the distance from the central region.Furthermore,with the increase of distance from the central region,the driving force of DRX in β phase decreases.Thus,the fraction of β phase and DRX in β phase exhibit a decreasing trend.
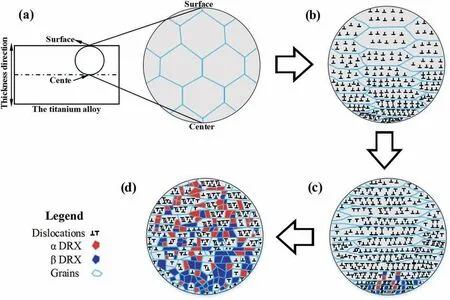
Fig.8.Schematic of microstructural evolution along the thickness direction.(a) Original microstructure of titanium alloy.(b) Hotrolled microstructure showing different deformation for the central region and the surface where dislocations appear.(c) DRX grains appear in the central region.(d) Microstructure after hot rolling process showing different grain size and the level of DRX for the central region and the surface.
4.Conclusions
The microstructure along the thickness direction of a hot-rolled titanium alloy with the composition of Ti-5.1Al-2.5Cr-0.5Fe-4.5Mo-1.1Sn-1.8Zr-2.9Zn has been investigated,the relationship between the mechanical properties and the microstructure analyzed,and the evolution mechanism of the microstructure along the thickness direction during the hot rolling process clarified.
1) Due to the larger applied stress in the central region compared with that near the surface,the average size of the grains in the central region is 1.68 μm,smaller than that near the surface.In addition,the grain fragmentation disturbs the preferred orientation arrangement of the grains,making the strength of the{0001}αtexture(6.99)and the{001}βtexture(5.99)in the central region lower.
2) Compared with the regions near the surface,the higher temperature in the central region aggravates the phase transformation from α phase to β phase,which makes the fraction of α phase(65.6%) lower.In addition,the relative increase of the driving force of DRX in α phase makes the level of DRX in α phase near the surface higher.
3) The mechanical properties relate to the softening effect induced by DRX and the strengthening effect induced by dislocation plugging.In the surface,the level of dynamic recrystallization is the lowest and the GND density is the highest,which makes the yield strength of 1075 MPa the highest and the elongation of 16.4%the lowest.
(4) During hot rolling,the grain fragmentation and the destruction of the preferred orientation arrangement of grains collectively result in the same trend of grain size and texture strength.Moreover,from the central region to the surface,the driving force of the DRX in α phase increases simultaneously,therefore,resulting in an increasing trend of DRX in α phase and the fraction of α phase.
Declaration of competing interest
The authors declare that they have no known competing financial interests or personal relationships that could have appeared to influence the work reported in this paper.
Acknowledgments
This work was financially supported by the National Natural Science Foundation of China (Grant No.51571031),and the Joint Research Programs between Belarusian Republican Foundation for Fundamental Research and Beijing Institute of Technology“BRFFR-BIT-2020" (Grant No.BITBLR2020004).In addition,Dr.Zheng from ZKKF (Beijing) Science &Technology Co.,Ltd is acknowledged for EBSD tests and data analysis.
 Progress in Natural Science:Materials International2021年1期
- Progress in Natural Science:Materials International的其它文章
- Dynamic response characteristic of 7N01/7A01/7050 aluminium multilayer plate at high strain rate
- Synergetic effect of multiple phases on hydrogen desorption kinetics and cycle durability in ball milled MgH2-PrF3-Al-Ni composite
- Growth mechanisms of Ag and Cu nanodendrites via Galvanic replacement reactions
- Highly mechanical and high-temperature properties of Cu-Cu joints using citrate-coated nanosized Ag paste in air
- Ab-initio investigation for the microscopic thermodynamics and kinetics of martensitic transformation
- Rapid directionally solidified microstructure characteristic and fracture behaviour of laser melting deposited Nb-Si-Ti alloy
