
Influence of grain size on strength of polymineralic crystalline rock:New insights from DEM grain-based modeling
2021-07-27 10:01JunPengLouisNgaiYuenWongCeeIngTeh
Jun Peng, Louis Ngai Yuen Wong, Cee Ing Teh
a Department of Earth Sciences, The University of Hong Kong, Hong Kong, China
b School of Civil and Environmental Engineering, Nanyang Technological University, Singapore
c Shenzhen Institute of Research and Innovation, The University of Hong Kong, Shenzhen, China
Keywords:Grain size Rock strength Grain-based modeling (GBM) approach Grain boundary Micro-cracking behavior
ABSTRACT Grain size effect on rock strength is a topic of great interest in geotechnical engineering. A consensus obtained from earlier laboratory tests is that rock strength generally decreases with the increase of grain size for both silicate and carbonate rocks; however, some recent numerical results conflict with such laboratory test results. To address this intriguing issue, the effect of grain size on strength of polymineralic crystalline rock with low porosity is investigated numerically using the grain-based modeling(GBM) approach in discrete element method (DEM) by interpreting micro-cracking process in response to loading. In agreement with some previous DEM simulation results, the simulated rock strength is found to increase with increasing grain size for both homogeneous and heterogeneous models, even when the number of assembled disks in one mineral grain changes.The mechanism of strength increase with increasing grain size is mainly associated with the number of assembled smooth-joint contacts along grain interfaces and the generation of grain boundary cracks in response to loading. The grain interfaces significantly weaken the integrity of the rock model, which is similar to effects of inherent defects in real rock.As the grain size increases,fewer grain interfaces are built in the model and the rock strength becomes much higher. Hence, by solely changing the mineral grain size in a model, the mechanism of grain size effect as observed in laboratory tests cannot be replicated.To address this issue,a method of degradation of grain boundary strength parameters is used to mimic the possible mechanism of grain size effect. The simulated strength using the method becomes comparable with those obtained from laboratory tests when the heterogeneity in the rock is considered. Degradation of grain boundary parameters with increasing grain size provides a plausible explanation for the grain size effect on rock strength.
1. Introduction
Rock is a typical heterogeneous material composed of various types of micro-structures, which are associated with different mineral aggregations and varying numbers of micro-defects such as pores, micro-cracks, and bedding planes (Hallbauer et al.,1973;Kranz,1983). Extensive previous laboratory test results have indicated that the failure of rock in a macroscopic scale is mainly controlled by its inherent micro-structures and the associated micro-cracking process (Brace et al., 1966; Martin and Chandler,1994; Eberhardt et al., 1998; Diederichs et al., 2004; Wong and Einstein, 2009a, b; Zhao et al., 2015; Zhou et al., 2015). A holistic understanding of the effect of micro-structures on rock failure and the mechanism of micro-crack initiation, propagation, and coalescence can facilitate the study of rock failure behavior from a microscopic view.
The key internal micro-structures dictating the strength and deformation behavior of rocks include grain size distribution,mineralogical composition, fabric, grain shape, and micro-defects.Among these, grain size, which is an inherent attribute that controls the heterogeneity of rocks, has attracted much attention worldwide. As a classic topic, the influence of grain size on rock strength has been extensively investigated experimentally and numerically.
A suite of compressive loading tests on different types of rocks(Brace,1961;Olsson,1974;Singh,1988;Fredrich et al.,1990;Wong et al.,1996; Eberhardt et al.,1999; Tugrul and Zarif,1999; Pˇrikryl,2001; Günes¸ Yılmaz et al., 2011; Sajid et al., 2016) revealed that the rock strength generally decreased with the increase of grain size in rock specimens. In parallel with the laboratory studies, the numerical methods have also been resorted to investigate the influence of grain size on rock strength.The discrete element method(DEM) developed by Cundall (1971), which is able to simulate micro-crack development in the rock failure processes, is one of those numerical methods (Zhang and Wong, 2018). By using a grain-based modeling (GBM) approach, the grain size, shape, and distribution can be directly incorporated into a DEM model. However, the rock strength obtained from GBM simulation generally showed an increasing trend as the grain size in the model progressively increased (Nicksiar and Martin, 2014; Hofmann et al.,2015a; Gui et al., 2016). In other words, the simulation results conflict with those commonly observed in laboratory tests (see more details in Section 2).
Although the grain size dependence of the rock strength has been manifested in a number of laboratory studies,the mechanism of how grain size affects the strength and deformation behavior of rocks is still not completely understood. To address this issue, we numerically investigate the grain size effect on rock strength in the present study by adopting the GBM approach, which is implemented in the two-dimensional particle flow code(PFC2D)(Itasca,2008a),also known as PFC2D-GBM.The structure of this paper is as follows. In Section 2, the literature on grain size effect in the past few decades is reviewed.In Section 3,the method of PFC2D-GBM is introduced and the procedures for generating numerical specimen models are presented. Section 4 presents the simulation results of grain size effect on numerical models of different cases. Section 5 discusses different mechanisms of grain size effect in numerical simulation and laboratory tests. A methodology based on the degradation of grain boundary parameters to capture the mechanism of grain size effect in real rocks is proposed.The key findings are summarized and concluded towards the end of the paper.
2. Literature review
2.1. Laboratory tests
The earlier experimental results show that the grain size has a large influence on the compressive strength of rocks(Olsson,1974;Singh,1988;Fredrich et al.,1990;Wong et al.,1996;Eberhardt et al.,1999; Tugrul and Zarif, 1999; Pˇrikryl, 2001; Günes¸ Yılmaz et al.,2011; Sajid et al., 2016). The results of such key experimental studies on the grain size effect are compiled and examined(Table 1)with respect to the key attributes of the studied rock specimens,such as location,rock type,grain size range,and testing procedure.In general,the studied rock specimens can be categorized into two types,i.e.silicate rocks(mainly granitic rocks)and carbonate rocks(mainly marble and limestone).

Table 1 Details of compiled experimental studies on grain size effect.

Table 2 Calibrated micro-parameters of grains and grain boundaries in the grain-based model of Bukit Timah granite(Peng et al., 2018).
The test data of grain size and compressive strength extracted from the above publications are analyzed and plotted in Fig.1.The compressive strength of silicate rocks(Fig.1a)is found to generally decrease as the grain size gradually increases.The rate of decrease of compressive strength for grain size smaller than 10 mm is much higher than that for larger grain size.
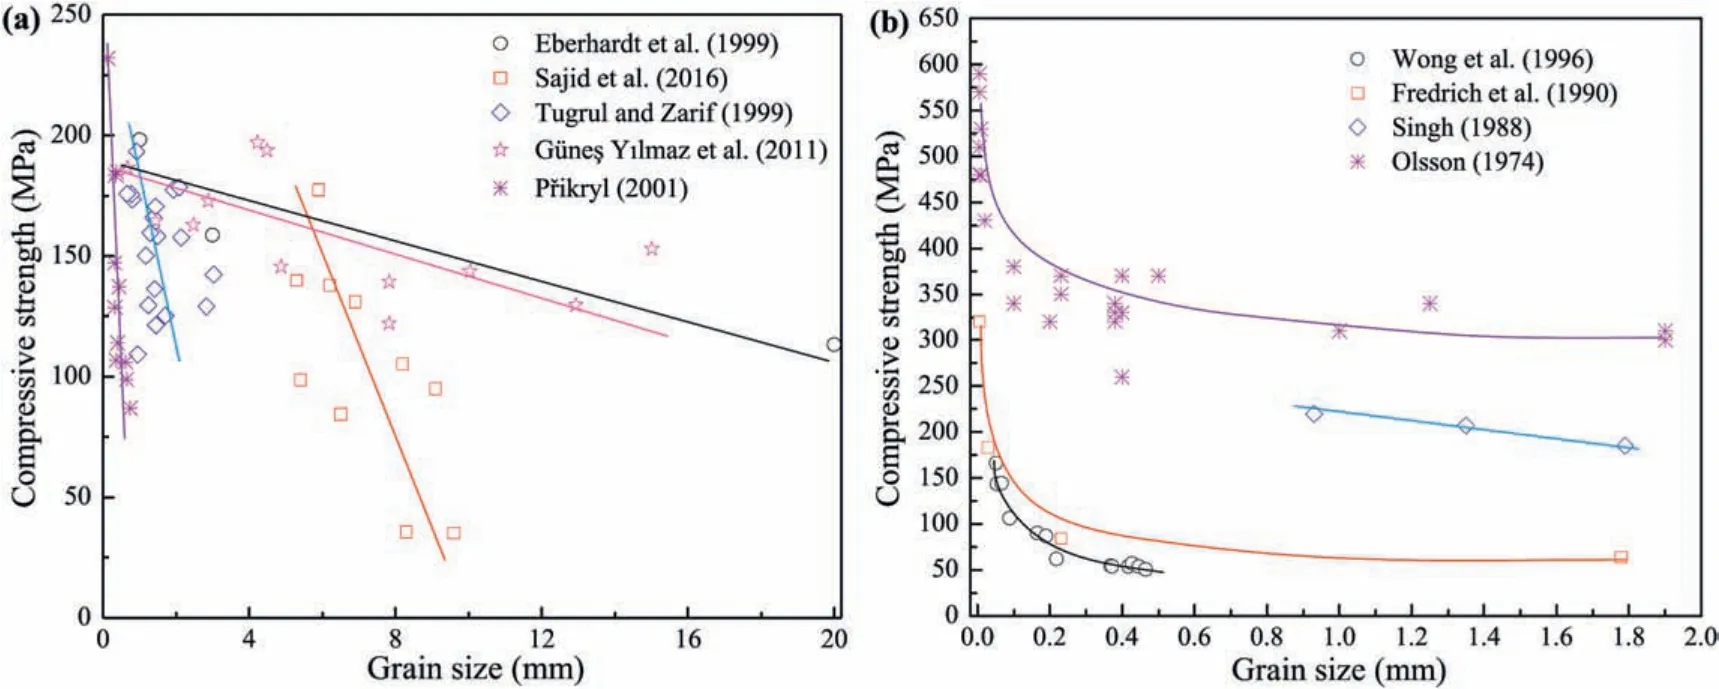
Fig.1. Summary of compressive strength variation with grain size for (a)silicate and (b) carbonate rocks. The test data by Olsson (1974) are obtained under confining pressure of 100 MPa and other sets of test data are under uniaxial compression. The trend lines are drawn manually.
The examined grain size ranges for carbonate rocks are generally smaller than those for silicate rocks. The compressive strength of carbonate rocks(Fig.1b)is also found to decrease with the increase of grain size. However, the decrease in compressive strength becomes very subtle after the grain size reaches a threshold value.
To understand the influence of grain size on the compressive strength of rocks in laboratory tests, rock specimens of similar mineralogy with different grain sizes from different places should be collected, such as the silicate rocks studied by Tugrul and Zarif(1999), Pˇrikryl (2001), Günes¸ Yılmaz et al. (2011), and Sajid et al.(2016). The other factors, including mineralogical composition,drilling technique, hydrogeological condition, and geological formation of rock block,which may also influence the test results,are typically not explicitly compared and considered. The same challenge also prevails for the collected carbonate rocks. Hence, the relations between grain size and rock strength were generally obtained from the statistical analysis of a large amount of test data in previous laboratory tests. A quantitative model which can generalize the grain size-dependent rock strength is hard to be proposed at present.
Although the previous experimental studies statistically conclude that the compressive strength generally decreases with the increase of grain size, one may question if such strength decrease phenomenon is solely due to the increase in grain size,but not the results of the interplay of other factors mentioned above.To address this intrinsic constraint of laboratory studies, numerical approach has been resorted for investigating the influence of grain size on rock strength (Nicksiar and Martin, 2014; Hofmann et al.,2015a; Gui et al., 2016). One merit of numerical simulation is that apart from the grain size, other factors which may also influence the results can be kept unchanged.In addition,the micro-cracking process which dictates the strength behavior can be modeled and studied to aid the interpretation of the experimental results.However, the success of the numerical study relies on a rigorous calibration of model parameters based on the available laboratory test results.
2.2. Numerical simulations
To incorporate minerals with different grain size distributions into the numerical model,the GBM approach is a favorable option.The relevant numerical test data extracted from earlier studies(Nicksiar and Martin,2014;Hofmann et al.,2015a;Gui et al.,2016)are analyzed and presented in Fig. 2.

Fig. 2. Summary of compressive strength variation with grain size from numerical studies.
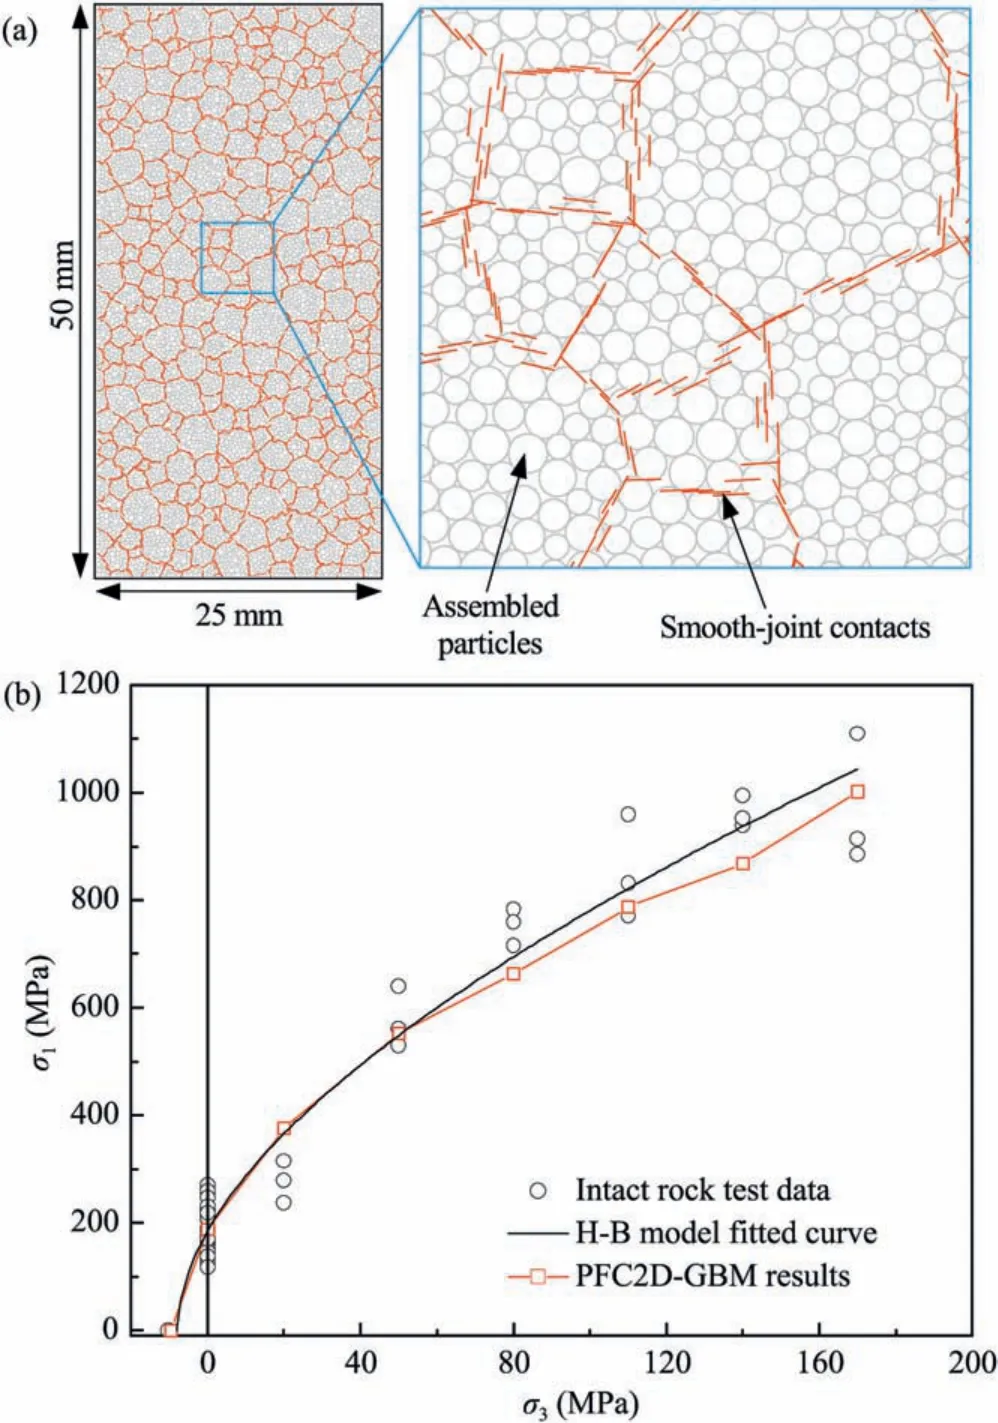
Fig. 3. Numerical simulation of mechanical behavior of Bukit Timah granite using PFC2D-GBM. (a) Generated numerical specimen model of Bukit Timah granite. Grain boundaries are simulated using smooth-joint contacts and grains are composed of a number of disks. The parallel bonds inside the grains are not shown for clarity. (b)Comparison of the simulated strength envelope with that estimated using Hoek-Brown(H-B) failure criterion (after Peng et al., 2018).
These numerical results also reveal that the grain size has a large influence on the simulated rock strength. Using a Voronoi tessellation technique which was implemented into the universal distinct element code(UDEC)(Itasca,2008b)to build a GBM of the rock specimen,Nicksiar and Martin(2014)found that the grain size had a negligible influence on the rock strength when the mineralogical composition and grain size distribution were kept unchanged.Gui et al.(2016)studied a wider range of grain size and found that the simulated strength showed a general increasing trend as the grain size gradually increased. They attributed the strength increase mainly to the decrease of the number of grain interfaces in the generated numerical models when the grain size of minerals increased.Hofmann et al.(2015a)studied the grain size effect using GBM which was implemented into PFC2D. The simulated rock strength also showed an increasing trend with the increase of grain size. However, the particle size and the specimen size varied among their numerical models.The decrease in strength with decreasing grain size was suggested to be mainly attributed to the higher stress concentration in smaller grains.
In summary,the results from previous numerical studies reveal that the rock strength obtained from GBM simulation increases with the increase of grain size in the numerical model, which conflicts the observations in laboratory tests. This is probably because the heterogeneity in the generated model is not adequately reflected in previous numerical studies. Results from previous numerical studies (Lan et al., 2010; Mahabadi et al., 2014;Manouchehrian and Cai,2016;Peng et al.,2017a)revealed that the heterogeneity(i.e.heterogeneity induced by variation of grain size distribution) had a large influence on the rock strength, deformation, and failure behavior and the associated micro-cracking process. Therefore, it is of great importance and significant practical value to take the heterogeneity effect into account in the numerical investigation of grain size effect.
3. Modeling procedure
3.1. Grain-based model in PFC2D
The PFC2D-GBM is used in this study to numerically investigate the grain size effect on rock behavior. The model takes mineralogical composition and grain size distribution of real rock into consideration and has been proven to be capable of modeling a number of mechanical responses under complex loading (Bahrani et al., 2014; Bahrani and Kaiser, 2016; Bewick et al., 2014a, b;Hofmann et al.,2015a,b;Li et al.,2018;Liu et al.,2019;Peng et al.,2017a, b, 2018, 2019; Wong et al., 2018; Zhang et al., 2019). The generation procedures of a PFC2D-GBM is not presented in detail in this paper and interested readers can refer to Potyondy(2010)and Peng et al. (2018).
The micro-parameters used in the present PFC2D-GBM were calibrated against the mechanical properties of Singapore Bukit Timah granite (Peng et al., 2018). Fig. 3 presents the PFC2D-GBM used by Peng et al. (2018) for simulating the mechanical behavior of the Bukit Timah granite.The simulated strength behavior is in a good agreement with those obtained from laboratory tests.Table 2 lists the used micro-parameters for different grains (disks and parallel bonds)and grain boundaries(smooth-joint contacts). This set of micro-parameters is adopted in the present study to investigate the mineral grain size effect on rock strength numerically.
3.2. Numerical models
To achieve the goal of the present study, the first task is to develop numerical models with different grain sizes.The grain size in the generated numerical model is designed to range from 1 mm to 3.5 mm at an increment of 0.5 mm. Due to the truncation of grains located adjacent to the specimen boundary, these mineral grains are smaller than the designed value.In the present study,the generated models comprise four minerals, which are the same as those simulated by Peng et al.(2018).A number of previous studies revealed that the failure behavior was significantly affected by the mineral content in crystalline rocks(Tugrul and Zarif,1999;Pˇrikryl,2001; Günes¸ Yılmaz et al., 2011; Sajid et al., 2016; Wong et al.,2018). To eliminate the mineral content effect on the simulation results,each mineral is assigned identical percentage(25%),i.e.the total area of each mineral in the model is the same.
As pointed out in Section 2.2, the material heterogeneity has a large effect on the rock damage process(Lan et al.,2010;Mahabadi et al.,2014; Manouchehrian and Cai, 2016; Peng et al.,2017a). The heterogeneity may also influence the simulation results in the present study.Peng et al.(2017a)proposed a dimensional index to quantitatively characterize the heterogeneity induced by grain size distribution.They found that the rock strength generally increased as the heterogeneity index gradually decreased. The proposed heterogeneity index becomes 0 if a regular hexagonal grain structure is used.To consider such heterogeneity effect in this study,two types of numerical models are established, which are termed as homogeneous and heterogeneous models hereinafter,respectively.The grain structure geometry of the homogeneous models, which are made up of uniformly-distributed regular hexagons,is the same(see Fig. 4a). This can minimize the influence of material heterogeneity on the simulation results to the largest extent (Peng et al.,2017a). In contrast, heterogeneous models are assembled with mineral grains of random shapes (see Fig. 4b). Because the grain size in each heterogeneous model is the same, some parts of the generated heterogeneous models are also assembled with hexagons.However,the heterogeneity level of heterogeneous models is much larger than that of homogeneous models. For both model types, the grain boundaries (i.e. total length of grain interfaces)greatly decrease as the grain size increases from 1 mm to 3.5 mm.
A recent study by Hofmann et al. (2015a) using PFC2D-GBM attributed the grain size effect to the stress concentration generated in the mineral grains during loading. Recall that a grain is composed of multiple disks in PFC2D-GBM. They considered that smaller minerals comprising fewer disks might result in a higher stress concentration,which hence leads to a larger decrease in rock strength. To comprehensively examine this, we consider two scenarios in each model category in the present study. In the first scenario, the minimum disk size is set to be constant as the grain size is gradually enlarged.Hence,a mineral is assembled with more disks with increasing grain size.In the second scenario,the ratio of grain size to minimum disk size is set to be constant, while the grain size in the numerical model varies.Mineral grains of different sizes will contain comparable amount of disks.As an example,Fig.5 illustrates the disk assemblies for the two scenarios in the homogeneous numerical models. As a result, a total of four cases are considered in this study. The two cases for homogeneous models are numbered as Cases 1 and 2,respectively,and the two cases for heterogeneous models are numbered as Cases 3 and 4,respectively.

Fig. 4. Numerical models possessing grains with different sizes: (a) Homogeneous models in which the grain structure is assembled with regularly-distributed orthohexagonal grains; and (b) Heterogeneous models in which the grain structure is assembled with irregularly-distributed grains of random shapes. Different mineral types are shown with different colors (red = K-feldspar, blue = quartz, green = plagioclase, magenta = biotite).

Fig.5. Illustration of disk arrangement for homogeneous numerical models of(a)Scenario 1 where the disk size is kept unchanged;and(b)Scenario 2 where the grain size to disk size ratio is kept unchanged. The dimensions are 12.5 mm × 12.5 mm.
Table 3 compares the number of disks as well as numbers of smooth-joint contacts and parallel bonds in the numerical models of the four cases.When the minimum disk size is set to be constant,the number of smooth-joint contacts decreases as the grain size gradually increases, while the total number of contact bonds remains generally unchanged.When the minimum disk size is set to increase proportionally with grain size, the numbers of disks,smooth-joint contacts, and parallel bonds all gradually decrease.
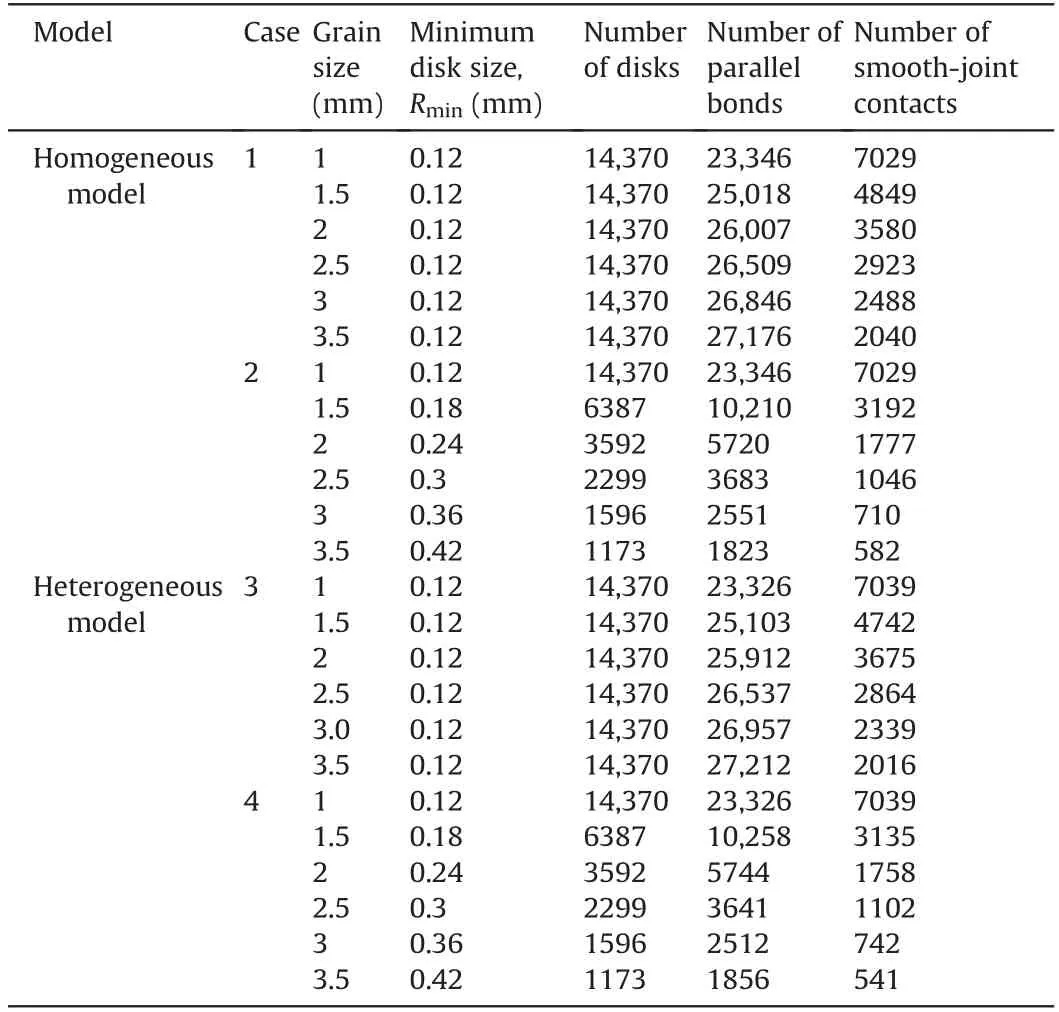
Table 3 Summary of details of numerical models with different grain sizes for different cases.
In the following discussion,the numerical models are simulated under uniaxial compression and the variation of rock strength with grain size is analyzed. More importantly, the micro-cracking evolution which dictates the strength behavior is also investigated.
4. Modeling results
4.1. Grain size effect on homogeneous models
The numerical results of homogeneous models show that the simulated rock strength increases with the increase of grain size in the model (Fig. 6), which is comparable with the previous numerical studies of grain size effect on rock strength (Hofmann et al.,2015a; Gui et al., 2016). A comparison of the strength behavior in the two cases reveals that the strength generally increases with increasing grain size even when the number of disks in a mineral grain is more or less the same for numerical models possessing grains with different sizes. This indicates that the increase in the simulated rock strength with increasing grain size is not essentially related to the number of disks assembled in mineral grains.Hence,the stress concentration in assembled mineral grains is not the main factor that affects the rock strength. This observation is different from the results interpreted by Hofmann et al. (2015a).
The rock strength is closely associated with the micro-cracking development during loading of the model. To acquire a thorough understanding of the mechanism related to the grain size effect,the micro-cracking process is interpreted and examined below. Fig. 7 presents an example of the micro-cracking behavior of homogeneous models with the grain size of 2 mm for the two cases.The key results are described as follows:
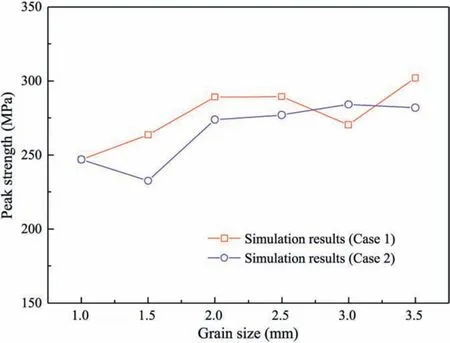
Fig. 6. Variation of simulated rock strength with grain size for homogeneous models.
(1) The main crack type developed during loading of numerical models is grain boundary micro-crack, which is closely related to the breakage of smooth-joint contacts. This observation generally agrees with the experimental results(Tapponnier and Brace, 1976; Moore and Lockner, 1995;Akesson et al., 2004; Rigopoulos et al., 2011).
(2) For all numerical models, the ratio of intra-grain cracks to parallel bonds is less than 0.5%, and the ratio of grain boundary cracks to smooth-joint contacts is about 40%-60%.Upon failure of specimen, even though the number of parallel bonds in the numerical models is 3-7 times that of smooth-joint contacts, the ratio of breakage of contacts to total number of contacts for smooth-joint contacts is about 200 times as compared with that for parallel bonds.
(3) The development of intra-grain cracks, which is related to the breakage of parallel bonds,only initiates at a stress level equal to 0.6-0.8 times the peak strength.
(4) For both cases,most of the cracks develop along the loading direction (i.e. major principal stress direction), and vertical macroscopic fractures will eventually form due to coalescence of these earlier cracks. However, fewer cracks will develop and these cracks will be less uniformly distributed in Case 2 than in Case 1 due to the fewer generated contacts in the model. The micro-cracking is also found to be more intensive in Case 2 than in Case 1.
These observations indicate that the dominating factor controlling the rock strength is the generation of grain boundary cracks.The rock strength is closely related to the number of assembled smoothjoint contacts in the model and the generation of grain boundary cracks during loading. That is why the rock strength in Case 2 also shows a comparable increasing trend as that in Case 1, even when the number of parallel bonds differs significantly in the two cases.
The variations of the ratio of crack to contact for smooth-joint contacts and number of grain boundary cracks in response to the increase of grain size in the homogeneous numerical models are shown in Fig. 8. The results reveal that, at the peak strength, the number of grain boundary cracks decreases as the mineral grain size in the model increases for both cases.This is mainly due to the fact that fewer smooth-joint contacts are assembled in the model as the grain size gradually increases. On the other hand, the ratio of the number of grain boundary cracks to the total number of smooth-joint contacts generally increases with the increase of grain size in the model. This indicates that the grain boundary cracking becomes more intensive with increasing grain size;the capacity of the model sustaining grain boundary cracking is thus getting higher, resulting in a higher rock strength. Therefore, the trend of the ratio of crack to contact for smooth-joint contacts in response to the increase of grain size is similar to the variation of rock strength with grain size as presented in Fig. 6.
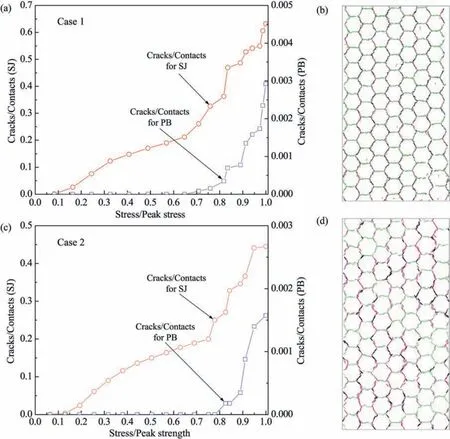
Fig. 7. Relationship between the quantity of grain boundary cracks (associated with smooth-joint contacts (SJ))and intra-grain cracks(associated with parallel bonds (PB)) in the loading process for homogeneous models:(a)Crack evolution and(b)micro-cracking pattern for numerical model with grain size of 2 mm for Case 1;and(c)Crack evolution and(d) micro-cracking pattern for numerical model with grain size of 2 mm for Case 2. In (b) and (d), green segments represent the grain boundaries; pink and black segments represent the grain boundary tensile and shear cracks, respectively; and red segments represent the intra-grain tensile cracks.
4.2. Grain size effect on heterogeneous models
Fig.9 presents the strengthbehavior inresponse to the variation of grain size in the heterogeneous models(Cases 3 and 4).As shown in the plot,similar to the results of homogeneous models,the simulated rock strength also generally increases with increasing grain size,even when the number of disks assembled in the model changes.
The cracking behavior which controls the rock strength is also examined. Fig.10 presents the micro-cracking behavior of heterogeneous models with grain size of 2 mm for both cases.The results show that the micro-cracking process of heterogeneous models is generally the same as that of homogeneous models.The dominant crack type developed in the numerical model during loading is also grain boundary cracks.Only a limited number of intra-grain cracks inside the grains are detected which initiate at a stress level of about 0.6-0.8 times the peak strength.
The variations of ratio of crack to contact for smooth-joint contacts and number of smooth-joint contacts in response to the variation of grain size in the heterogeneous models are also examined and the results are shown in Fig.11. As the grain size in the model increases,the number of grain boundary cracks generally decreases, while the ratio of crack to contact for smooth-joint contacts increases. The results are similar to those of homogeneous models.The rock strength is also found to be closely related to the number of assembled smooth-joint contacts in the model and generation of grain boundary cracks during loading. The rock strength is generally controlled by the capacity of the model sustaining grain boundary cracking.

Fig.11. Variations of number of grain boundary cracks and ratio of crack to contact for smooth-joint contacts(SJ)with grain size at the peak strength for(a)Case 3 and(b)Case 4 in heterogeneous models.
5. Discussion
5.1. Mechanism of grain size effect on rock strength
The results reported in Section 4 reveal that even though the numbers of disks and parallel bonds vary in the generated numerical model, the simulated compressive strengths of both homogeneous and heterogeneous models show a comparable increasing trend as the grain size increases in the model. This indicates that the variation of simulated rock strength with grain size has no direct relation with the material heterogeneity and the number of assembled disks in a single mineral grain (i.e. stress concentration) as investigated by Hofmann et al. (2015a).
The micro-cracking process taking place inside the numerical model during loading has a significant influence on rock strength.Our numerical results suggest that the strength is mainly controlled by the generation of grain boundary cracks,which in turn is related to the breakage of smooth-joint contacts along the grain interfaces.In general, the number of grain boundary cracks decreases with increasing grain size in the numerical model.This is due to the fact that fewer smooth-joint contacts are assembled in the numerical model as the grain size increases. However, the “absolute” grain boundary cracking (ratio of crack to contact for smooth-joint contacts) becomes more intensive, indicating a higher capacity of the model sustaining grain boundary cracking. The latter corresponds to a higher rock strength.
In laboratory tests,the strength of intact rock is generally higher than that of rock mass since the latter contains defects such as joints, bedding planes, and voids. These defects can significantly weaken the overall strength and modulus of rock mass. In numerical studies,the micro-cracks are found to be mainly generated along the grain interfaces.The grain interfaces play a similar role as the defects in a rock mass,hence weakening the rock.As the size of a mineral grain increases, fewer grain interfaces are embedded in the model,and the strength of the models will be much higher(Gui et al.,2016).Hence,the simulated rock strength generally increases with the increase of the grain size in the model when the microparameters for the mineral grains and grain boundaries are kept unchanged. The interpretation of micro-cracking behavior in this study explains why the recent DEM simulation results regarding grain size effect generally conflict with those obtained from laboratory tests. In fact, the “apparent” mechanism of numerical study on grain size effect is quite different from that observed in laboratory tests. In a real rock specimen, the finer the grains are, the better the grains are bonded to each other and the higher the contact strength between grains will be(Wong et al.,1996).Higher loads are needed to break this more tightly-bonded contact during loading of a rock specimen. Therefore, finer-grained rocks have a higher laboratory-determined rock strength.By solely changing the mineral grain size of a model, the mechanism of grain size effect observed in laboratory tests cannot be well replicated,leading to a conflicting observation.Therefore,more proper methods should be explored and put forward to mimic the mechanism of grain size effect on rock strength in numerical simulation.As a trial,a method related to realistic micro-parameter assignment is studied in the following section to delve into grain size effect.
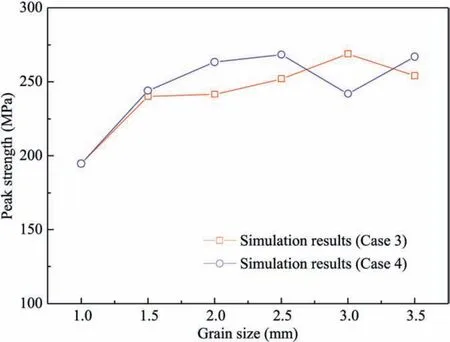
Fig.9. Variation of simulated rock strength with grain size for heterogeneous models.
5.2. Strength parameter degradation of grain interfaces
In this section, a method of deceasing strength parameters of grain interface with increasing grain size is used in the model to study the grain size-dependent strength behavior. The method is proposed based on the following two aspects.First,as discussed in the above section,in a real rock specimen,the finer the grains are,the better the grains are bonded to each other and the higher the contact strength between grains will be(Wong et al.,1996).Hence,the strength parameters in the contact between large mineral grains are generally lower than those in the contact between small mineral grains.Second,the results in Section 4 show that the grain interfaces (grain boundaries) have a dominating effect on controlling the rock strength. The effects of grain interfaces are similar to those of defects (i.e. joints, bedding planes, and voids) in a rock mass,which lower the strength of the numerical models.As shown in Fig.4,although the total length of grain interfaces decreases with increasing grain size, the length of each grain interface gradually increases. Referring to scale effect of a rock joint, a longer joint generally has a lower shear strength (Bandis et al., 1981; Zhang et al., 2006; Lambert and Coll, 2014). The strength microparameters in the contact between larger mineral grains should also be lower. In summary, with the gradual increase of the grain size,the strength in the contacts between mineral grains decreases.This is probably the main mechanism associated with grain size effect observed in laboratory tests. To mirror this in the numerical simulation, a degradation coefficient, which is defined as the ratio of strength parameters for numerical model with a certain grain size to those with the grain size of 1 mm, is used. The strength micro-parameters (i.e. cohesion and tensile strength) of smoothjoint contacts representing grain boundaries are monotonously degraded as the mineral grain size in the numerical model gradually increases.

Fig.10. Relationship between the quantity of grain boundary cracks(associated with smooth-joint contacts(SJ))and intra-grain cracks(associated with parallel bonds(PB))in the loading process for heterogeneous models:(a)Crack evolution and(b)micro-cracking pattern for numerical model with grain size of 2 mm for Case 3;and(c)Crack evolution and(d) micro-cracking pattern for numerical model with grain size of 2 mm for Case 4. In (b) and (d), green segments represent the grain boundaries; pink and black segments represent the grain boundary tensile and shear cracks, respectively; and red segments represent the intra-grain tensile cracks.
The micro-parameters of smooth-joint contacts for homogeneous models(Case 1)and heterogeneous models(Case 3)are both degraded for comparison in this study, and the simulation results are referred to as Cases 5 and 6, respectively. As a trial, the degradation coefficient is set to linearly decrease with increasing grain size in this study. The degradation coefficient decreases from 1 to 0.4 as the grain size gradually increases from 1 mm to 3.5 mm(Fig. 12). Table 4 summarizes the assigned smooth-joint contact parameters for numerical models possessing different mineral grain sizes. How to determine the degradation coefficient is an intriguing topic which should be comprehensively studied in the future sensitivity analysis of micro-parameters.
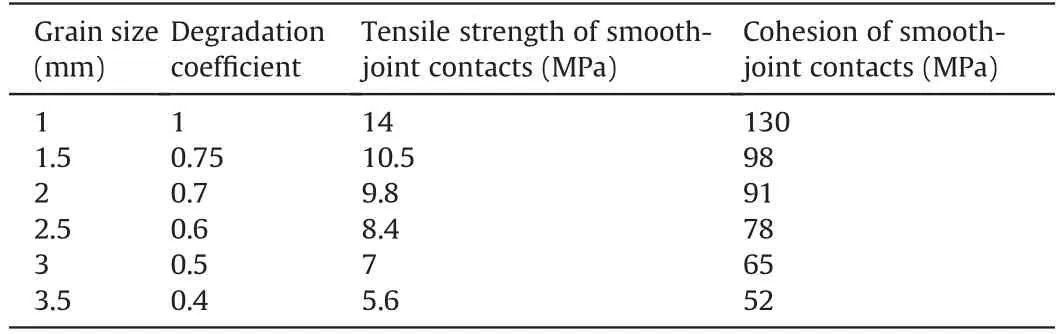
Table 4 Summary of degraded strength micro-parameters of smooth-joint contact.
The simulation results(Fig.13)show that the simulated strength for degraded homogeneous models(Case 5)also exhibits a general increasing trend as the grain size in the model increases. The strength in this condition is mainly controlled by the grain structure of the model.Because the model is assembled with uniformly distributed regular hexagons,the model can still sustain loads even when most of the contacts in grain boundaries break. The observation agrees with previous laboratory tests on jointed rock mass(Brown,1970;Brown and Trollope,1970;Ladanyi and Archambault,1972).
For the degraded heterogeneous models (Case 6), because the heterogeneity of the model is considered, the simulated strength gradually decreases as the mineral grain size in the model increases. The results show that the strength behavior associated with grain size effect, which is obtained from laboratory tests,can be well modeled by degrading the strength micro-parameters of smooth-joint contacts in the model.
The results in this section reveal that the variation of rock strength with grain size observed in laboratory tests can be well captured using the method of degradation of strength parameter of grain boundaries.This method offers a plausible explanation for the grain size effect on rock strength. However, despite the careful calibration of the used model,the results obtained in this numerical study are based on a series of parametric simulation. Laboratory tests with comprehensive microscopic observations using technologies such as scanning electron microscopy, computed tomography, and nuclear magnetic resonance, are highly warranted in future to validate the results. In addition, a more rational method for calibrating strength micro-parameters of grain boundaries with different grain sizes should be developed in future.
5.3. Limitations of this study
The PFC2D-GBM is capable of modeling the micro-cracking behavior of polymineralic crystalline rock with low porosity,which has deformable,breakable,and polygonal grains(Peng et al.,2021;Wong and Peng,2020).A porous rock is hard to be captured using PFC2D-GBM at present. Hence, the results obtained and discussed in this study are only applicable to low-porosity crystalline rock.The porosity of Bukit Timah granite used for parameter calibration is about 0.2%(Zhao et al.,1994).Hence,the used PFC2DGBM is applicable in this study. The numerical study of grain size effect on strength of carbonate rocks is a topic worthy of investigation in future. In addition, the effect of “apparent” porosity,which results from the particle assemble in the model generation,on the simulation results is not discussed in the present study.
One shortcoming of this study is that the numerical results obtained from a 2D GBM are compared with those obtained from triaxial compression tests. Nonetheless, though the loading condition in triaxial compression tests is different from that of 2D biaxial tests using PFC2D, the grain-based model can be readily incorporated in PFC2D and such numerical approach is proven to be capable of simulating the micro-cracking behavior of the rock material. Although some recent numerical studies using PFC3D have been successful to obtain some preliminary results associated with micro-cracking behavior of rock (Tawadrous et al., 2009;Huang et al.,2019;Castro-Filgueira et al.,2020),the GBM is hard to be implemented in PFC3D due to the highly complex threedimensional (3D) geometry of minerals. The development of 3DGBM to consider the real 3D structure of rocks will be a promising topic in the future research.

Fig.12. Degradation coefficient of smooth-joint contact parameters with grain size.

Fig.13. Variation of simulated rock strength with grain size for degraded models.
6. Conclusions
Grain size is one of the crucial micro-structural parameters affecting rock strength.The present review on previous laboratory studies has revealed that the rock strength generally decreases with the increase of grain size for both silicate and carbonate rocks.However, some recent numerical results conflict with these laboratory observations.To address the issue,the effect of grain size of minerals on the strength behavior of crystalline rock is numerically investigated using the grain-based model. New insights are obtained based on the interpretation of micro-cracking process in response to loading.
The PFC2D-GBM numerical results in the present study show that the rock strength generally exhibits an increasing trend as the mineral grain size increases in both homogeneous and heterogeneous models, even when the number of disks assembled in one mineral grain changes.The strength increase with increasing grain size is closely related to the number of assembled smooth-joint contacts in the model, and the generation of grain boundary cracks during loading. Even though fewer smooth-joint contacts are assembled in the model as the grain size gradually increases,the ratio of the number of grain boundary cracks against the total number of smooth-joint contacts generally increases when the grain size in the model increases. This indicates that the grain boundary cracking becomes more intensive with increasing grain size; the capacity of a numerical model sustaining grain boundary cracking thus becomes higher,resulting in a higher simulated rock strength.The grain interfaces can significantly weaken the integrity of rocks like those inherent defects in rock mass.
In a real rock specimen, the consensus is that a finer-grained texture corresponds to a higher degree of bonding along grain contacts. Higher loads are needed to break the bonds, leading to a higher rock strength of finer-grained specimen.This mechanism is not well represented in numerical studies by solely changing the mineral grain size in a model. To mirror a realistic mechanism of grain size effect,a method of degradation of strength parameters of grain boundaries is put forward. The numerical results reveal that the simulated strength behavior is comparable with those obtained from laboratory tests when the heterogeneity in the rock is considered. Degradation of grain boundary parameters with increasing grain size provides a plausible explanation of the grain size effect of rock.However,further laboratory study on the micromechanism of grain size effect is required to verify this viewpoint.
Declaration of competing interest
The authors declare that they have no known competing financial interests or personal relationships that could have appeared to influence the work reported in this paper.
Acknowledgments
The research presented in this paper is in part supported by the National Natural Science Foundation of China(Grant Nos.41877217 and 51609178), the General Research Fund of the Research Grants Council (Hong Kong, China) (Grant No. 17303917), and the Singapore Academic Research Fund Tier 1 Grant (RG112/14).
 Journal of Rock Mechanics and Geotechnical Engineering2021年4期
- Journal of Rock Mechanics and Geotechnical Engineering的其它文章
- Discussion on“Analysis of Bingham fluid radial flow in smooth fractures”[J Rock Mech Geotech Eng 12 (2020) 1112-1118]
- Validity of continuous-failure-state unloading triaxial tests as a means to estimate the residual strength of rocks
- Hydromechanical behaviors of andesite under different stress states during fluid injection
- Performance of identical rockbolts tested on four dynamic testing rigs employing the direct impact method
- An empirical approach for predicting burden velocities in rock blasting
- Geomechanical model test for analysis of surrounding rock behaviours in composite strata