
Fast saccharide mapping method for quality consistency evaluation of commercial xylooligosaccharides collected in China
2021-07-20 01:28YongDengCunwuChenLingxioChenBngxingHnShopingLiJingZho
Yong Deng,Cunwu Chen,Lingxio Chen,Bngxing Hn,Shoping Li,*,Jing Zho,**
aState Key Laboratory of Quality Research in Chinese Medicine,Institute of Chinese Medical Sciences,University of Macau,Macao,China
bAnhui Engineering Laboratory for Conservation and Sustainable Utilization of Traditional Chinese Medicine Resources,West Anhui University,Lu'an,Anhui,China
Keywords:
Xylooligosaccharides
Saccharide mapping
MALDI-MS
Quality control
A B S T R A C T
Due to the extensive use of xylooligosaccharides(XOS)as functional food ingredients,many inferior goods and even adulterants are generally found in the market,which may pose a health hazard to certain populations.Chromatography method such as high-performance liquid chromatography(HPLC)and high-performance thin-layer chromatography(HPTLC)is traditionally applied for the quality analysis of XOS.However,it is time consuming due to the prolonged separation and pre-or post-derivatization procedure.In this study,a fast saccharide mapping method based on matrix-assisted laser desorption/time-of- flight mass spectrometry(MALDI-TOF-MS)was developed for the quality consistency analysis of 22 batches of XOS collected from different manufacturers in China.The time needed for saccharides analysis using MALDI-MS was less than 30 min for one plate,at least 6 times faster than that by the traditional HPTLC chromatography method.In addition,MALDI-MS possessed higher resolution for XOS with DP4-DP7 based on the difference of m/z,which is hardly separated using HPTLC.The results showed that XOS were present only in samples XY01-XY11,samples XY12-XY14 only consisted of hex oligosaccharides,and samples XY15-XY22 were free of oligosaccharides.These indicate that the quality consistency of XOS products in the China market was poor,which should be carefully investigated.
1.Introduction
The xylooligosaccharides(XOS)are oligomers containing 2-7 xylose monomeric units linked by β-(1,4)-xylosidic linkage[1],which are produced from lignocellulosic materials by chemical[2]or enzymatic methods[3,4].As non-digestible food ingredients for humans,XOS exhibit many bioactivities such as stimulation of the growth of probiotic bifidogenic and lactic acid bacteria in the gut[5],improvement of calcium biological availability[6],reduction of the risk of colon cancer[7],immunomodulatory properties[8],antioxidant effects[9],and antimicrobial activities[10].In addition,XOS have favorable physicochemical features,including stability under wide pH range,resistance to heat,and low caloric values[11].Therefore,the most important applications of XOS are in the field of functional food ingredients.For example,XOS are widely used as ingredients in soy milk,oral liquid,nutritive preparations,dairy products as well as special preparations for health food and food additives[12,13].So far,there are more than eighty types of health food products which contain XOS as main functional components registered in the China Food and Drug Administration(CFDA).
Due to the extensive use of XOS as functional food ingredients,the industry of XOS production is growing rapidly.China as the world's second-largest supplier produced approximately5231 tons,which accounted for 21% in 2015,and the volume sustainably increases in the following years.The basis for their long-term exploitation as health promoters is highly dependent on the quality and safety of products that fulfils consumer expectations[11].However,reports on the authentication and quality control of XOS in the market are scarce.This is significant because mislabeled products may pose a health hazard to certain populations,such as diabetic patients.Therefore,there is an urgent need for a reliable and efficient strategy or evaluation system for characterization and comparison of XOS from the market,which is beneficial to improving the quality control of XOS and their rational utilization as functional food ingredients.
Saccharide mapping method based on high-performance thinlayer chromatography(HPTLC),high-performance liquid chromatography(HPLC),and polysaccharide analysis using carbohydrate gel electrophoresis(PACE)has been developed for the quality evaluation of carbohydrates as new functional ingredients in herbs and functional foods[14].Pu et al.[15]developed a reversed-phase HPLC method for the separation and determination of XOS,using pre-column derivatization with 1-phenyl-3-methyl-5-pyrazolone(PMP)and UV detection at 245 nm.Also,high-performance liquid chromatography-evaporative light scattering detector(HPLC-ELSD)has been widely used for quantification and comparison of carbohydrates from natural resources,which is regarded as one of the most useful techniques for the investigation of compounds without UV absorption[16].Li et al.[17]developed a hydrophilic interaction liquid chromatography(HILIC)-ELSD method for the comparison of xylans under different hydrolysis methods and monitoring of XOS contents from different agricultural wastes.In addition,HPTLC as a simple method has also been widely employed for the quality control of herb medicines[18]or food supplements[19].However,it is time consuming by using the above-mentioned chromatography method due to the prolonged separation and pre-or postderivatization procedure.In addition,the detection sensitivity of ELSD and refractive index detector(RID)is low and HPTLC is not suitable for the separation of saccharides with high polymerization.Therefore,it is necessary to develop a new complementary saccharide mapping method with high resolution and throughput.
In the last decade,matrix-assisted laser desorption/mass spectrometry(MALDI-MS)was widely applied for the analysis of oligosaccharides[20],both from polysaccharides[21-23]and glycoproteins[24,25].For example,a high-throughput MALDI-MS based strategy was developed for the detection of honey adulteration based on oligosaccharide and polysaccharide pro files[26].This MS based technique has been verified to be a valuable tool for the characterization of carbohydrates due to its main advantages as rapidity,sensitivity,high resolution and simplicity of the experiments.
In this work,apart from the traditional HPTLC method,a complementary saccharides mapping method based on matrix-assisted laser desorption/time-of- flight mass spectrometry(MALDI-TOFMS)was applied for the quality evaluation of XOS collected from different manufacturers in China.In addition,the presence of XOS was verified by using gas chromatography-mass spectrometer(GCMS)analysis based on glycosidic bond.The methodologies described in this work would be potentially useful to the quality control of XOS products,which may provide some help for the factories producing functional food ingredients.
2.Materials and methods
2.1.Materials and reagents
Twenty-two batches(XY01-XY22)of XOS were collected from different manufacturers in China and the sample information is listed in Table 1.Rhamnose (Rha), xylose (Xyl), fructose (Fru),glucose (Glc), maltose (Mal), sucrose (Suc), dextran, xylan, tri-fluoroacetic acid (TFA), 2,5-Dihydroxybenzoic acid (DHB), α-cyano-4-hydroxycinnamic acid (CHCA), sinapic acid (SA) and isoliquiritigenin (ISL) were purchased from Sigma (Steinheim, Germany). Xylobiose and xylotriose were purified in our lab with thepurities above 95% (determined by HPLC) [27]. Methanol (HPLCgrade), acetonitrile (ACN, HPLC grade) and silica gel 60 TLC plates were purchased from Merck(Darmstadt,Germany).Millipore Milli-Q Plus system(Millipore,Billerica,MA,USA)was used for the deionized water preparation.All the other reagents were of analytical grade.

Table 1 Information of the analyzed samples.
2.2.HPTLC analysis
Samples XY01-XY14 and XY15-XY22 were dissolved in H2O at concentrations of 10 mg/mL and 2 mg/mL,respectively.Dextran(5 mg/mL)and xylan(5 mg/mL)were hydrolyzed by using 1 M TFA at 80°C for 4 h to produce the oligosaccharides ladders.Saccharide profiling based on HPTLC was performed according to our previously reported method[28,29].In brief,all the samples(4μL)were applied on a 20 cm×10 cm silica gel plate(Merck,Darmstadt,Germany)by using an AS30 HPTLC Applicator(Desaga GmbH,Germany).The bands were 8 mm wide,13 mm distance,and 10 mm from the bottom edge.Then,the plates were developed for two times with 1-butanol/isopropanol/acedic acid/water(7:5:1:2,V/V/V/V)as mobile phase.Finally,the developed plates were sprayed with aniline-diphenylamine-phosphoric acid solution and heated at 105°C on a YOKO-XR plate heater(Wuhan YOKO Technology Ltd.,China)for 15 min;then the plates were covered with glass and photographed.After that,the plates were scanned at λ=520 nm using densitometer CD60(Desaga GmbH,Germany).
2.3.MALDI-TOF-MS analysis
MALDI-TOF-MS was performed on an UltrafleXtreme mass spectrometer(Bruker,Bremen,Germany)system according to our previous work[27].The lyophilized XOS samples(1.0 mg)were prepared in 1.0 mL of deionized water.For matrix preparation,20 mg/mL of DHB,15 mg/mL of CHCA solution and 10 mg/mL of SA solution were mixed with a 1:1 volumetric ratio of ACN to water.The ISL was dissolved in methanol at a final concentration of 0.5 mg/mL[30].Then,10 μL of matrix was mixed with 5 μL XOS sample solutions.The mixed solutions(0.4μL)were spotted on an MTP AnchorChip target and dried at room temperature.MS spectra were recorded in the reflector positive mode with two ion source voltages of 25 kV and 23.7 kV.The mass scan range was from m/z 200 to m/z 3000.All depicted spectra were calibrated using an external calibration equation generated from the ion signals of peptide calibration standard II(m/z 757-3147).The acquired spectra were processed using FlexAnalysis software(Bruker Daltonics,Germany)to select mass peaks with a signal-to-noise ratio(S/N)higher than 10.
2.4.GC-MS analysis
Glycosidic linkage analysis of XOS samples was performed by using GC-MS according to the reported method[31].Brie fly,each XOS sample solution(5 mg in 1 mL of DMSO with 20 mg of NaOH)was added with 0.15 mL CH3I.Then,the reagents mixture was reacted under microwave irradiation(Multiwave 3000,Anton paar GmbH,Graz,Austria)at 500 W for 30 s.Finally the reaction mixture was cooled to room temperature and dialyzed overnight against deionized water(molecular weight cut-off:3.5 kDa);then the reaction mixture was evaporated to dryness with a nitrogen evaporator.The methylated XOS were dissolved in 2 mL of 90% HCOOH,and the solution was exposed to microwave irradiation under 400 Wand 100°C for 5.5 min,and then the solution was evaporated to dryness with a nitrogen evaporator.Subsequently,the residue was redissolved in 2 mL of 2 M TFA and exposed to microwave irradiation under 400 Wand 100°C for 5.5 min.Finally,the partially methylated monosaccharides were reduced with NaBH4,and neutralized with acetic acid,then acetylated with acetic anhydride.The derivatives were analyzed by using an Agilent 6890 gas chromatography instrument coupled to an Agilent 5973 mass spectrometer(Agilent Technologies,Palo Alto,CA,USA).A capillary column(30 m×0.25 mm i.d.)coated with 0.25μm film 5% phenyl methyl siloxane was used for separation.High purity helium was used as carrier gas with a flow rate of 1 mL/min.The column temperature was set at 120°C and held for 7 min for injection,then programmed at 5°C/min to 185°C and held for 5 min,at 5°C/min to 200°C,and immediately,at 8°C/min to 250°C,and held for 2 min.The split ratio was set as 10:1.The spectrometers were operated in electron impact mode,the ionization energy was 70 eV,and the scan rate was 0.34 s per scan.The temperatures of ionization source and the transfer line were 150°C and 280°C,respectively.
3.Results and discussion
3.1.Saccharides analysis by HPTLC
HPTLC is conventionally used for routine quality control of complex herb medicines or health foods[32,33].HPTLC method can provide vivid colorful images,which is convenient for components classification[18].We have developed a saccharide mapping method based on HPTLC for the simultaneous determination of seven fructooligosaccharides(FOS,DP3-DP9)in Morinda officinalis How.(M.officinalis)and Arctium lappa Linn.(A.lappa),which was found to be simple,stable,and reproducible[29].In addition,XOS up to DP6 hydrolyzed from xylan were separated by using HPTLC in our previous work[27].Therefore,we applied this method for the analysis of 22 commercial samples of XOS,and the HPTLC chromatograms are present in fig.1A.From lines S1,S2 and S4,the xylose,xylobiose and xylotriose are showed in grayish yellow with the Rf of 0.73,0.50 and 0.31,respectively.Glc and Mal are of blue color with the Rf of 0.58 and 0.38,respectively.The results from Fig.1A indicated that the chemical pro files of the tested samples were significantly different.XY01-XY11 showed comprehensive characteristics of XOS,though some hex oligosaccharides were present in XY01,XY02,XY03,XY08 and XY10,which might be derived from the hemicellulose in their original raw materials.Notably,no bands of xylose,xylobiose or xylotriose were detected in samples XY12,XY13 and XY14 except for the hydrolysate of glucan or isomaltooligosacharide.Moreover,samples XY17(Rf= 0.57)and XY22(Rf= 0.57)might be fructose,and XY20/XY21(Rf=0.73)might be xylose according to their HPTLC chromatogram.Particularly,no bands were detected in XY15,XY16,XY18 or XY19,which suggested that these samples might be free of sugars.Therefore,samples from XY01 to XY14 which contained the oligosaccharides were scanned,and the peak areas of xylose,xylobiose and xylotriose were normalized to corresponding reference standards(Fig.1B),and samples XY15-XY22 without oligosaccharides bands were excluded for this data analysis.There was a down trending of the relative contents of XOS from XY03 to XY07.Besides,the proportions of xylose,xylobiose and xylotriose also varied,which indicated the semiquantitaitve capacity of XOS analysis by using HPTLC method.In addition,hierarchical cluster analysis(HCA)based on the scanning densitometry of samples XY01-XY14 was also carried out using ORIGIN 9.1 software(OriginLab Corp.,Northampton,MA,USA).It can be seen from the HCA dendrogram(Fig.1C)that samples XY01-XY11 contained XOS in one cluster,while samples XY12-XY14 without XOS were in the other cluster.Therefore,this developed HPTLC method could be applied for the differentiation of XOS samples from their adulterants,and would be an important tool for the quality control of XOS in the market.However,oligosaccharides with higher DP were poorly separated with low resolution and sensitivity[27],which was one of the inherent defects of HPTLC method.In addition,saccharides analysis using HPTLC usually took more than 3 h for one plate,which hampered the detection efficiency.To increase accuracy and speed,saccharide analysis using MALDI-MS was applied.As HPTLC detection is very convenient and affordable,it is necessary to establish HPTLC standard fingerprint as a preliminary screening method.

Fig.1.(A)HPTLC pro files of tested samples XY01-XY22,(B)peak areas of xylose,xylobiose and xylotriose in samples XY01-XY14 normalized to corresponding standards,and(C)hierarchical clustering analysis of oligosaccharides samples XY01-XY14.S1:Rha,Xyl,Fru,Suc;S2:Glc,Xylobiose,Mal,Xylotetraose;S3:Partial acid hydrolysates of dextran;S4:Partial acid hydrolysates of xylan.The sample codes are the same as that in Table 1.
3.2.Saccharide mapping analysis based on MALDI-MS
Compared to HPTLC method that needs more than 3 h[29],saccharide mapping analysis based on MALDI-MS is very fast.It takes about 35 min including mixture preparation of sample and matrix,sample spotting on the plate,and sample drying.The MS spectra can be acquired in seconds for one sample[27].The oligosaccharides were separated based on the difference of m/z using MALDI-MS.The m/z for XOS with DP3-DP10 is 437,569,701,833,965,1097,1229 and 1361,respectively,which can be easily resolved.But HPTLC is difficult for separation of oligosaccharides with higher DP.Therefore,MALDI-MS is a better choice for oligosaccharides identification with high polymerization.
Saccharide mapping based on MALDI-MS profiling was employed for quality evaluation of XOS from different manufacturers(XY01-XY22).First,matrix DHB,CHCA,SA,and ISL were tried for analysis of sample XY01.Morphological differences in the crystal layers resulting from sample deposition in DHB,CHCA,SA,and ISL with sample are shown in fig.2.DHB preparation formed needle-like crystals across the spot(Fig.2A).CHCA preparation formed point-like crystals(Fig.2B)and SA formed cotton-like crystals(Fig.2C)distributed over the sample surface.In the case of ISL,a very homogenous surface was obtained(Fig.2D),which suggests the even distribution of‘hot’sites that could offer greater spot-to-spot reproducibility.Indeed,compared with traditional matrices DHB,CHCA,and SA,ISL has several advantages such as forming more homogeneous crystals,better detection limits,S/N,reproducibility,and resolution,which has been systematically evaluated by Yang et al.[30].Therefore,matrix ISL was selected for the analysis of XOS samples.

Fig.2.Images of sample mixtures with(A)DHB,(B)CHCA,(C)SA or(D)ISL as matrixes by dried-droplet method.
Commercial XOS are usually derived from plant cell walls by chemical or enzymatic digestion methods.The main chains of XOS are composed of β-(1-4)-linked xylopyranose(Xylp)residues.In addition,XOS chains are usually substituted by glucuronic acid(GlcA)or its 4-O-methyl derivative(MeGlcA)residue.Furthermore,acetyl groups and/or minor arabinofuranosyl(Ara)residues are also identified as substituents[34].When subjected to MALDI-TOF-MS,pseduomolecular ions of all XOS were observed as[M+Na]+as described in the previous literature[27,34-36].The typical mass spectra of three samples,XY01(with pentose and hexose oligosaccharides),XY07(only with pentose oligosaccharides)and XY13(only with hexose oligosaccharides),are shown in fig.3.The mass difference of abundant ions m/z 305,437,569,701,833,965,1097,1229,1361,and 1493 in sample XY01 was 132 Da in fig.3A.A pentose residue is responsible for this mass difference,which might be due to the neutral XOS composed of 2-11 Xyl residues.These ions were identified as Xn,where n shows the number of Xyl residues.The ions of m/z 479.1,611.1,743.2,875.2,1007.3,1139.3,1271.3 and,1403.4 had 42 Da increase compared with X3-X11,which can be assigned to XOS substituted with one acetyl groups,Ac1Xn.Similarly,ions of m/z 653.1,785.2,917.2,1049.3,1181.3,1313.4 and 1445.4 with 84 Da increase compared to Xn can be identified as Ac2Xn.XOS substituted with one GlcA residue were also found in higher mass range,and ions of m/z 1273.3,1405.4,1537.4 and 1669.4 were found 176 Da increase compared with X8-X11.XOS substituted with MeGlcA residue were negligible in XY01.Notably,ions of m/z 365.1,527.1,689.2,1013.3,1175.3,1337.3,1449.4,1661.5,1823.5,and 1985.6,with 162 Da mass difference were attributed to a hexose residue,which might be due to the oligosaccharides composed of 2-12 Glc residues.These ions were defined as Gn,where n shows the number of Glc residues.XOS substituted with one Glc residue were also identified at ions of m/z 599.1,731.2,863.2,955.3,1127.3,1259.3,1391.4 and 1669.4,with 162 Da increase compared with Xyln.XOS with other minor substitutions such as three or more Glc residues or acetyl groups might also be present in the sample with low intensity.Based on the results,the constituents of sample XY01 were very complex,frequently substituted with GlcA residue and/or acetyl groups.Similar results were also identified from samples XY02,XY03,XY04,XY05,XY08,XY10 and XY11,which was in accordance with the results of HPTLC analysis and suggested a small quantity of hexose oligosaccharides was present in these samples.
It is interesting that predominant ions in sample XY07(Fig.3B)were observed at m/z 437,569,701,833,965,1097,1229 and 1361 for X3to X10.Compared with Xn,the ions with low intensity at m/z 627,759,891,1023,and 1155,with 190 Da increase,can be attributed to oligosaccharides substituted with one MeGlcA residue,identified as XnM(Fig.3B).The ions at m/z 649,781,914,1046,and 1179 close to XnM oligosaccharides,with 22 Da increase to XnM,might result from the double sodiated ions[M - H +2Na]+.These ions were only observed for XOS with MeGlcA residue,which were attributed to the substitution of one hydrogen atom by a second sodium atom[34].The results indicated the high purity of XOS in sample XY07.The predominant ions in sample XY13(Fig.3C)were only observed at m/z 365.1,527.1,689.2,1013.3,1175.3,1337.3,1449.4,1661.5,1823.5,and 1985.6,with mass difference of 162 Da.This mass difference could result from a hexose residue,which might be because the oligosaccharides are composed of 2-12 Glc residues.These ions are defined as Glcn,where n shows the number of Glc residues.Samples XY12 and XY14 showed the similar spectra,which indicated that no XOS was present in these samples.Finally,the MALDI mass spectra of samples XY01-XY22 are shown in fig.S1,and the oligosaccharides peaks(XY01-XY14)observed in the spectra are listed in Table S1.XOS were found in sample XY01-XY11,while only hexose oligosaccharides were identified in samples XY12,XY13 and XY14,which is in accordance with the results of HPTLC.Especially,no ions responsible for oligosaccharides were detected in the rest eight samples(XY15-XY22).

Fig.3.The typical mass spectra of samples.(A)XY01 with XOS and hexose oligosaccharides,(B)XY07 with only XOS and(C)XY13 without XOS.
Fig.4 shows principal components analysis(PCA)of samples XY01-XY14 in this work,but samples XY15-XY22 without oligosaccharides ions were excluded for this data analysis.PCA was performed by using the Mass-Up v1.0.9 open source program(http://sing.ei.uvigo.es/mass-up/)according to a previous report[37].From the 3D default camera,it can be seen that XOS samples can be classified into two groups:XOS samples with minor(XY01,XY02,XY04,XY05,XY06,XY09,XY11)or higher intensity(XY03,XY08,XY10)of hexose oligosaccharides and XOS samples with only hexose oligosaccharides(XY12,XY13,XY14).Sample XY07 was special because the sample only contained XOS and their derivatives.The results indicated that the established MALDI-MS saccharide mapping method could authenticate XOS from other adulterated and even fake materials.Absolutely,more samples are needed for the verification.In addition,pentose oligosaccharides(such as Ara 5 and Xyl 5)or hexose oligosaccharides(Glc 5 and Gal 5)with the same molar mass could not be discriminated by MALDIMS.Therefore,GC-MS was applied for the confirmation of Xylor Glc in the tested samples based on glycosidic linkage analysis.

Fig.4.Mass-up 3D principal component analysis of samples XY01-XY14.(A)default camera,(B)top camera,(C)left camera,and(D)right camera.
3.3.Glycosidic linkage analysis by GC-MS
It is reported that XOS are sugar oligomers containing 2-7 xylose monomeric units linked through β-(1,4)-xylosidic linkage[1,38].GC-MS analysis is usually used for the characterization of glycosidic linkage in carbohydrates[31,39],and applied for the structure identification of XOS in our prevous work[27].Therefore,glycosidic linkages of samples with oligosaccharides(XY01-XY14)were analyzed by GC-MS to verify the presence of XOS(Fig.5).The results showed that the linkages of T-Xylp and 1,4-Xylp were most frequently identified from XY01 to XY11,which Confirmed the presence of XOS in these samples.Besides,glycosidic bond was present in XY03,XY08 and XY10 since T-Glcp and 1,4-Glcp were detected,indicating that some additives existed and the proportion of glycosidic linkages is listed in Table 2.In addition,a small proportion of 1,3-Araf was also found in samples XY01-XY11,as minor Ara residues were frequently found as substituents[34].However,only T-Glcp,1,4-Glcp and small proportions of 1,6-Glcp existed in samples XY12,XY13 and XY14(Fig.5),which demonstrated that adulterates were present in these samples without XOS.These results further Confirmed the above findings of HPTLC and MALDI-MS saccharide mapping analysis.
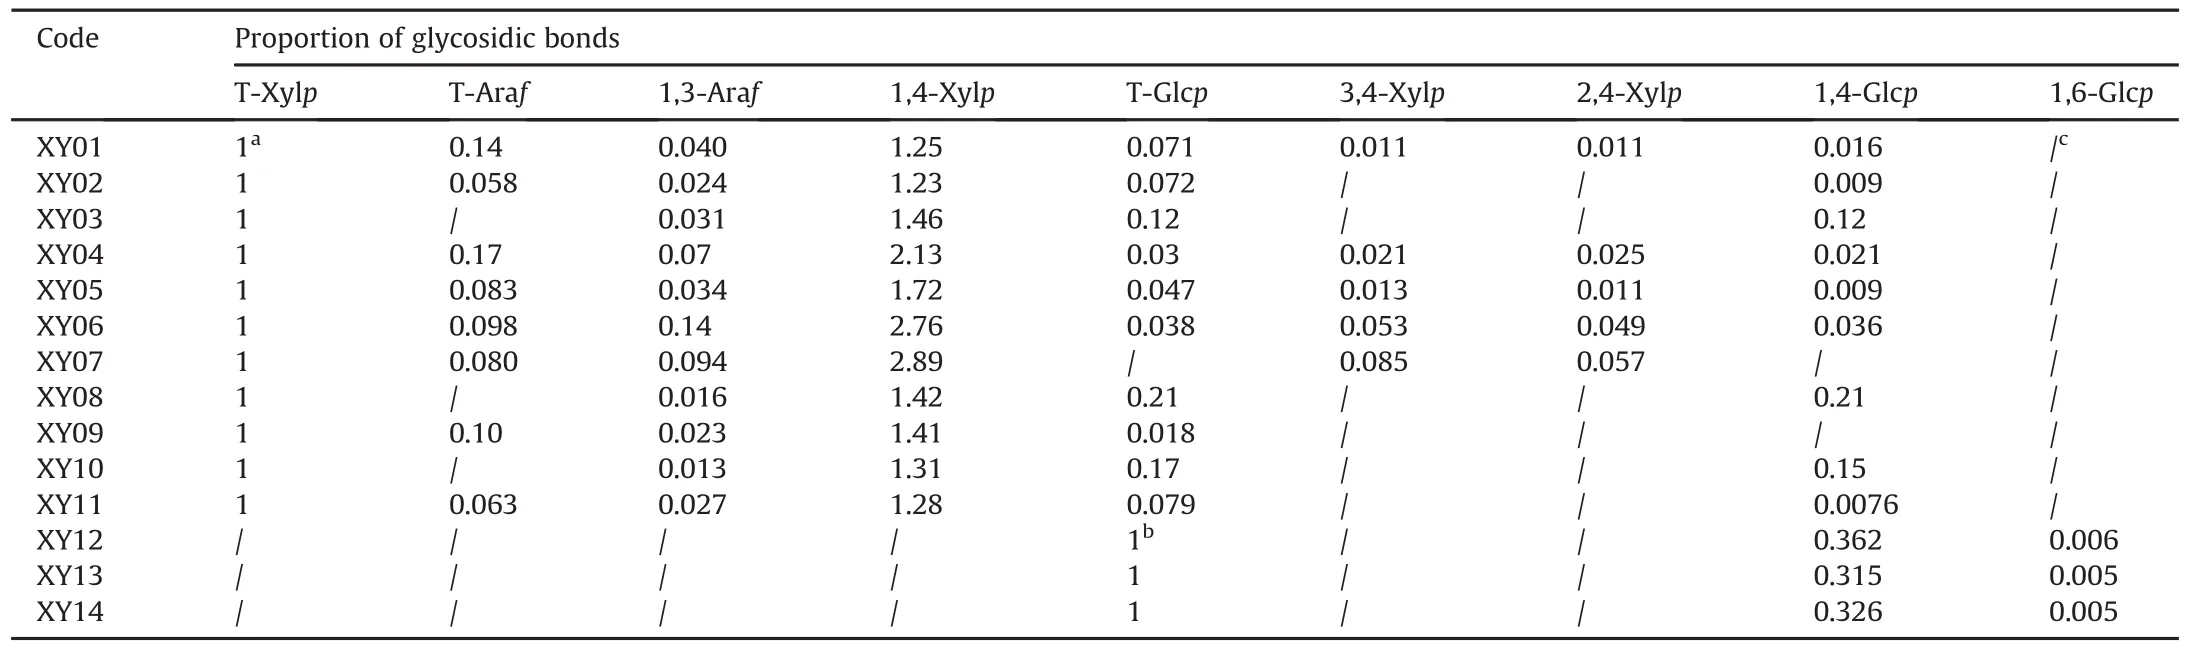
Table 2 Proportion of glycosidic bonds.
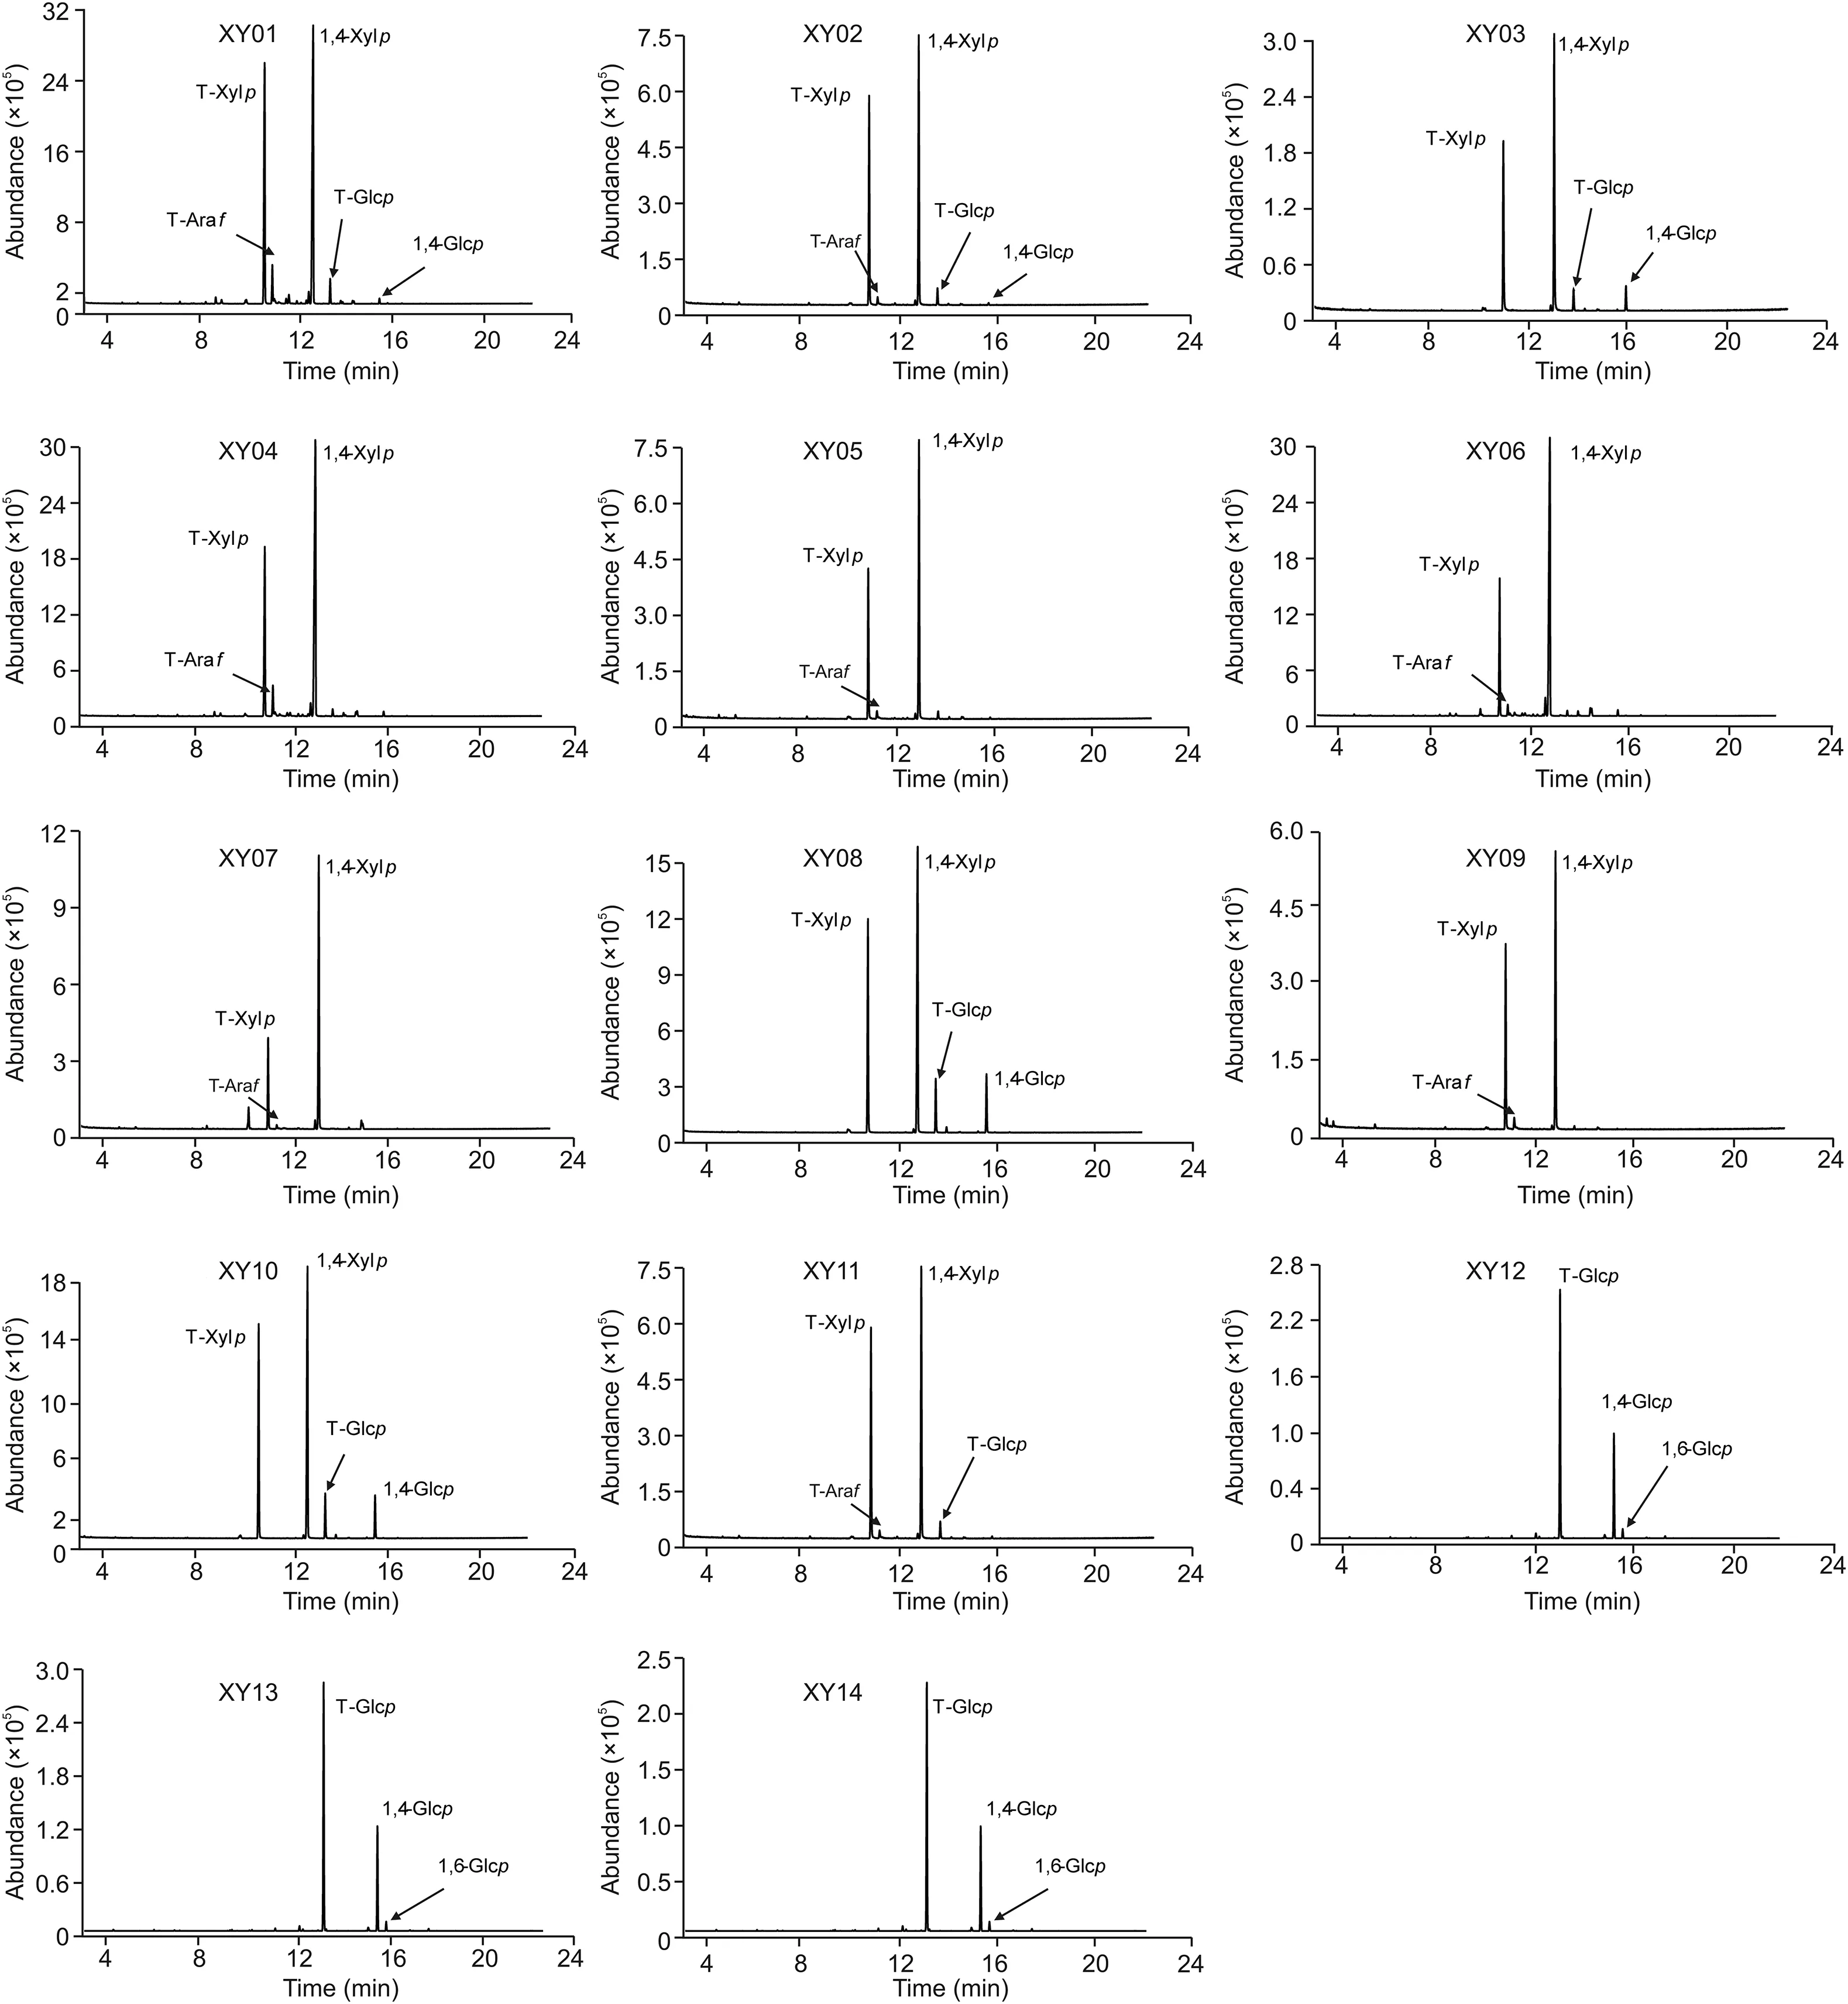
Fig.5.GC-MS pro files of glycosidic linkages of samples XY01-XY14 with oligosaccharides.
4.Conclusions
Saccharides mapping method based on MALDI-TOF-MS was applied for the quality evaluation of XOS collected from different manufacturers in China,and the presence of XOS was further verified by GC-MS based on glycosidic linkage analysis.This analysis comparing 22 commercially available XOS products demonstrated that 50% of these products were mislabeled,which suggested the urgent improvement of the quality of commercial XOS products in the market.Accordingly,saccharide mapping based on MALDI-MS analysis was suitable for the rapid authentication of commercial products of XOS used for food ingredients based on the chemical characteristics.
Declaration of competing interest
The authors declare that there are no conflicts of interest.
Acknowledgments
The research was partially funded by grants from the National Natural Science Foundation of China(No.81673389),the National Key R&D Program of China(2019YFC1711300),the Science and Technology Development Fund,Macau SAR(File no.0075/2018/A2,034/2017/A1 and 0017/2019/AKP),and the University of Macau(File no. MYRG2018-00083-ICMS, MYRG2019-00128-ICMS,CPG2020-00021-ICMS).
Appendix A.Supplementary data
Supplementary data to this article can be found online at https://doi.org/10.1016/j.jpha.2020.08.013.
 Journal of Pharmaceutical Analysis2021年3期
- Journal of Pharmaceutical Analysis的其它文章
- Molecular detection of SARS-CoV-2 being challenged by virus variation and asymptomatic infection
- The potential of miRNA-based therapeutics in severe acute respiratory syndrome coronavirus 2(SARS-CoV-2)infection:A review
- Potential treatment with Chinese and Western medicine targeting NSP14 of SARS-CoV-2
- Accurate and sensitive determination of hydroxychloroquine sulfate used on COVID-19 patients in human urine,serum and saliva samples by GC-MS
- Dispersive liquid-liquid microextraction,an effective tool for the determination of synthetic cannabinoids in oral fluid by liquid chromatography-tandem mass spectrometry
- Identification and quantification of the bioactive components in Osmanthus fragrans roots by HPLC-MS/MS