Effects of W6+occupying Sc3+on the structure,vibration,and thermal expansion properties of scandium tungstate∗
Dongxia Chen(陈冬霞) Qiang Sun(孙强) Zhanjun Yu(于占军) Mingyu Li(李明玉)Juan Guo(郭娟) Mingju Chao(晁明举) and Erjun Liang(梁二军)
1School of Materials Science&Engineering,Zhengzhou University of Aeronautics,Zhengzhou 450046,China
2Key Laboratory of Materials Physics of Ministry of Education,School of Physics and Microelectronics,Zhengzhou University,Zhengzhou 450052,China
Keywords: structure,negative thermal expansion,Raman spectroscopy
1. Introduction
Materials with negative thermal expansion (NTE) property have potential applications in many fields such as precision optics, optoelectronic devices, and aerospace materials. Usually, NTE materials can be compounded with positive thermal expansion materials or tailored chemically to attain near zero or controllable thermal expansion materials.Such materials are especially suitable for use in heat cycles due to the low mismatch or less thermal stress. AW2O8[1]and AV2O7(A=Zr, Hf)[2,3]are two types of well-known framework NTE oxides which possess isotropic NTE property and wide temperature ranges of NTE.A number of studies have shown that AW2O8is metastable at high temperature, while AV2O7undergoes a structure phase transition at about 427 K. Materials with general formula of A2M3O12(A=+3 ions; M=Mo, W) also exhibit NTE properties in a wide temperature range but NTE is anisotropic. Except for Sc2W3O12,[4,5]all the members of A2M3O12family show either structure phase transition(e.g.,Fe2Mo3O12,Cr2Mo3O12,Al2Mo3O12,[6]Al2W3O12and In2W3O12)[7]or hydroscopicity (e.g., Yb2Mo3O12,[8]Y2Mo3O12[9]and Y2W3O12).[10]A great deal of research has been carried out to control the phase transition or hydroscopicity of A2M3O12by substituting A4+or M6+with other ions.[11–19]In addition, PbTiO3based ferroelectric transition materials,[20–22]Mn3AN based materials with magnet volume effect[23–25]and TaVO5[26]also exhibit NTE properties.
Recent years, tetra-molybdates with NTE properties in a narrow region have been reported, e.g., Ln2Mo4O15(Ln=Y,Dy, Ho, Tm),[27]Ce2(MoO4)2(Mo2O7),[28]and R2Mo4O15(R=La, Nd, Sm).[29]It is worth noting that all of these materials adopt monoclinic structure, of which, two Mo(2)O4tetrahedra are connected by a bridge O atom to form a pyromolybdate Mo(2)2O7group that is similar to V2O7group in ZrV2O7. One Mo(2)2O7polyhedron is weakly joined with two Mo(1)O4tetrahedra by sharing O atoms to form an entire Mo4O15group. Each+3 metal atom is coordinated with seven oxygen atoms to constitute a single capped trigonal prism.
Meanwhile, Cu2P2O7has been found to exhibit the strongest NTE among the oxides (αv∼−27.69×10⁻⁶K−1,5 K–375 K).[30]The NTE behaviors of Prussian blue analogues, e.g., FeFe(CN)6,[31]MII2MIV(CN)8(MII= Ni, Co,Fe, and Mn; MIV= Mo and W),[32]ScCo(CN)6[33]and YFe(CN)6[34]were also reported in recent years.
In this paper,a new tungstate(Sc6W2)W12O48±δwith the structure similar to the orthorhombic structure of Sc2W3O12is studied by two W6+occupying two sites of Sc3+in the unit cell of Sc2W3O12. The structure, vibration and thermal expansion properties of the doped sample are investigated experimentally. The results of Rietveld refinement of synchronous x-ray diffraction(SXRD)data indicate that the structure of the doped sample is similar to that of orthorhombic Sc2W3O12.Blue shifts of peak positions and increasement of FWHMs are found in the spectrum of the doped sample by comparing the Raman spectrum with that of Sc2W3O12. The distortion of polyhedra and stress introduced by W6+occupying Sc3+in the unit cell are attributed to those changes. In order to demonstrate this structure of the doped sample, the effects of odd/even W6+occupying the odd/even sites of Sc3+in the unit cell on the stability of crystal are studied by first-principles calculations based on DFT.It is shown that the structure by odd W6+occupying odd Sc3+in the unit cell is unstable because of the severe distortion of the unit cell,while it is stable by even W6+occupying even Sc3+in the unit cell. Simultaneously,according to the changes of cell parameters with temperature,an intrinsic NTE property is discovered in the doped sample.
2. Experimental procedure and computational details
The sample of (Sc6W2)W12O48±δwas synthesized by a solid-state reaction method. Commercial chemicals Sc2O3and WO3(99.9% purity) were used as the starting materials.The materials were weight according to the stoichiometric ratios, then mixed and ground in a mortar for 2 h. The obtained uniform powders were transferred to a corundum ark and heated in a tube furnace of 1753 K for 5 min,then rapidly quenched in deionized water and placed in of about 400 K for 0.5 h. Repeat the above procedure, the sample was sintered for a second time at 1753 K for 1 h. To ensure the purity,the sample was sintered for a third time at 1753 K for 30 min and then cooled out. The sintered powders were reground,pressed into pellets then sintered again at 1173 K for 30 min.
X-ray photoelectron spectrometer (XPS) (Axis Ultra,Kratos,UK)was used to analyze the composition of the doped sample and the valence of the elements.The casaXPS(version 2.3.16) software was used to process the data. Crystal structure and CTEs of the sample were determined by synchrotron x-ray diffraction(SXRD).Temperature-dependent SXRD data were collected by an instrument 11-ID-C at the Advanced Photon Source with a wavelength of 0.11730 ˚A.The structure together with lattice constants was refined using an orthorhombic structural model (space group:Pbcn). All the calculations of structure and lattice constants were performed on Fullprof software (version 1.10). Raman spectra were recorded by a LabRAM HR Evolution Raman spectrometer (France HORIBA Jobin Yvon S.A.S.) with the excitation wavelength of 532 nm.
To predict the stable structure of the doped system, the first-principles calculations based on DFT were performed as implemented in the Viennaab initiosimulation package (VASP).[35]The ion–electron interaction is depicted by projector augmented wave (PAW) method,[36]and the exchange and correlation effects are described by the GGA-PBE functional.[37]The wave functions are expanded by the plane waves up to an energy cutoff of 380 eV.Due to the large unit cell(∼10 ˚A×10 ˚A×13 ˚A),integrals over the first BZ are approximated by a Monkhorst–PackK-point mesh of 1×1×1.The total energy was calculated with high precision,converged to 10−7eV/atom, and the structural relaxation was stopped when the residual forces become less than 10−3eV/˚A.
The substitutional energy of Sc replaced by W is calculated by

whereEsubis substitutional energy,EdopedandEundopedare the total energy of W doped and undoped systems, respectively;ESc(atom)andEW(atom)are energy of per Sc or W atom;nis the number of substitutional W.
3. Results and discussion
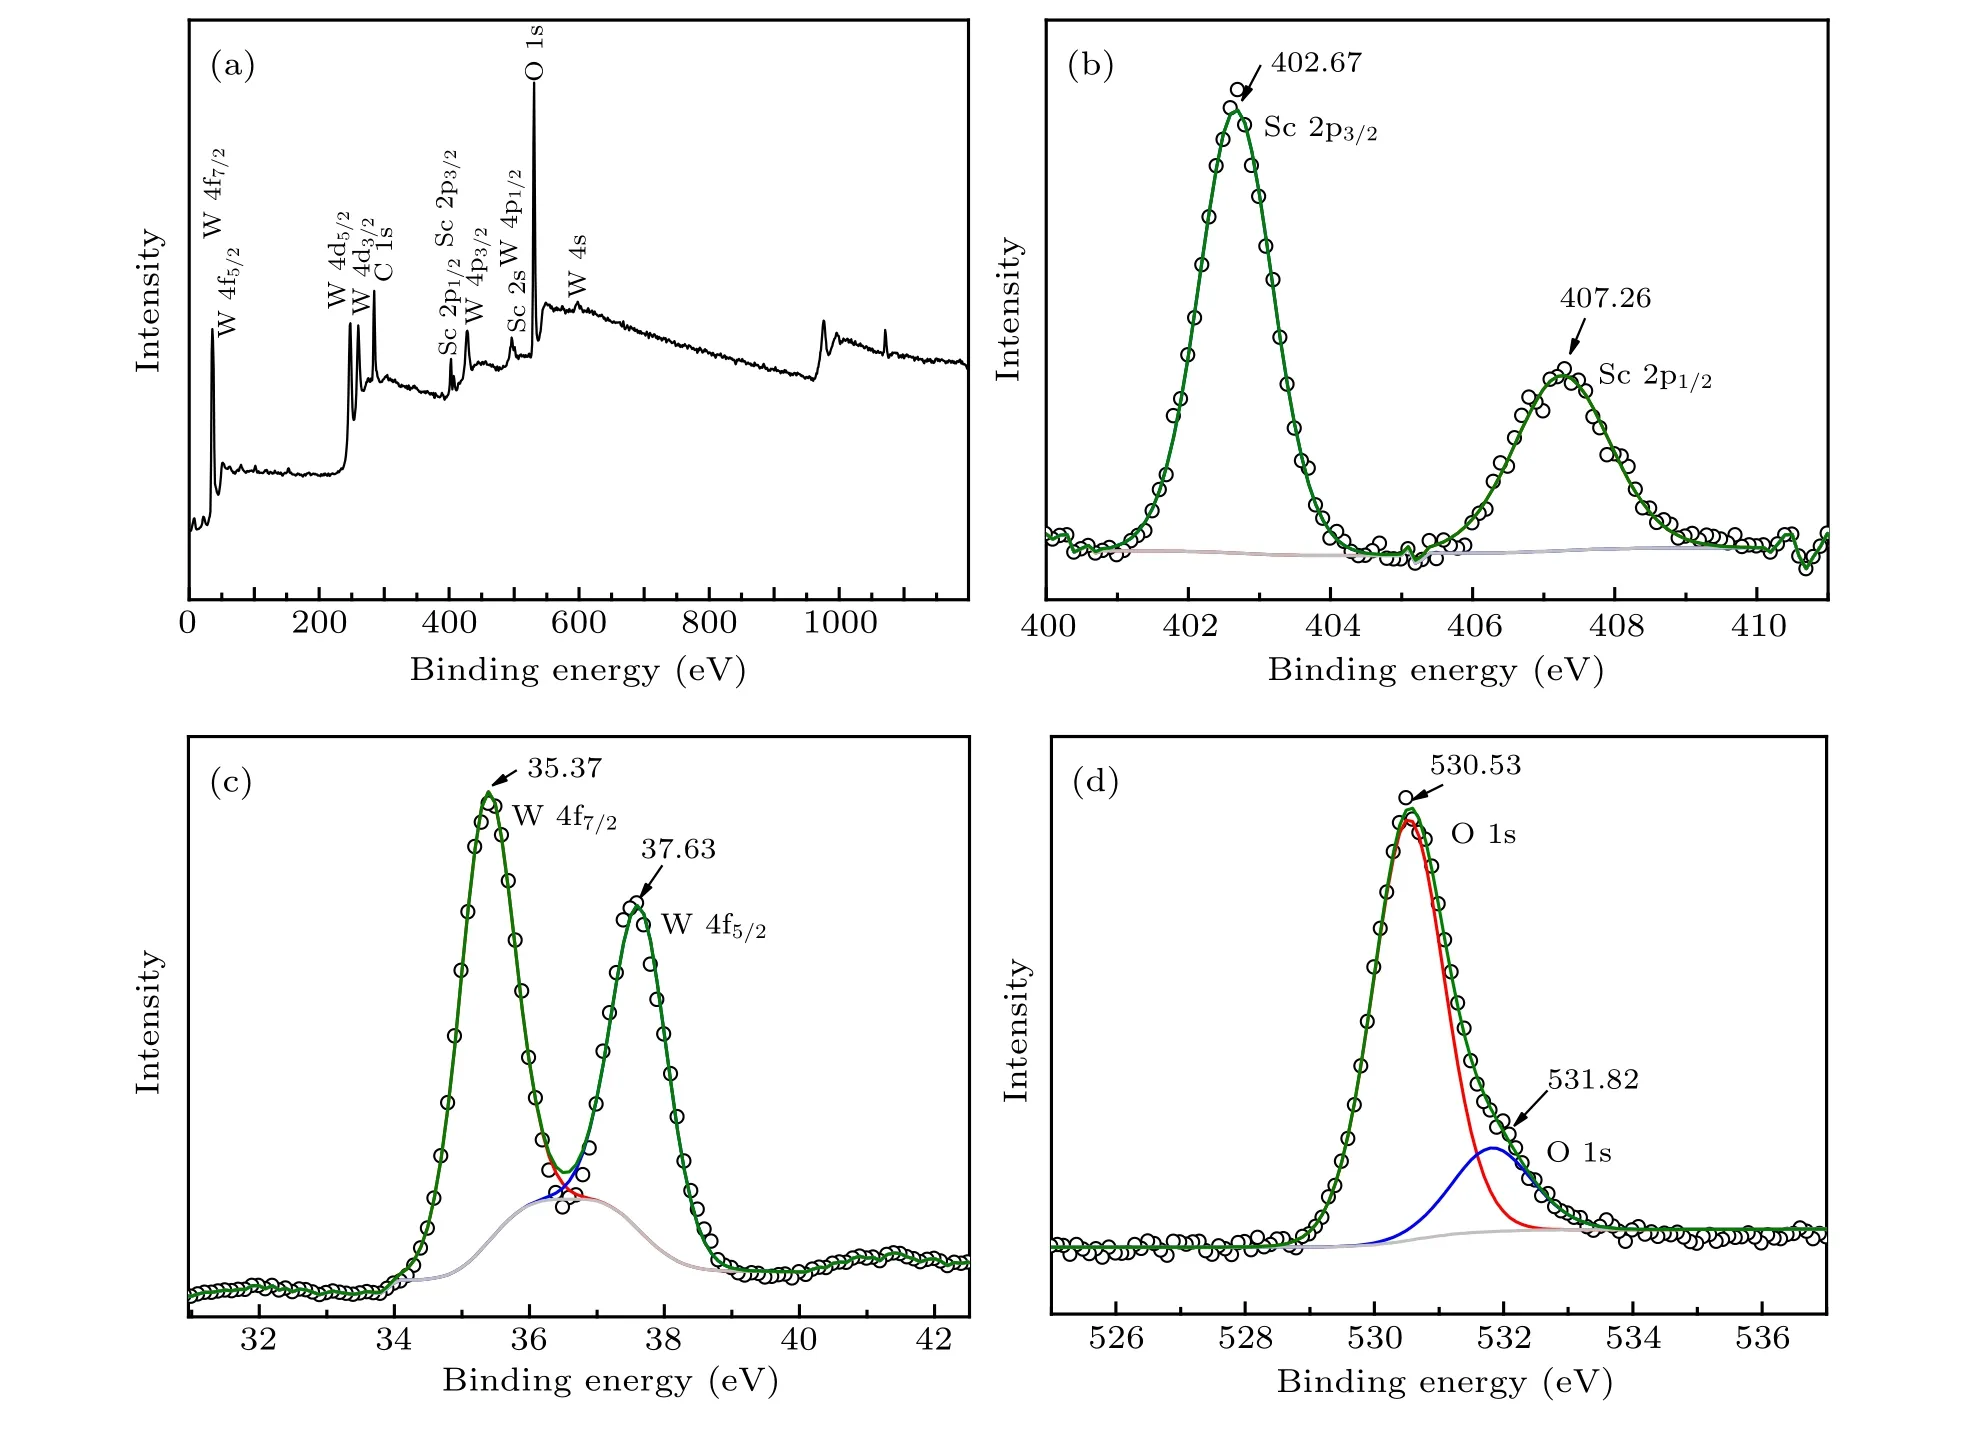
Figure 1(a) shows the XPS total spectrum of the doped sample. It can be seen that the spectrum contains the elements of C,Sc,W and O.The C element is derived from the experimental oil pump. Figures 1(b)–1(d) give the XPS spectra of Sc 2p,W 4f and O 1s. The integrated areas of the XPS peaks were calculated to determine the atomic ratio of the sample.Lorenz fittings of the peaks were used to determine the binding energies of Sc 2p,W 4f and O 1s and then the valence of element. The spin-orbit splitting of Sc 2p into 2p3/2and 2p1/2were found in the Sc 2p spectrum. The corresponding binding energies are 402.67 eV and 407.26 eV, respectively. The W 4f spectrum(Fig.1(c))can be fitted by two Lorenz peaks with the binding energies of 35.37 eV and 37.63 eV for W 4f7/2and W 4f5/2,respectively. It indicates that the tungsten ions in the sample are in+6 valence. By fitting the spectrum of O 1s(Fig. 1(d)), the binding energies were found to be 530.53 eV and 531.82 eV. Table 1 gives the semi-quantitative results of the XPS spectra. It can be seen that the atomic ratio of the sample is Sc:W:O≈1:2.50:9.68, which is very close to the design ratio of 6:14:48±δ.

Table 1. The integration results of the XPS peaks and the atomic ratio of Sc 2p,W 4f and O 1s.

Fig.1. XPS spectra of the doped sample: (a)total XPS spectrum;(b)–(d)XPS spectra corresponding to the Sc 2p,W 4f,and O 1s.
Figure 2(a)gives the Rietveld refined results of the XRD spectrum at 300 K for the doped sample (the black curve as the measured intensity;the red symbol as the calculated intensity).The results show that the sample adopts an orthorhombic structure at room temperature with space groupPbcn(No.60).The lattice constants obtained by the refinement are as follows:a=13.2461(6) ˚A,b=9.52801(5) ˚A,c=9.6208(5) ˚A,V=1214.2(1) ˚A3. The reliability factors for the refinement are as follows:Rp=11.4,Rwp=13.9 andRexp=1.61. The cell parameters of the basic material Sc2W3O12at room temperature(300 K) reported previously[38]are as below:a=9.6720 ˚A,b=13.318 ˚A,c=9.5795 ˚A,V=1234.0 ˚A3. Comparing the two sets of data, it is not difficult to find that the cell parameters of the doped sample are slightly smaller than those of Sc2W3O12. Figure 2(b) shows a partial enlargement of the XRD pattern of the sample at 300 K.Each peak in the figure can be well indexed. Table 2 provides the metal coordinates and atomic occupancies of the doped sample and Sc2W3O12.As can be seen from the table, it contains three unequivalent positions of W in the unit cell of the doped sample, where∼16% of the Sc positions are occupied by W. Figure 2(c)presents the structure schematic diagram of the doped sample by the Rietveld refinement. The framework of the crystal consists of corner-shared WO4tetrahedra and ScO6/WO6octahedra. There are four W(1)O4tetrahedra and eight W(2)O4tetrahedra occupying the normal lattice positions similar to Sc2W3O12. The additional W(3) occupies the positions of Sc and forms WO6octahedra. Each ScO6/WO6octahedron shares its six oxygen atoms with the adjacent WO4tetrahedra,and each WO4tetrahedron shares all of its oxygen atoms with the adjacent ScO6octahedra. Therefore, the structure can be regarded as quasi-rigid unit modules (QRUMs). It can be concluded that the synthesized sample crystallizes into an orthorhombic structure similar to that of Sc2W3O12, and with two W6+occupying two sites of Sc3+in the unit cell of Sc2W3O12.
Figure 2(d) gives the temperature-dependent SXRD patterns of the doped sample. As temperature increasing,no significant change was observed in the patterns, indicating that no phase transition occurs within 150–650 K.Also, there are no impurity peaks in the patterns other than the XRD peaks of the orthorhombic structure, indicating that the sample is a pure single-phase material.

Fig. 2. (a) Results of the Rietveld refinement of the SXRD pattern at 300 K. (b) The partially enlarged SXRD pattern at 300 K with Peaks indexed. (c)Schematic diagram of the doped sample with orthorhombic symmetry depending on our experiments. O atoms are shown in red balls,ScO6/WO6 octahedra in purple and WO4 tetrahedra in gray. (d)SXRD patterns of the doped sample measured from 150 K to 650 K.

Table 2. Metal atomic coordinates of the doped sample and Sc2(WO4)3.
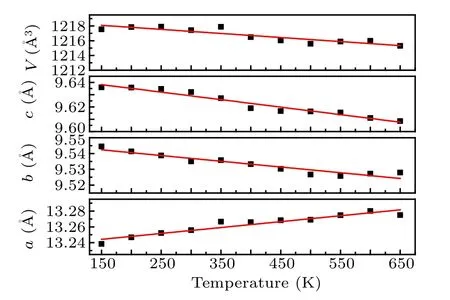
The lattice parameters at deferent temperatures were calculated by the method of LeBail fit. Figure 3 shows the changes of the lattice constants of the doped sample as a function of temperature. As can be seen from the figure,thea-axis expands while theb-axis and thec-axis continuously contract as temperature increasing, which eventually cause a continuous contraction of the volume. The linear CTEs of thea,bandcaxes in 150–650 K are calculated to be 5.64×10⁻⁶K−1,−3.80×10⁻⁶K−1and−6.33×10⁻⁶K−1,respectively,which results in a volumetric CTE of−4.52×10⁻⁶K−1and a linear CTE of−1.51×10⁻⁶K−1.An intrinsic NTE in the doped material is determined. This absolute value of linear CTE is a little smaller than that of the reported value−2.2×10⁻⁶K−1for Sc2W3O12at 10–450 K.[38]The little changes of cell parameters between the doped and undoped materials can be used to explain the little change of linear CTE.
Figure 4(a) shows the Raman spectra of the doped and undoped samples at room temperature. All the Raman modes can be identified by referring to the literature on spectroscopy studies.[3,15,39]Usually, the symmetric modes of tungstate crystal are located in the areas of the higher frequencies.Here,a strong mode centered at 1024.3 cm−1,a shoulder mode near 1008.4 cm−1and a weak mode near 974.1 cm−1all can be assigned to the W–O symmetric stretching vibrations(ν1)of the WO4tetrahedra. A weaker mode centered at 959.1 cm−1,two shoulder modes near 850.3 cm−1and 842.5 cm−1,and a strong mode near 828.1 cm−1all can be identified as the W–O asymmetric stretching vibrations (ν3) of the WO4tetrahedra. The mode centered at 354.9 cm−1is recognized as the antisymmetric bending vibration(ν4)of the WO4tetrahedron. The modes near 327.5 cm−1and 287.7 cm−1are assigned to the symmetric bending vibration(ν2)of the WO4tetrahedron and the rotation (T'(Sc3+)) of the Sc3+, respectively. The mode near 258.2 cm−1is considered as the rotation (T'(Sc3+)) of Sc3+.The mode below 200 cm−1is deemed as the translational and liberations(T'(WO4),L(WO4))of the WO4tetrahedra.

Fig.3. The changes of the lattice constants with temperature.
Lorentz peak fitting was used to find the subtle differences between the Raman spectra of the doped and undoped samples as shown in Figs. 4(a)–4(d). Most stretching and bending modes of the doped sample are located in the positions of higher wave numbers (blueshifts) than that of Sc2W3O12,indicating that the W–O bonds of the doped sample are somewhat stronger (harder) than those of Sc2W3O12. This is due to the stress introduced by W(3)6+occupying the positions of Sc3+and the distortion of the crystal. The electronegativity of Sc3+(1.36)differs greatly from that of W6+(2.36),which results in the significant difference of distributions of negative charges between the doped and undoped samples, and distinct changes of bond strength between the metal atom and the oxygen atom and the introduction of stress. In addition,the apparent difference of ionic radius between W6+(0.41 ˚A)and Sc3+(0.73 ˚A) also inevitably causes distortions of polyhedra, thus stresses are introduced. Combining it with the shrink of the unit cell volume, we can infer the stress to be compressive stress. Since the changes of bond strength and introduced stress usually cause blueshift or redshift in Raman mode frequency,the mode frequencyωiof the doped sample can be expressed by the sum of the natural frequencyωi0(T)of Sc2W3O12and the change of frequency ∆ωiintroduced by W(3)6+occupying Sc3+sites,that is,ωi=ωi0(T)+∆ωi.

Fig. 4. (a) Raman spectra of the doped sample and Sc2W3O12 at room temperature; (b)–(c) Lorentz fits of the spectra; (d) FWHMs of the Raman peaks of the spectra,squares and circles represent the data of the doped sample and Sc2W3O12,respectively.
Figure 4(d) gives the comparison of full width at half maximum(FWHM)of Raman peaks of the two spectra. Obviously,the FWHMs of the doped sample are larger than that of Sc2W3O12,indicating the wider linewidths of Raman peaks in the doped sample, due to the distortion of polyhedra and stress introduced. Thus the Raman linewidth,Γ,of the doped sample can be expressed by the sum of the natural linewidth,Γ0(T),of Sc2W3O12and the variation of linewidth ∆Γcaused by W(3)6+occupying Sc3+site,namely,Γ=Γ0(T)+∆Γ.
Structure stability of different Sc3+occupied by W6+in the unit cell of Sc2W3O12was analyzed by first-principles calculations based on DFT.Results show that with one W6+occupying the site of Sc3+, the polyhedron distorted severely and the structure of crystal is unstable (substitutional energy 1.19 eV/W, the positive value implies that the substitution is endothermal).The unit cell parameters of the crystal are as follows:a=13.22 ˚A,b=9.61 ˚A,c=9.96 ˚A.It no longer maintains the orthorhombic structure(α=91◦,β=93◦,γ=89◦).With two W6+occupying the sites of Sc3+, the structure of crystal is more stable than the former case(substitutional energy 0.85 eV/W).The unit cell parameters of the crystal are as follows:a=13.56 ˚A,b=9.66 ˚A,c=9.79 ˚A.The orthorhombic structure is still maintained. Compared to the unit cell parameters of the undoped sample (a=13.66 ˚A,b=9.72 ˚A,c=9.83 ˚A), the volume of the doped crystal shrinks lightly.Figures 5(a)–5(c) give the schematic diagrams of Sc2W3O12crystal and the crystals with different Sc3+occupied by W6+.These calculation results further demonstrate the reliability of the structure of the doped sample.

Fig.5. (a)Schematic diagram of the Sc2W3O12 crystal. (b)Schematic diagram with one W occupying Sc site in the unit cell of Sc2W3O12.(c)Schematic diagram with two W occupying Sc sites in the unit cell of Sc2W3O12. O atoms are shown in red balls,ScO6 octahedra in purple,WO6 octahedrain in brown and WO4 tetrahedra in gray.
4. Conclusions
In summary,we have investigated the effects of W6+occupying the sites of Sc3+in the unit cell of Sc2W3O12by employing experiment and first-principles calculations. The structure of the doped sample (Sc6W2)W12O48±δis similar to that of orthorhombic Sc2W3O12but with three unequivalent W in the sites of the crystal lattice, two of which occupy the positions similar to Sc2W3O12,and the other one occupies the remaining positions of Sc and thus formed WO6octahedra. It also exhibits an intrinsic NTE property (linear CTE,−1.51×10⁻⁶K−1) within the measured temperature range (150 K–650 K). Compared to the Raman spectrum of Sc2W3O12, the stretching modes and bending modes of the doped samples shift toward the higher wave numbers,indicating that the W–O bonds in the doped sample become harder(stronger). In addition,the increase of the FWHMs means the broadening of Raman linewidths in the spectrum of the doped sample. The distortion of crystal and stress in crystal,induced by W6+occupying Sc3+, are account for these changes. Results of first-principles calculations show that the crystal with even W6+occupying even Sc3+in the unit cell is stable while the structure with odd W6+occupying odd Sc3+in the unit cell is unstable due to the unit cell is severely distorted. It further proves the reliability of the structure of the doped sample.
- Chinese Physics B的其它文章
- Quantum computation and simulation with vibrational modes of trapped ions
- ℋ∞state estimation for Markov jump neural networks with transition probabilities subject to the persistent dwell-time switching rule∗
- Effect of symmetrical frequency chirp on pair production∗
- Entanglement properties of GHZ and W superposition state and its decayed states∗
- Lie transformation on shortcut to adiabaticity in parametric driving quantum systems∗
- Controlled quantum teleportation of an unknown single-qutrit state in noisy channels with memory∗

