
Prediction of the load-carrying capacity of reinforced concrete connections under post-earthquake fire
2021-06-24 13:44AydinSHISHEGARANMehdiMORADIMohammadAliNAGHSHBehnamKARAMIArshiaSHISHEGARAN
Aydin SHISHEGARAN,Mehdi MORADI,Mohammad Ali NAGHSH,Behnam KARAMI,Arshia SHISHEGARAN
1School of Civil Engineering,Iran University of Science and Technology,Tehran,Iran
2Institute of Structural Mechanics,Bauhaus-Universität Weimar,Weimar 99423,Germany
3School of Civil Engineering,Isfahan University,Isfahan,Iran
4School of Civil Engineering,Isfahan University of Technology,Isfahan,Iran
5International Institute of Earthquake Engineering and Seismology,Tehran,Iran
Abstract:Finding out the most effective parameters relating to the resistance of reinforced concrete connections (RCCs) is an important topic in structural engineering.In this study,first,a finite element (FE) model is developed for simulating the performance of RCCs under post-earthquake fire (PEF).Then surrogate models,including multiple linear regression (MLR),multiple natural logarithm (Ln) equation regression (MLnER),gene expression programming (GEP),and an ensemble model,are used to predict the remaining load-carrying capacity of an RCC under PEF.The statistical parameters,error terms,and a novel statistical table are used to evaluate and compare the accuracy of each surrogate model.According to the results,the ratio of the longitudinal reinforcement bars of the column (RLC) has a significant effect on the resistance of an RCC under PEF.Increasing the value of this parameter from 1% to 8% can increase the residual load-carrying capacity of an RCC under PEF by 492.2% when the RCC is exposed to fire at a temperature of 1000 °C.Moreover,based on the results,the ensemble model can predict the residual load-carrying capacity with suitable accuracy.A safety factor of 1.55 should be applied to the results obtained from the ensemble model.
Key words:Reinforced concrete connection (RCC);Post-earthquake fire (PEF);Surrogate models;Load-carrying capacity;Gene expression programming (GEP);Ensemble model
1 Introduction
Based on historical records,the risk of a post-earthquake fire (PEF) can be greater than that of a single earthquake.The fires following the 1906 San Francisco and 1923 Tokyo earthquakes are known as the most destructive fires of the 20th century.In the San Francisco disaster,over 3000 people were killed,and more than 28 000 buildings were destroyed at an estimated cost of 250 million dollars.The 1923 Tokyo earthquake and fire caused even more damage:about 575 000 buildings were destroyed,and over 140 000 people killed (Scawthorn et al.,2005).
Based on previous studies of the PEF performance of structures,several researchers evaluated the possibility of a fire occurring after an earthquake based on its intensity (D’Orazio et al.,2014).They demonstrated that there is a relationship between the probability of ignition and several parameters,such as peak ground acceleration (PGA),possibility of structural collapse,and ground tension (Himoto and Tanaka,2008;Khorasani et al.,2017).Scawthorn (2010) showed that there is a strong relationship between seismic intensity and the possibility of ignition (Scawthorn,2010).
It is clear that the mechanical strengths of steel and concrete are reduced because of the increase in temperature (Wen et al.,2016).Several researchers focused on the fire resistance of reinforced concrete (RC) elements.Kodur et al.(2010) evaluated the thermal properties of concrete and steel.They showed that the thermal parameters of an RC element,such as the expansion coefficient,mass density,and specific heat capacity,change at various temperatures.They also demonstrated that the mechanical strengths of steel and concrete are reduced at elevated temperatures (Kodur et al.,2010;Kodur and Khaliq,2011).
Based on the results of systematic studies on steel and concrete members,design methods for improving the performance of concrete and steel frame under fire have been presented (Elghazouli et al.,2009;McConnell and Brown,2011;Kumar et al.,2013).Several researchers focused on the fire resistance of concrete-filled steel connections and hollow columns (Han et al.,2007;Heidarpour and Bradford,2011).They evaluated the effect of design parameters on the fire resistance of concrete-filled steel tubular columns and joints (Han et al.,2007).Several studies focused on the evaluation of damage to RC elements exposed to fire (Bratina et al.,2007;Kodur et al.,2008;Wu and Xu,2009;Gao et al.,2013).The fire resistance of a building is related to the time from the start of a fire to when the structure collapses under the applied standard static and live loads.The fire-resistance rating (FRR) is a term that classifies the fire resistance of primary and secondary building elements (Kodur and Dwaikat,2007).The results of previous studies show that the fire resistance of structural members subjected to a seismic load is lower than those of undamaged structural elements (Mostafaei et al.,2010;Sharma et al.,2012).The fire resistance of RC members is related to the fire resistance of concrete and reinforcement bars (Cai et al.,2018).The thermal conductivity of concrete is low,and its heat transmission to the core of the cross-section is low.In contrast,a reinforcement bar has high thermal conductivity (He et al.,2016;Mohebbi et al.,2017).A concrete cover plays an important role in insulating the reinforcement bars against fire because of its slow heat transmission.It is clear that a crack in concrete has a significant effect on the fire resistance of RC elements (Mohebbi et al.,2017).Several studies focused on the PEF resistance of concrete structures.They evaluated the fire resistance of damaged and undamaged RC structures to demonstrate the heat penetration into the damaged RC elements (Ronagh and Behnam,2012;Behnam and Ronagh,2013b;He et al.,2016;Mohebbi et al.,2017).Kong (2011) presented an equation to determine the temperature penetration depth for the cracked concrete.Shi et al.(2004) evaluated the effect of a concrete cover on the fire resistance of RC flexural members.The thermal conductivity of an RC element reduces when crack width increases (Vejmelková et al.,2008).Minor tensile cracks do not have a significant effect on temperature propagation inside a section.In addition,the fire resistance of lightly damaged and undamaged members is the same (Ervine et al.,2012).Several previous studies illustrated that the crack width,compressive strength of concrete,deflection,and the change in the elastic modulus play important roles in fire resistance (Mostafaei and Kabeyasawa,2007;Vejmelková et al.,2008;Ervine et al.,2012).Miao et al.(2013) evaluated the performance of seven RC beams with various crack widths under fire and proposed a numerical model to predict the performance of RC beams.Wu et al.(2014) evaluated the effect of heat conduction on the cracked concrete members.In their study,nine cracked concrete specimens and one ordinary concrete specimen were exposed to fire to evaluate the effect of cracks on temperature distribution in concrete elements.They found that cracks with a length of no more than 3 mm do not have a significant effect on temperature distribution (Wu et al.,2014).
Most previous studies focused on the PEF resistance of structural elements.Della Corte et al.(2003) evaluated the PEF resistance of a steel moment frame (SMF) using numerical models.Pucinotti et al.(2011) evaluated the PEF resistance of steel beam-to-column joints experimentally.Bursi et al.(2011) evaluated the PEF performance of four steel-concrete composite beam-column joints.They showed that the resistance and performance of precast connections are better than those of composite joints.Behnam et al.(2016) evaluated the PEF resistance of two kinds of reinforced concrete connections (RCCs).The RCCs had the same configuration,concrete strength,amount of steel bars,and geometry,but one was retrofitted with carbon fibre reinforced polymer (CFRP).The PEF resistance of the CFRP-strengthened RCC was more than that of the ordinary RCC.Kamath et al.(2015) evaluated the PEF resistance of a full-scale RC frame.Sixty minutes after ignition,they observed a loss of 44% in the lateral load-carrying capacity at a displacement of 30 mm,and 10% at the peak displacement of the cyclic loading step.
Beam-to-column connections are one of the most critical parts of an RC frame in both an earthquake and a fire following an earthquake (FFE).During an earthquake,the maximum values of bending moments and shear forces occur together at the beam-to-column connection (Guo,2014),which may cause significant damage to the structure.As a result,the performance of RCCs under seismic loading has attracted much attention.Kim and LaFave (2007) used a database of 341 RC beam-to-column connections to investigate the shear stress and strain behavior of RCCs under lateral cyclic loading.They found that the compressive strength of concrete had the most influential effect on joint shear behavior.Birss (1978) evaluated the effect of longitudinal reinforcements of a column on the load-carrying capacity and earthquake resistance of RCCs.They showed that longitudinal reinforcements play an important role in the performance of RCCs.For example,increasing the percentage of longitudinal reinforcements from 2% to 4% can improve the load-carrying capacity of RCCs by up to about 15%.Furthermore,the percentage of transverse reinforcements of connection components can significantly affect the behavior of RCCs under lateral cyclic loads (Pampanin et al.,2002).The results showed that changes in several parameters,such as the ratio of longitudinal bars and the transverse bars of the column and beam of an RCC,the bonded index of column bars,and the ratio of beam depth to column depth,have a significant effect on the ductility and load-carrying capacity of RCCs.Therefore,it is important to specify the effect of these parameters on the PEF resistance of RCCs.
The finite element method (FEM) is a useful tool to carry out the parametric studies (Shishegaran et al.,2019).It is a low-cost and accurate method for solving structural problems,but is complex.Visible regression models are useful tools to predict the performance of structural elements because engineers can use them easily (Shishegaran et al.,2020a).Several studies have focused on regression models,such as multiple linear regression (MLR),to predict the performance of beam-to-column connections (Islam and Alam,2013;Shishegaran et al.,2017,2018).Multiple natural logarithm (Ln) equation regression (MLnER) has been used to predict the performance of an RC panel under an explosive load.Gene expression programming (GEP) is a stronger model for predicting the performance of structural elements,because it not only removes inappropriate parameters,but also uses a genetic algorithm to find the best mathematical function or combination of functions to predict the output (Shishegaran et al.,2020a,2020b).
Most previous studies focused on steel connections (Pakala et al.,2012),steel frames (Khorasani et al.,2015b;Gernay et al.,2019),steel elements (Khorasani et al.,2015a),or steel-concrete connections.Only a few focused on the PEF performance of RCCs (Wen et al.,2016).Several studies evaluated the fire resistance of damaged RC elements,like the RC beam,RC column,and steel-concrete composite beam-to-column joints (Bursi et al.,2011;Miao et al.,2013;Wu et al.,2014;Wen et al.,2016).For example,Bursi et al.(2011) and Wen et al.(2016) evaluated the effect of geometric damage and the various types of spalling at the end of the seismic loads on the PEF resistance of steel-concrete composite beam-to-column joints and RC columns,respectively.According to the effect of PEF on the damage of RC structures and for making a more comprehensive study of the fire performance of concrete structures after an earthquake,the effect of many design factors and combination of them,such as the compressive strength of concrete,the ratio of reinforcement bars of a column and beam,the ratio of beam depth to column depth,the bonded index of column bars,and the percentage of connection transverse shear bars,on the PEF resistance of the RCC is determined in this study.To investigate the effect of different parameters on the remaining load-carrying capacity of the RCCs,132 RCCs were simulated and analyzed using FEM.Four prediction models,MLR,MLnER,GEP,and an ensemble model which is a combination of MLR,MLnER,and GEP,were used for the first time to predict the remaining load-carrying capacity of RCCs.Various statistical parameters and error terms,including the coefficient of determination,root mean square error (RMSE),normalized mean square error (NMSE),fractional bias,maximum and negative relative errors,and mean absolute percentage error (MAPE),are employed to compare the accuracy and reliability of the mentioned prediction models.
2 Methodology
The two main aims of this study were to perform a parametric study of an RCC under PEF and evaluate different models for predicting its residual load-carrying capacity.In the first part of the study,nine parameters,including the beam depth,compressive strength of the concrete,percentages of beam and column longitudinal reinforcements,percentage of joint transverse reinforcement,column depth,column reinforcement bond index,axial load of the column,and temperature,were varied among 132 samples.Then the remaining load-carrying capacities of the samples were calculated using nonlinear finite element (FE) analysis.Based on the FE results,the effect of each parameter on the load-carrying capacity of the RCC was determined.
In the second part,four prediction models were derived for predicting the performance of the RCC under PEF.Seventy percent of the samples chosen at random were used to train the prediction models,and then the remaining samples were used to verify the formulas obtained.The accuracy of the models was compared using different statistical parameters and error terms.The prediction results were assigned to six categories:‘very good’,‘good’,‘acceptable’,‘unacceptable’,‘bad’,and ‘worst’.Based on this approach,the best model was selected as the one which had the highest proportion of errors distributed in the ‘very good’ and ‘good’ categories.Absolute errors of more than 25% were identified,and the reasons for their existence explained and justified (Shishegaran et al.,2020b).Finally,a safety factor was obtained,which should be applied to the prediction results to increase the reliability of the best model.The steps of the study are illustrated in a flowchart (Fig.1).
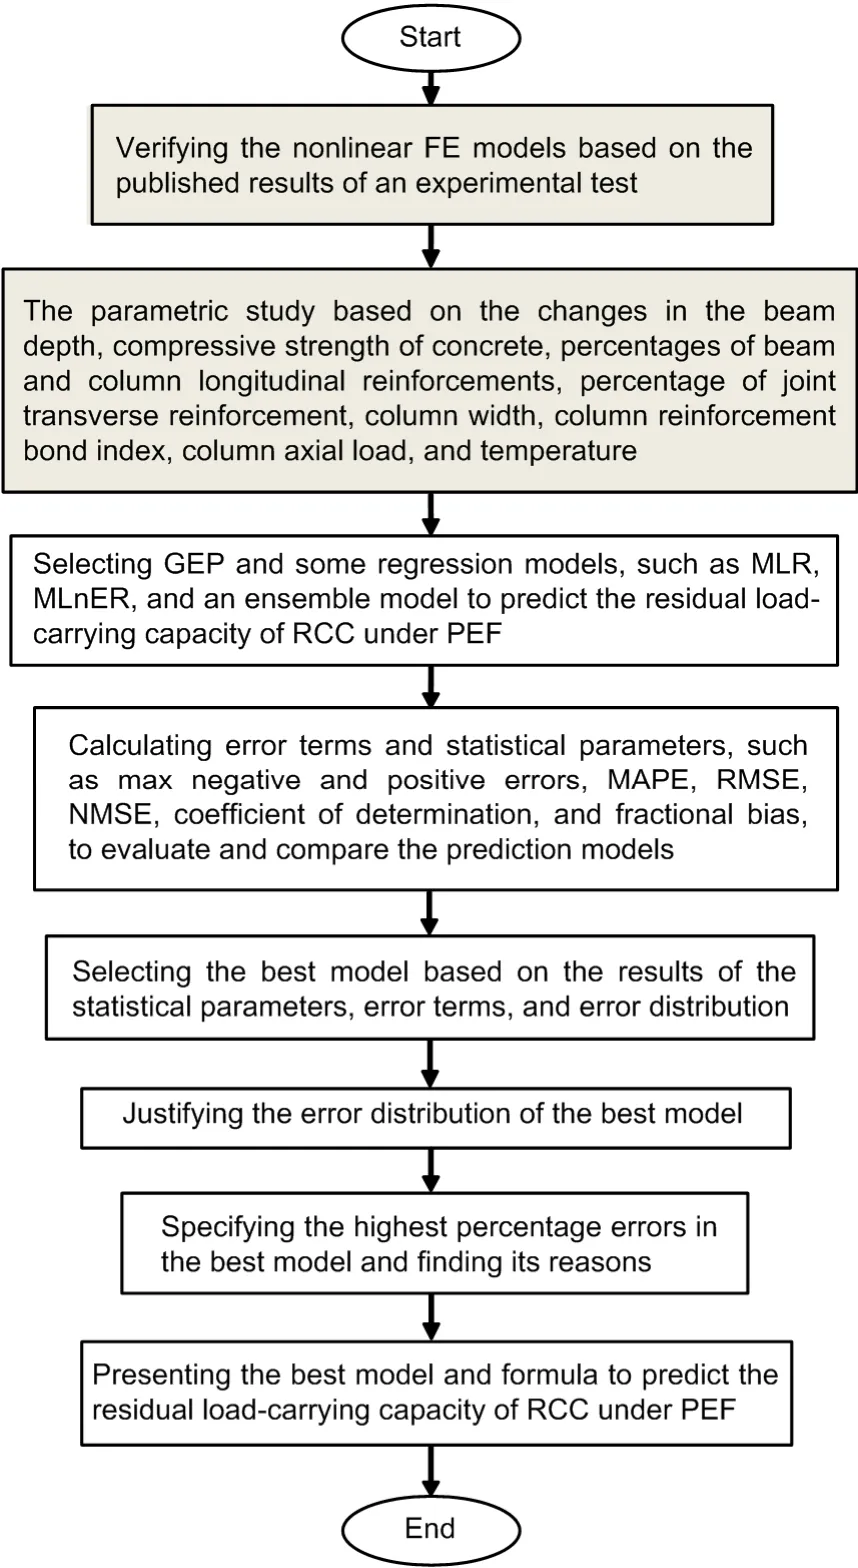
Fig.1 A flowchart showing the steps of this study
3 FE model under PEF
ABAQUS FEA software was used for numerical analysis of RCCs under PEF.To analyze the RCCs under fire conditions,C3D8T (a full integration 3D temperature-displacement continuum element with 8 nodes of thermally coupled brick) and T3D2T (a 3D coupled temperature-displacement truss element with 2 nodes,linear displacement,and linear temperature) were used to mesh concrete and steel bars,respectively.Embedded region constraint was used to define the interaction between the concrete and bars.The loads and fire were applied in four steps as follows:
1.In the first step,an axial load was applied to the top surface of the column,and maintained to the end of the analysis.
2.The loading sequence (Fig.2a) presented in FEMA 461 (ATC,2007) was used for cyclic loading in the second step.The cyclic loading was applied to the top end of the column in a displacement-controlled manner.
3.In the third step,the temperature of the RCC was increased based on the ISO 834-1 heating curve (ISO,1999) (Fig.2b).
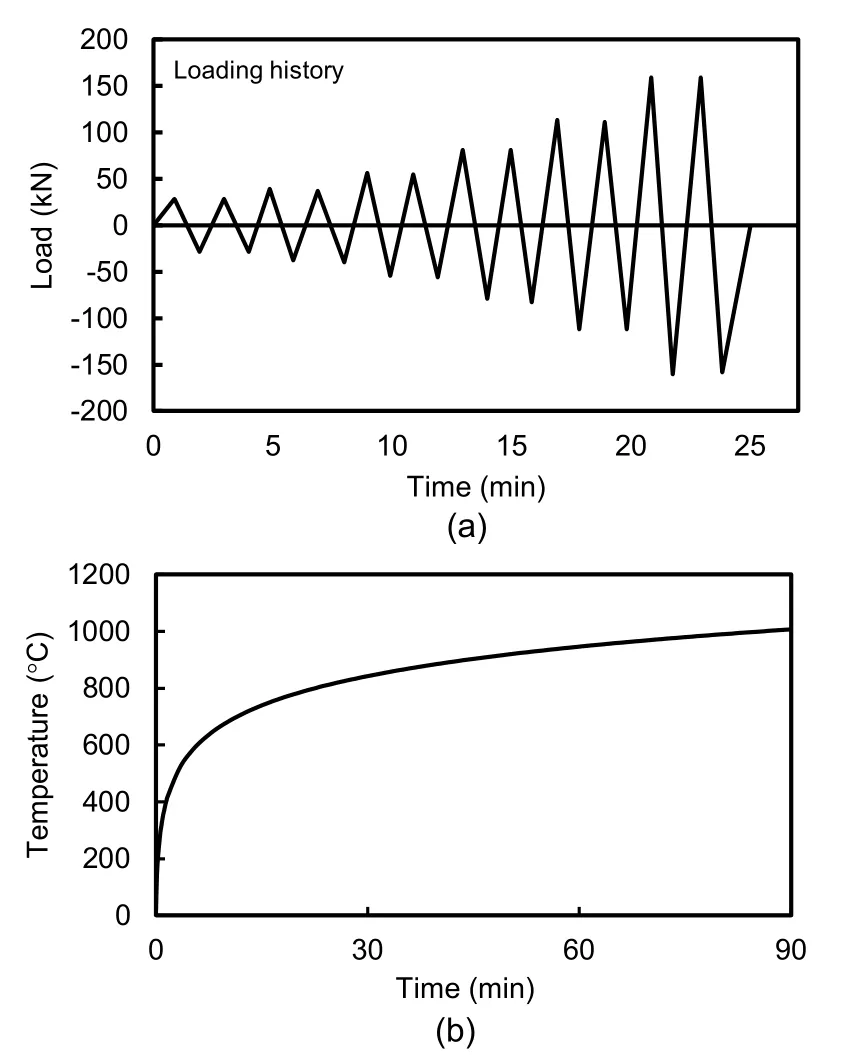
Fig.2 Loads applied to the RCCs
4.In the last step,a monotonic pushover loading was applied to the top end of the column to specify the residual capacity of the connection after the previous steps.
The bottom end of the column was assumed to be pinned,and was simulated by restraining the center of the bottom end of the column against translations in thex,y,andzdirections.The center of the top of the column was restrained only in the lateralxdirection (Fig.3).The beam’s ends were restrained in both the lateralxand verticalydirections.
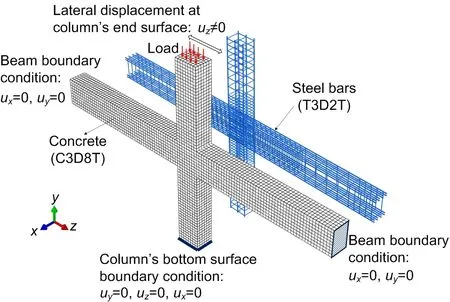
Fig.3 Details of the RCC model used in this study,including geometric properties,considered boundary conditions based on the experimental setup,finite element meshing,and considered boundary conditions in FEA (DS,2010) (u is the deflection in boundary condition)
The thermal reaction of elements against fire is fundamentally a transient heat transfer process,in which the heat of the fire is transmitted to the outer surface of the heated elements by radiation and convection,which is then followed by conduction into the internal surfaces of the corresponding parts.The values of the heat convective coefficient (hv),emissivity of fire (ef),and emissivity of the concrete and steel surface (em) were considered as 25 W/(m2·K),0.8,and 0.7,respectively,for the composite elements,based on Eurocode 2 and Eurocode 3 (CEN,2001,2004).These values were used for simulating the specimens in this study.The boundary conditions were specified as prescribed temperatures based on the ISO 834-1 heating curve (ISO,1999) because the fire was applied to the external surface of the samples.Because of some limitations of the ABAQUS FEA software and the complexity of modeling composite structures under fire,to simulate the most realistic condition of fire loading and simplify some less effective factors,the following assumptions were made in this study (Behnam and Ronagh,2013a;Guo,2014;Wen et al.,2016):
1.The initial temperature of the specimens was defined as 20 °C in a predefined field.
2.The temperature distribution was uniform all over the beam to the column joint components at each elevated temperature of the ISO 834-1 fire curve.
3.The bond-slip between the concrete and reinforcement bars was not considered.
4.The contribution of reinforcement bars was not addressed for the thermal field,and the spalling in concrete elements was ignored.
3.1 Material properties of steel reinforcements under fire
In this study,the EN 1993-1-2 design code (CEN,2001) with the von Mises yield criterion was used to simulate the stress-strain characteristics of the steel rebars at elevated temperatures.Based on EN 1993-1-2,at temperatures higher than 400 °C,strain hardening is insignificant.Therefore,in this study the values in Fig.4a were used to model the behavior of steel at temperatures below 400 °C,and the values in Fig.4b were used to simulate the behavior of steel at temperatures higher than 400 °C.The mechanical properties of steel,including the slope of the linear elastic range,yield strength,and proportional limit,are degraded significantly at high temperatures.The effect of temperature was considered by defining a series of stress-strain relationships for increasing temperature ranges based on the reduction factors,as presented in EN 1993-1-2 (CEN,2001).Fig.4b represents the reduction factors for the stress-strain relationship of steel bars with respect to temperature in which the elastic modulus factor,the effective yield strength factor,and the proportional limit factor are considered asET/E,fy,T/fy,andfp,T/fy,respectively.Eis the slope of the linear elastic range,andfyis the effective yield strength of bars at room temperature.
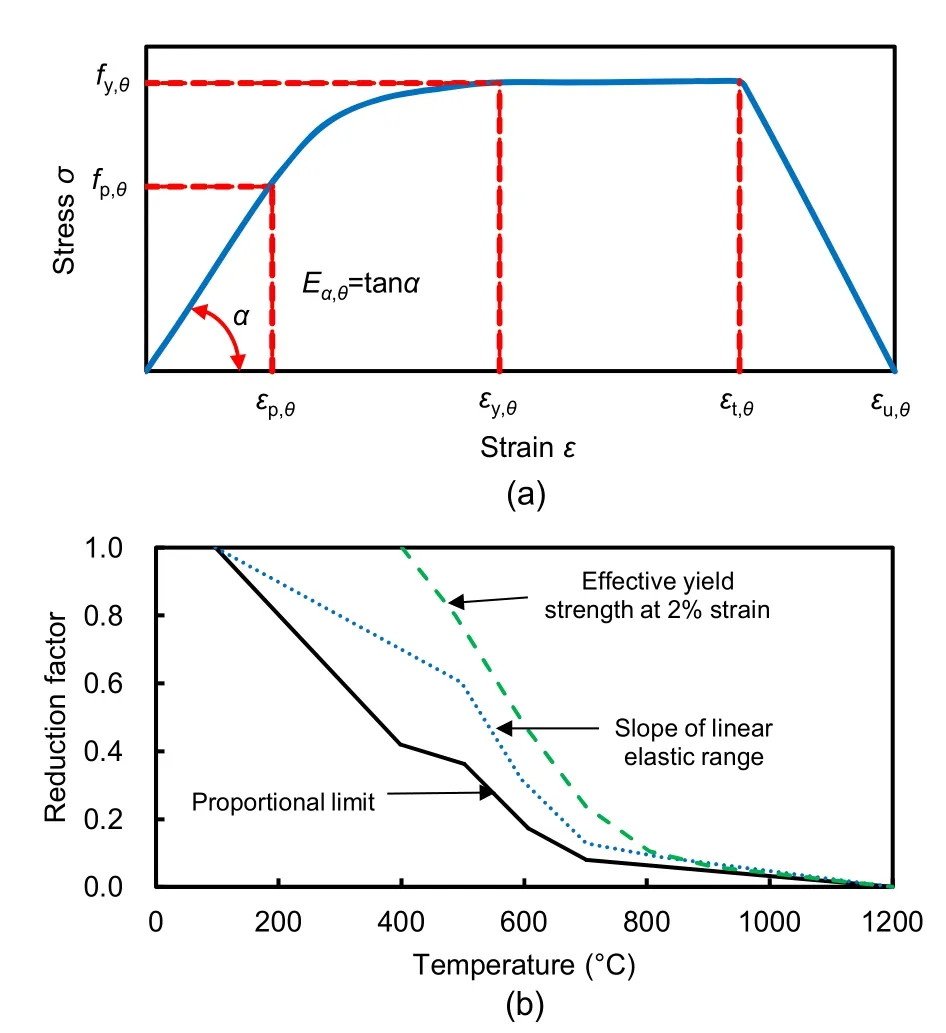
Fig.4 Mechanical properties of steel rebar under fire conditions
According to EN 1993-1-2 (CEN,2001),the value of the ultimate strength of steel (fu) depends on the applied temperature (T).Eq.(1),which is used in this study,is presented in this standard as follows:
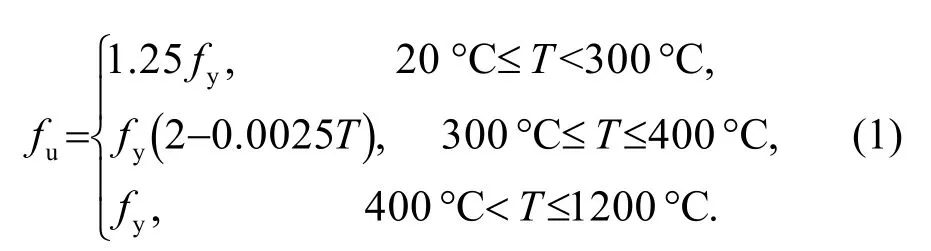
Variation in the thermal properties of steel bars,including the thermal expansion coefficient,specific heat capacity,and thermal conductivity at elevated temperatures,was considered based on EN 1993-1-3 (Fig.5) (CEN,2001).
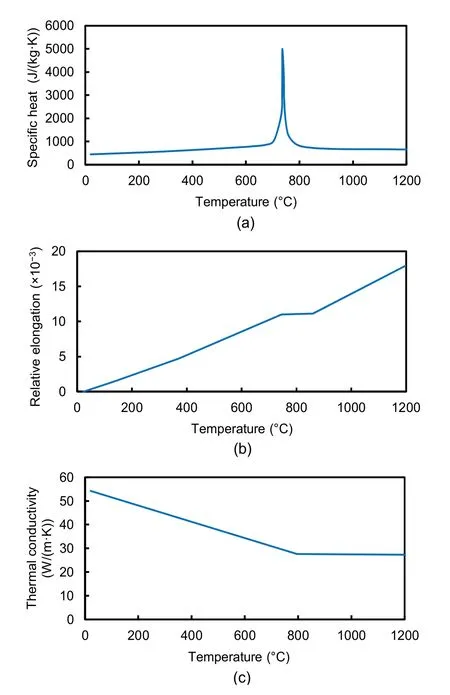
Fig.5 Thermal properties of steel bar under fire condition
The properties of S400 and S340 steels were used to simulate the longitudinal reinforcement and shear reinforcement bars,respectively,in all samples.Their mechanical and thermal properties at ambient temperature are listed in Table 1 (Shishegaran et al.,2020a).
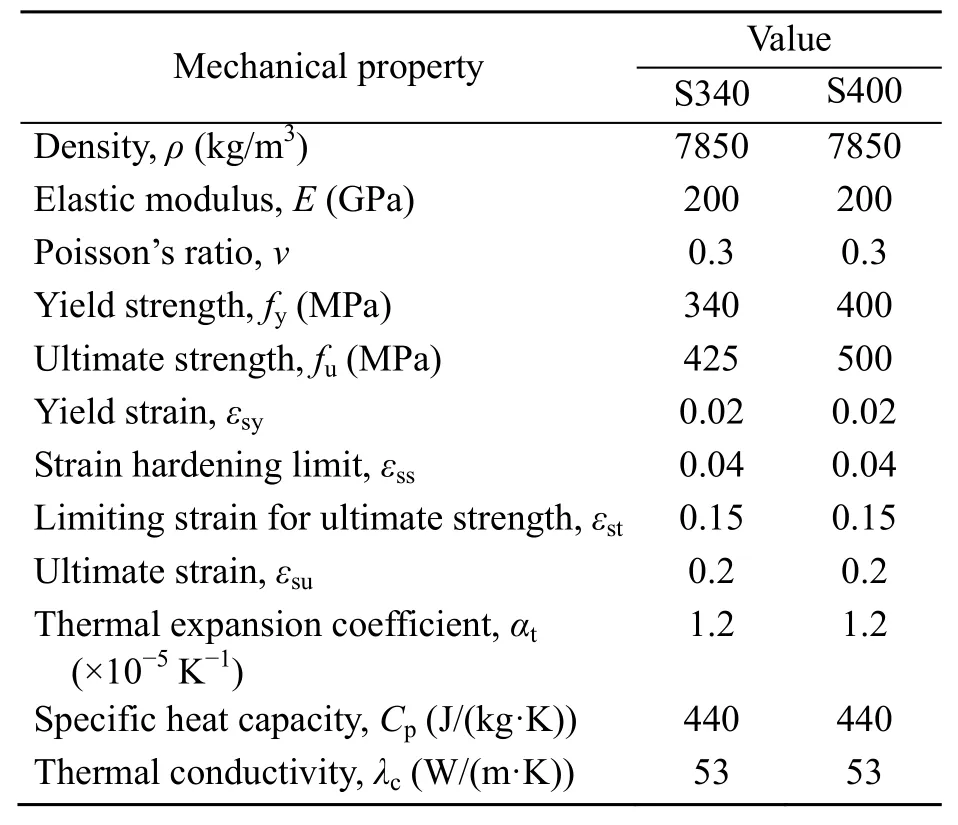
Table 1 Mechanical and thermal properties of S340 and S400 steel bars at room temperature (Shishegaran et al.,2020a)
3.1.1 Material properties of concrete under fire
EN1993-1-2 (CEN,2004) was used to simulate the behavior of concrete under fire in the FE nonlinear models.Concrete is a non-homogeneous,anisotropic medium composed of aggregate,cement paste,and water.For simplicity,it can be treated as a homogeneous isotropic material in heat transfer analysis (Shishegaran et al.,2020a).
The mechanical and thermal properties of concrete at ambient temperature are shown in Table 2.The thermal expansion coefficient,specific heat capacity,and thermal conductivity of concrete at elevated temperatures,available in Eurocode 2 (CEN,2004),were used in this study (Fig.6).
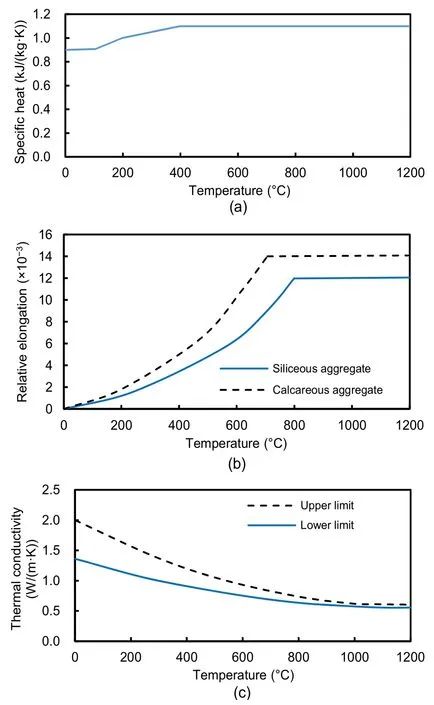
Fig.6 Thermal behavior of concrete under fire
Concrete damaged plasticity (CDP) can be used to simulate the behavior of concrete after a crack because of applying the elastoplastic and plastic behavior of concrete (Lubliner et al.,1989).CDP was used to simulate the nonlinear behavior of concrete in this study and several previous studies (Rabczuk et al.,2008;Oucif et al.,2018;Thai et al.,2020).The CDP input parameters used in this study are shown in Table 3.The CDP model considers two prominent failure mechanisms of concrete:compressive crushing and tensile cracking.Figs.7a–7c illustrate the behavior of concrete based on the CDP model under uniaxial compression and tension,and cyclic loading,respectively.
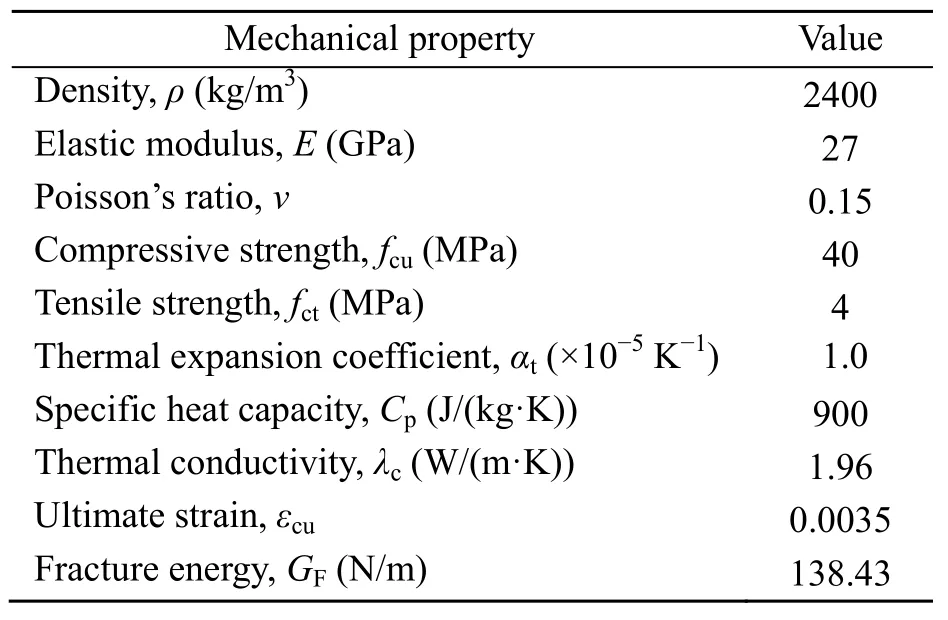
Table 2 Mechanical and thermal behaviors of concrete (C40) at ambient temperature (CEN,2004)
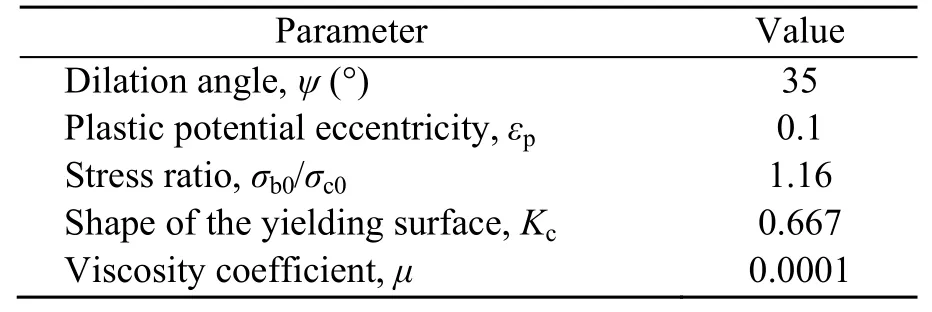
Table 3 Values considered for CDP input parameters in all samples
Degradation in concrete behavior occurs as a result of tensile and compressive damages.This degradation was applied to the model by using tensile and compressive damage variables in the CDP model that can perform degradation in elastic stiffness (DS,2010).
Thermal spalling of concrete under fire conditions is a significant point that needs to be considered.It appears instantly and may lead to a considerable reduction in the load-bearing capacity of the structure (Rabczuk,2013).Thermal spalling has a prominent effect on structural members that have more than 4– 5 cm of cover or in members made of high-strength concrete (Su et al.,2010).In this study,thermal spalling was not considered for simulating the specimens because the RCCs were made of normal-strength concrete with a cover of 4.5 or 3 cm.
3.1.2 Fracture energy of concrete under fire
The stress-strain curve is“scaled”such that accurate energy dissipation at post localization is guaranteed,which ultimately provides mesh-independent results because a plastic-damage model,such as the CDP model,causes in an ill-posed boundary value problem and is associated with mesh dependency (Pavlović et al.,2013).This needs an extra material parameter,the fracture energy of concrete (GF) (CEB-FIP,1993;Rabczuk and Belytschko,2006;Su et al.,2010;Markovič et al.,2012;Pavlović et al.,2013;Rabczuk,2013).This parameter can be obtained experimentally (Su et al.,2010).However,in the absence of experimental data,Su et al.(2010) presented an estimation ofGFas
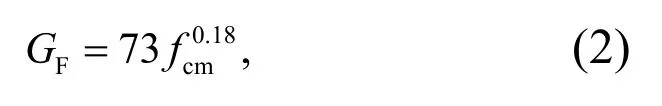
wherefcmis the mean compressive strength.The scaling for a linear softening to avoid mesh dependency follows the simple relationship (CEB-FIP,1993;Markovič et al.,2012):
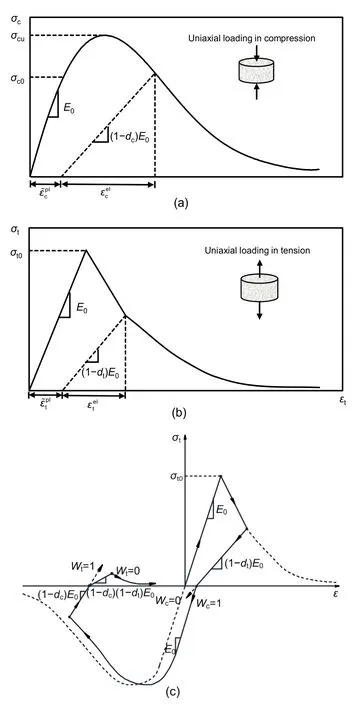
Fig.7 Behavior of the concrete under uniaxial loading in compression (a),tension (b),and cyclic loading (c) (DS,2010).Subscripts c and t represent compression and tension,respectively;ε~pl is the plastic stain when the load is removed;εel is the elastic strain after reloading;(1−d) is the slope of stress and strain curve of concrete when the load after plastic behavior of concrete is removed;W is the stayed strain after plastic behavior of concrete and after removing load;E0 is the elastic module
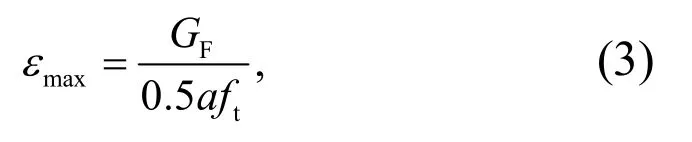
whereaandftare the characteristic size of a finite element and the maximum tensile stress,respectively.The values ofεcu1,θandεc1,θat elevated temperatures,defined as the ultimate compressive strain and compressive strain at the peak point,respectively,were considered based on Eurocode 2 (CEN,2004).
To define the compressive stress-strain curve of concrete (C40) at elevated temperature,Eq.(4) is presented for the nonlinear branch based on the EN 1992-1-2 (CEN,2004).
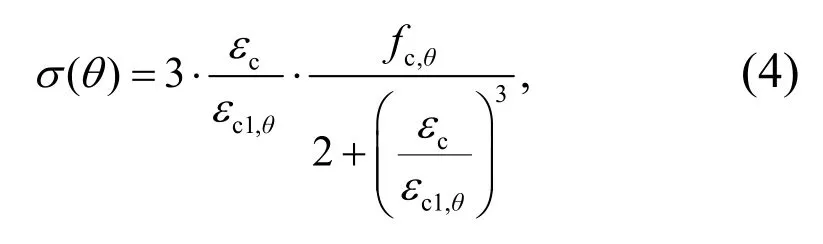
whereσ(θ) andεcare the compressive stress and strain,respectively,of concrete at temperatureθ.fc,θis the stress at the peak point.
To avoid convergence problems,the linear descending branch was selected (Fig.8).
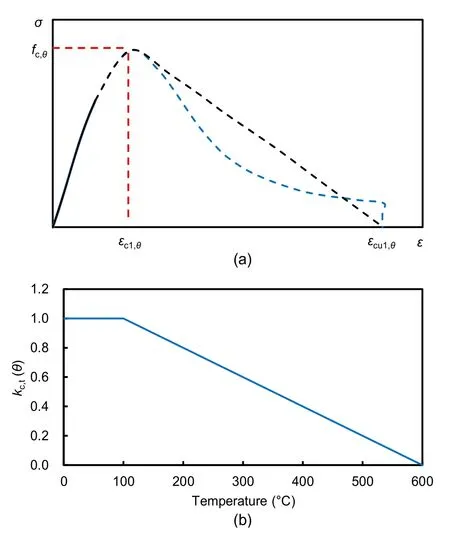
Fig.8 Behavior of concrete under fire
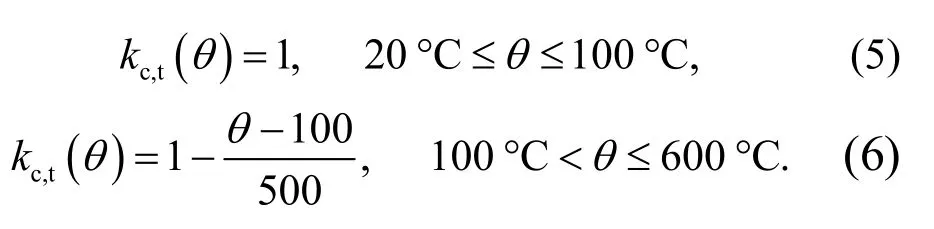
At high temperatures,the tensile strength of concrete decreases significantly as temperature increases.Reduction factors (kc,t(θ)) for the tensile strength at elevated temperatures were adopted from (CEN,2004):
3.2 Validation
Validation of the FE model was achieved by comparison with two experimental results.First,the performance of a single-story reinforced concrete frame (RCF) under PEF was simulated by the proposed FE model.In Section 3.2.1,the FE results are compared with the experimental results of Kamath et al.(2015).Then,to evaluate the validity of the FE model for simulating RCC and the influence of the material parameters and geometry on the FE model,the results of the FE model are compared with the experimental results of Behnam et al.(2016) presented in Section 3.2.2.
3.2.1 Verifying the FE model for developing models
To evaluate the validity of the FE model,the FE results were compared with experimental data generated by Kamath et al.(2015).In their study,a single-story RCF with a strong floor was modeled.The same geometry,boundary condition,material properties,and applied loads were considered for simulating with the FE model.Figs.9a and 9b show the geometric dimensions of the frame components which consisted of four 300-mm square columns at 3000-mm centers in the N-S and E-W directions.There were four beams with widths and depths of 230 mm.The thickness of the RC roof slab was considered as 120 mm.Hydraulic jacks were used to apply lateral displacements to the RC slab (Fig.9a).All the columns terminated in a thick RC raft foundation (Fig.9b).The results obtained from the FE model were compared in terms of the hysteresis curve and temperature variation in the depth of the beams at five locations.
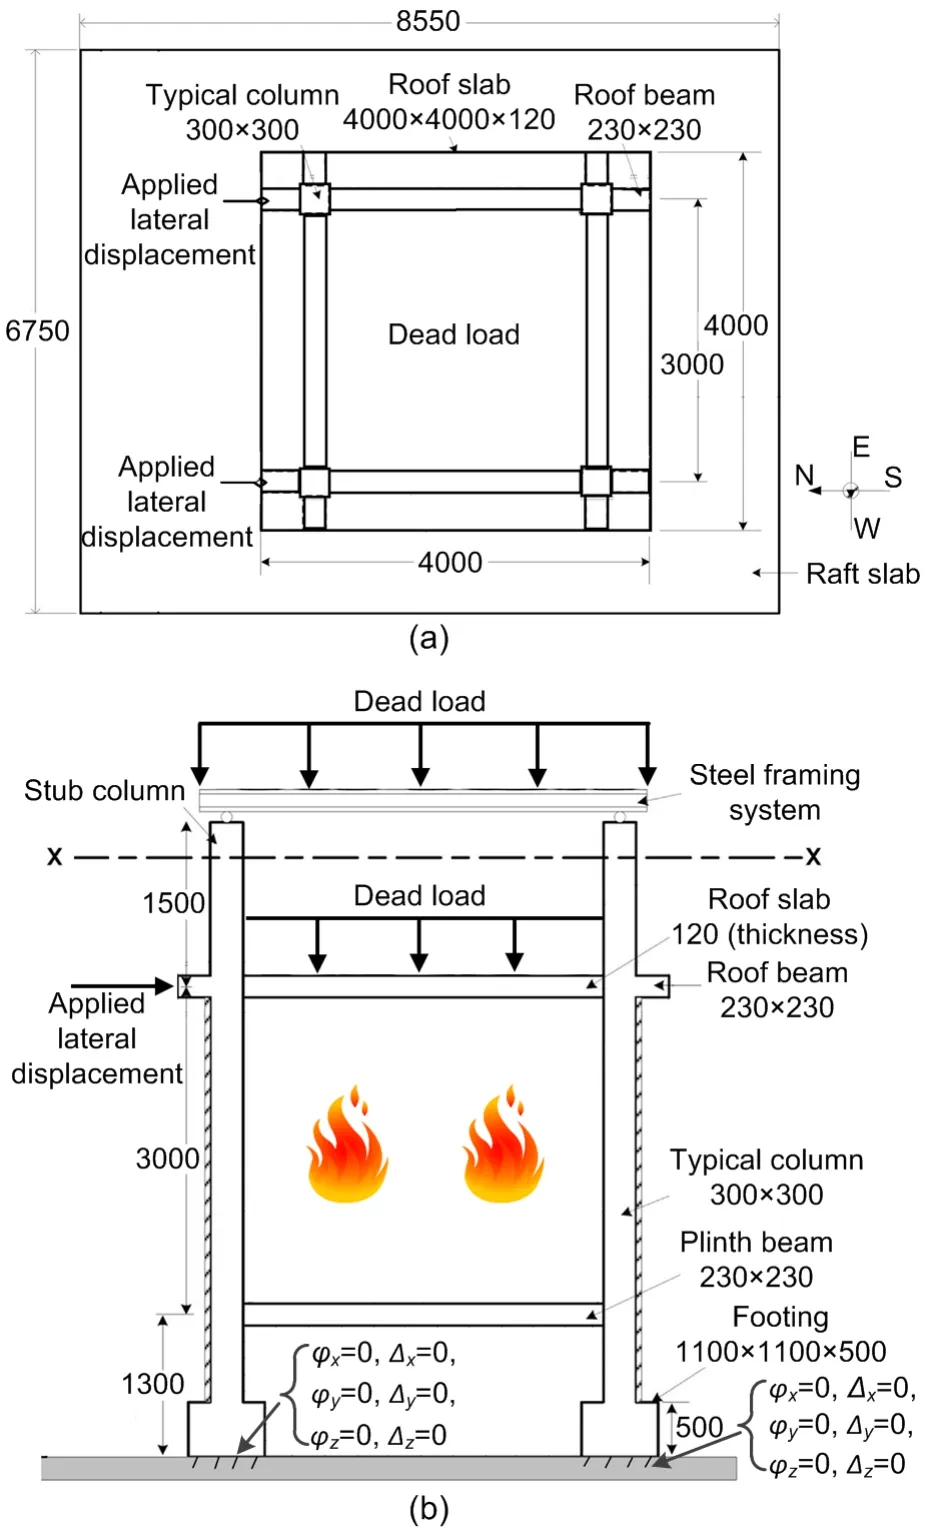
Fig.9 Geometry and considered boundary conditions
The mechanical properties of the steel reinforcement bar and the concrete,and geometries of RCF components,were considered as the reported data in the study of Kamath et al.(2015).Four steps were considered to analyze the FE models.First,a total gravity load of 400 kN was applied to the frame,which included a full complement of the dead load and 25% of the live load.In the second step,the frame was subjected to cyclic lateral loading at the roof slab level in a quasi-static manner.The cyclic loading was applied in a load-controlled mode (Fig.10a) to induce the lateral displacements corresponding to ASCE (2000).In the third step,the RC frame was exposed to fire.Fig.10b shows the applied temperature-time curve in the study of Kamath et al.(2015).
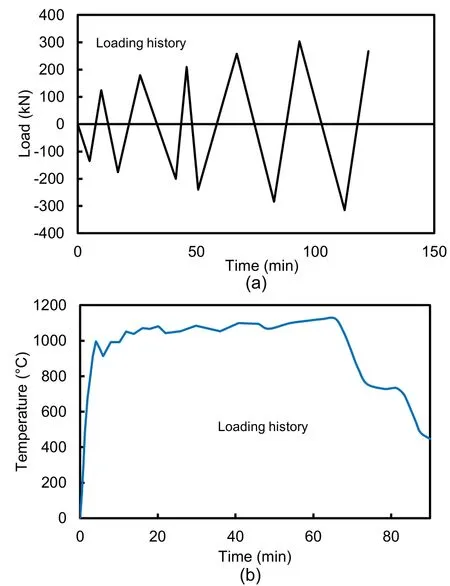
Fig.10 Applied lateral load and temperature
To determine the residual capacity of the frame and its strength and stiffness degradation during the previous steps,in the fourth step,the frame was subjected to a monotonic pushover loading,which causes displacements beyond the maximum displacement in the second step.In the third step,a coupled temperature-displacement analysis was performed in ABAQUS/standard,in which displacements and temperatures were simultaneously solved,while in all other steps,the analysis was set to static general.Geometric nonlinearity was also taken into account by using the NLGEOM command to consider the effect of large deformations on the analysis.The embedded region constraint was used to define the interaction between the concrete and the steel bars.The concrete components of the RC frame and steel reinforcement bars were meshed using C3D8T and T3D2T elements,respectively.
First,a mesh size sensitivity analysis was performed to determine the best size of the mesh to provide acceptable accuracy.Four FE models with different mesh sizes were proposed,including RCF#1,RCF#2,RCF#3,and RCF#4,in which the mesh sizes were considered as 100,70,50,and 30 mm,respectively.The load-deflection results of the above-mentioned models were compared to the experimental results (Fig.11).
According to the results (Fig.11),the mesh sizes used in models RCF#3 and RCF#4 show the same results in the load-deflection curves,which were in good agreement with experimental results.Therefore,the mesh size of 50 mm was considered as the validated FE nonlinear model,and was used to simulate all models presented in the parametric study.
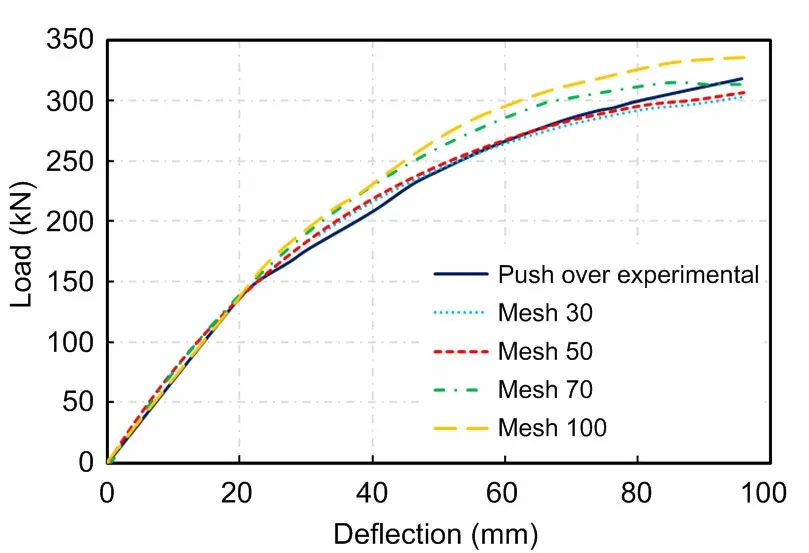
Fig.11 Comparison of the load-deflection curves from the models with different mesh sizes and from experimental results (Kamath et al.,2015)
Fig.12 shows the hysteresis curves of the RC frame under lateral cyclic loading that were obtained from the FE model and the experimental test.The FE analysis results provided a suitable prediction for the behavior of the RC frame under seismic loading.In the experimental study,the maximum displacements in the push and pull cycles were obtained as 95 mm and 85 mm,respectively.The FE model gave the maximum displacements as 99 mm and 89 mm for push and pull cycles with relative errors of 4.21% and 4.70%,respectively.The results of base shear variation versus roof slab displacement are shown in Fig.12b for both the FE nonlinear model and experimental test (Kamath et al.,2015).The FE results show no degradation in the lateral strength of the RCF and are in good agreement with experimental results.
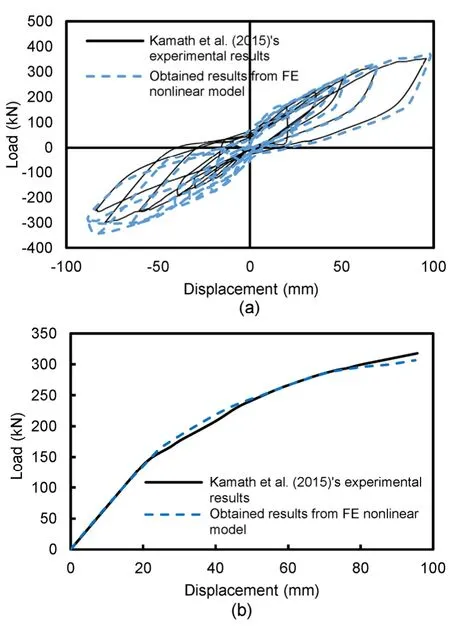
Fig.12 Comparison of load-displacement results
Figs.13a and 13b show the crack patterns of the RC frame due to cyclic loading in the FE nonlinear analysis and the experiment,respectively.It is clear that the crack patterns obtained from FE nonlinear analysis are close to those from the experimental results reported by Kamath et al.(2015).
Fig.14a shows the variation of temperature with respect to beam depth after 20,40,and 60 min of fire exposure.The FE results are in acceptable agreement with experimental results,although the error of the FE nonlinear model was increased after 40 min from the ignition.No reduction factors were reported by Kamath et al.(2015) for the mechanical and thermal properties of concrete and steel bars at elevated temperatures.Therefore,the reduction factors used in this study were extracted from Eurocode 2 and Eurocode 3 (CEN,2001,2004).According to the results,slight differences were obtained between the experimental and FE results at high temperatures.Therefore,the reduction factors proposed by Eurocode are acceptable to simulate the behavior of concrete and steel bars at elevated temperatures.Fig.14b shows the residual capacity of the frame obtained from the FE model and the experimental test.The experimental results represented reductions of 44% and 10% in the lateral load resisting capacity at a displacement of 30 mm and peak displacement of the cyclic loading step,which was measured as 96 mm,respectively.Based on the FE results,the resistance against the lateral load was reduced to 46% and 13% at the displacements of 30 mm and 96 mm,respectively,which indicates the significant accuracy of the FE nonlinear model.
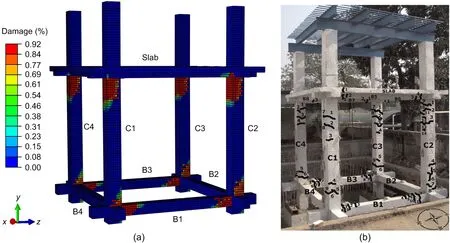
Fig.13 Crack patterns due to cyclic loading
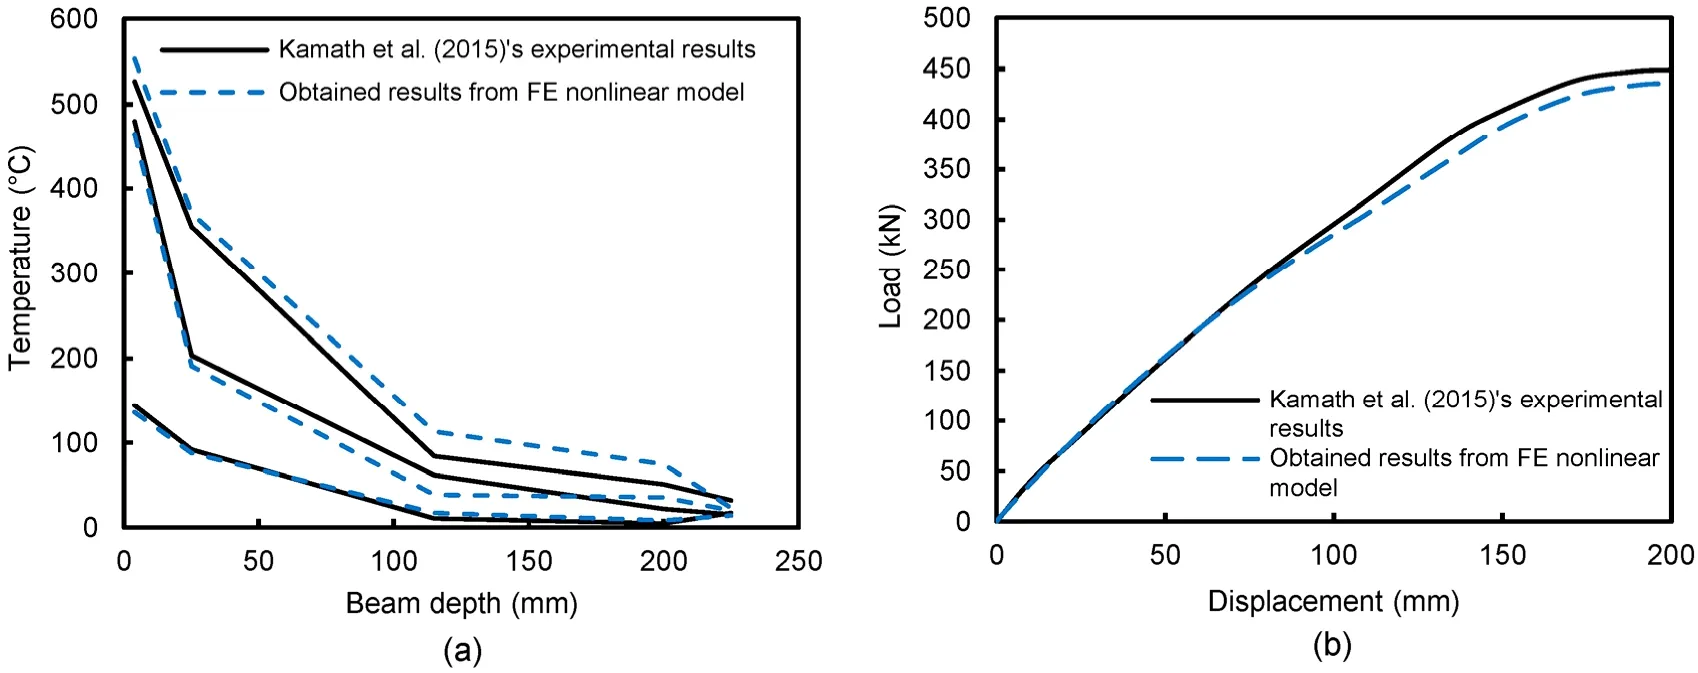
Fig.14 Comparison of the FE model and experimental test results
3.2.2 Validation of the FE model for RCC and various material properties
In this subsection,the FE simulation was validated by the experimental results of Behnam et al.(2016).The values of all dimensions of RCC,material properties of steel bars and concrete,and the applied loads were considered the same as those presented for the specimen in the study of Behnam et al.(2016).Two steps were considered to analyze the FE models.First,the RCC was subjected to cyclic lateral loading at the tip of the beam.The cyclic loading was applied in a displacement-controlled mode to induce lateral displacements corresponding to ASCE (2000).In the second step,using a coupled temperature-displacement analysis,the RCC was exposed to fire based on the data of Behnam et al.(2016).To find the best mesh size,a mesh size sensitivity analysis was conducted to obtain acceptable results.Based on the results,in this subsection as in the previous subsection,the mesh size was considered as 50 mm.
Fig.15 shows the envelope curves of the RCC specimen under lateral cyclic loading that were obtained from the FE model and experimental test.The FE results provided a suitable prediction for the behavior of the RCC under seismic loading.
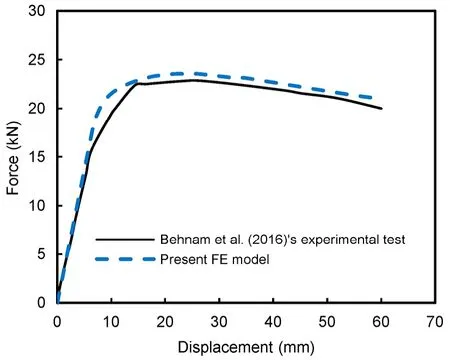
Fig.15 Comparison of envelope curves from the FE model and the experimental test results of Behnam et al.(2016)
The fire resistance of the RCC before and after applying the cyclic loading according to different performance levels is illustrated in Fig.16.There were only slight differences between Behnam et al.(2016)’s results and the FE results;thus,the proposed FE model is acceptable to simulate RCC.Whereas the fire resistance of the undamaged specimen was about 50 min (Fig.16a),it was reduced to about 30 min at the life safety (LS) performance level (Fig.16b),and to 12 min at the collapse prevention (CP) performance level (Fig.16c).The results show a significant reduction in resistance compared to the undamaged specimen (Fig.16a).This considerable reduction was due to degradation in the strength and stiffness of the materials in the fire condition.
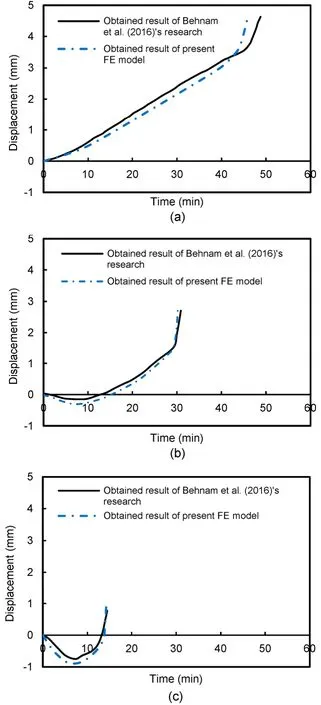
Fig.16 Comparison of the FE model with the experimental test results of Behnam et al.(2016)
Fig.17 shows the temperature distribution of the inside section of the beam-to-column joint for different damage performance levels obtained from the results of the various cyclic loads.It is obvious that the heat transmission inside the damaged section at the LS performance level (Fig.17b) and CP performance level (Fig.17c) was much quicker than that inside the undamaged section (Fig.17a).
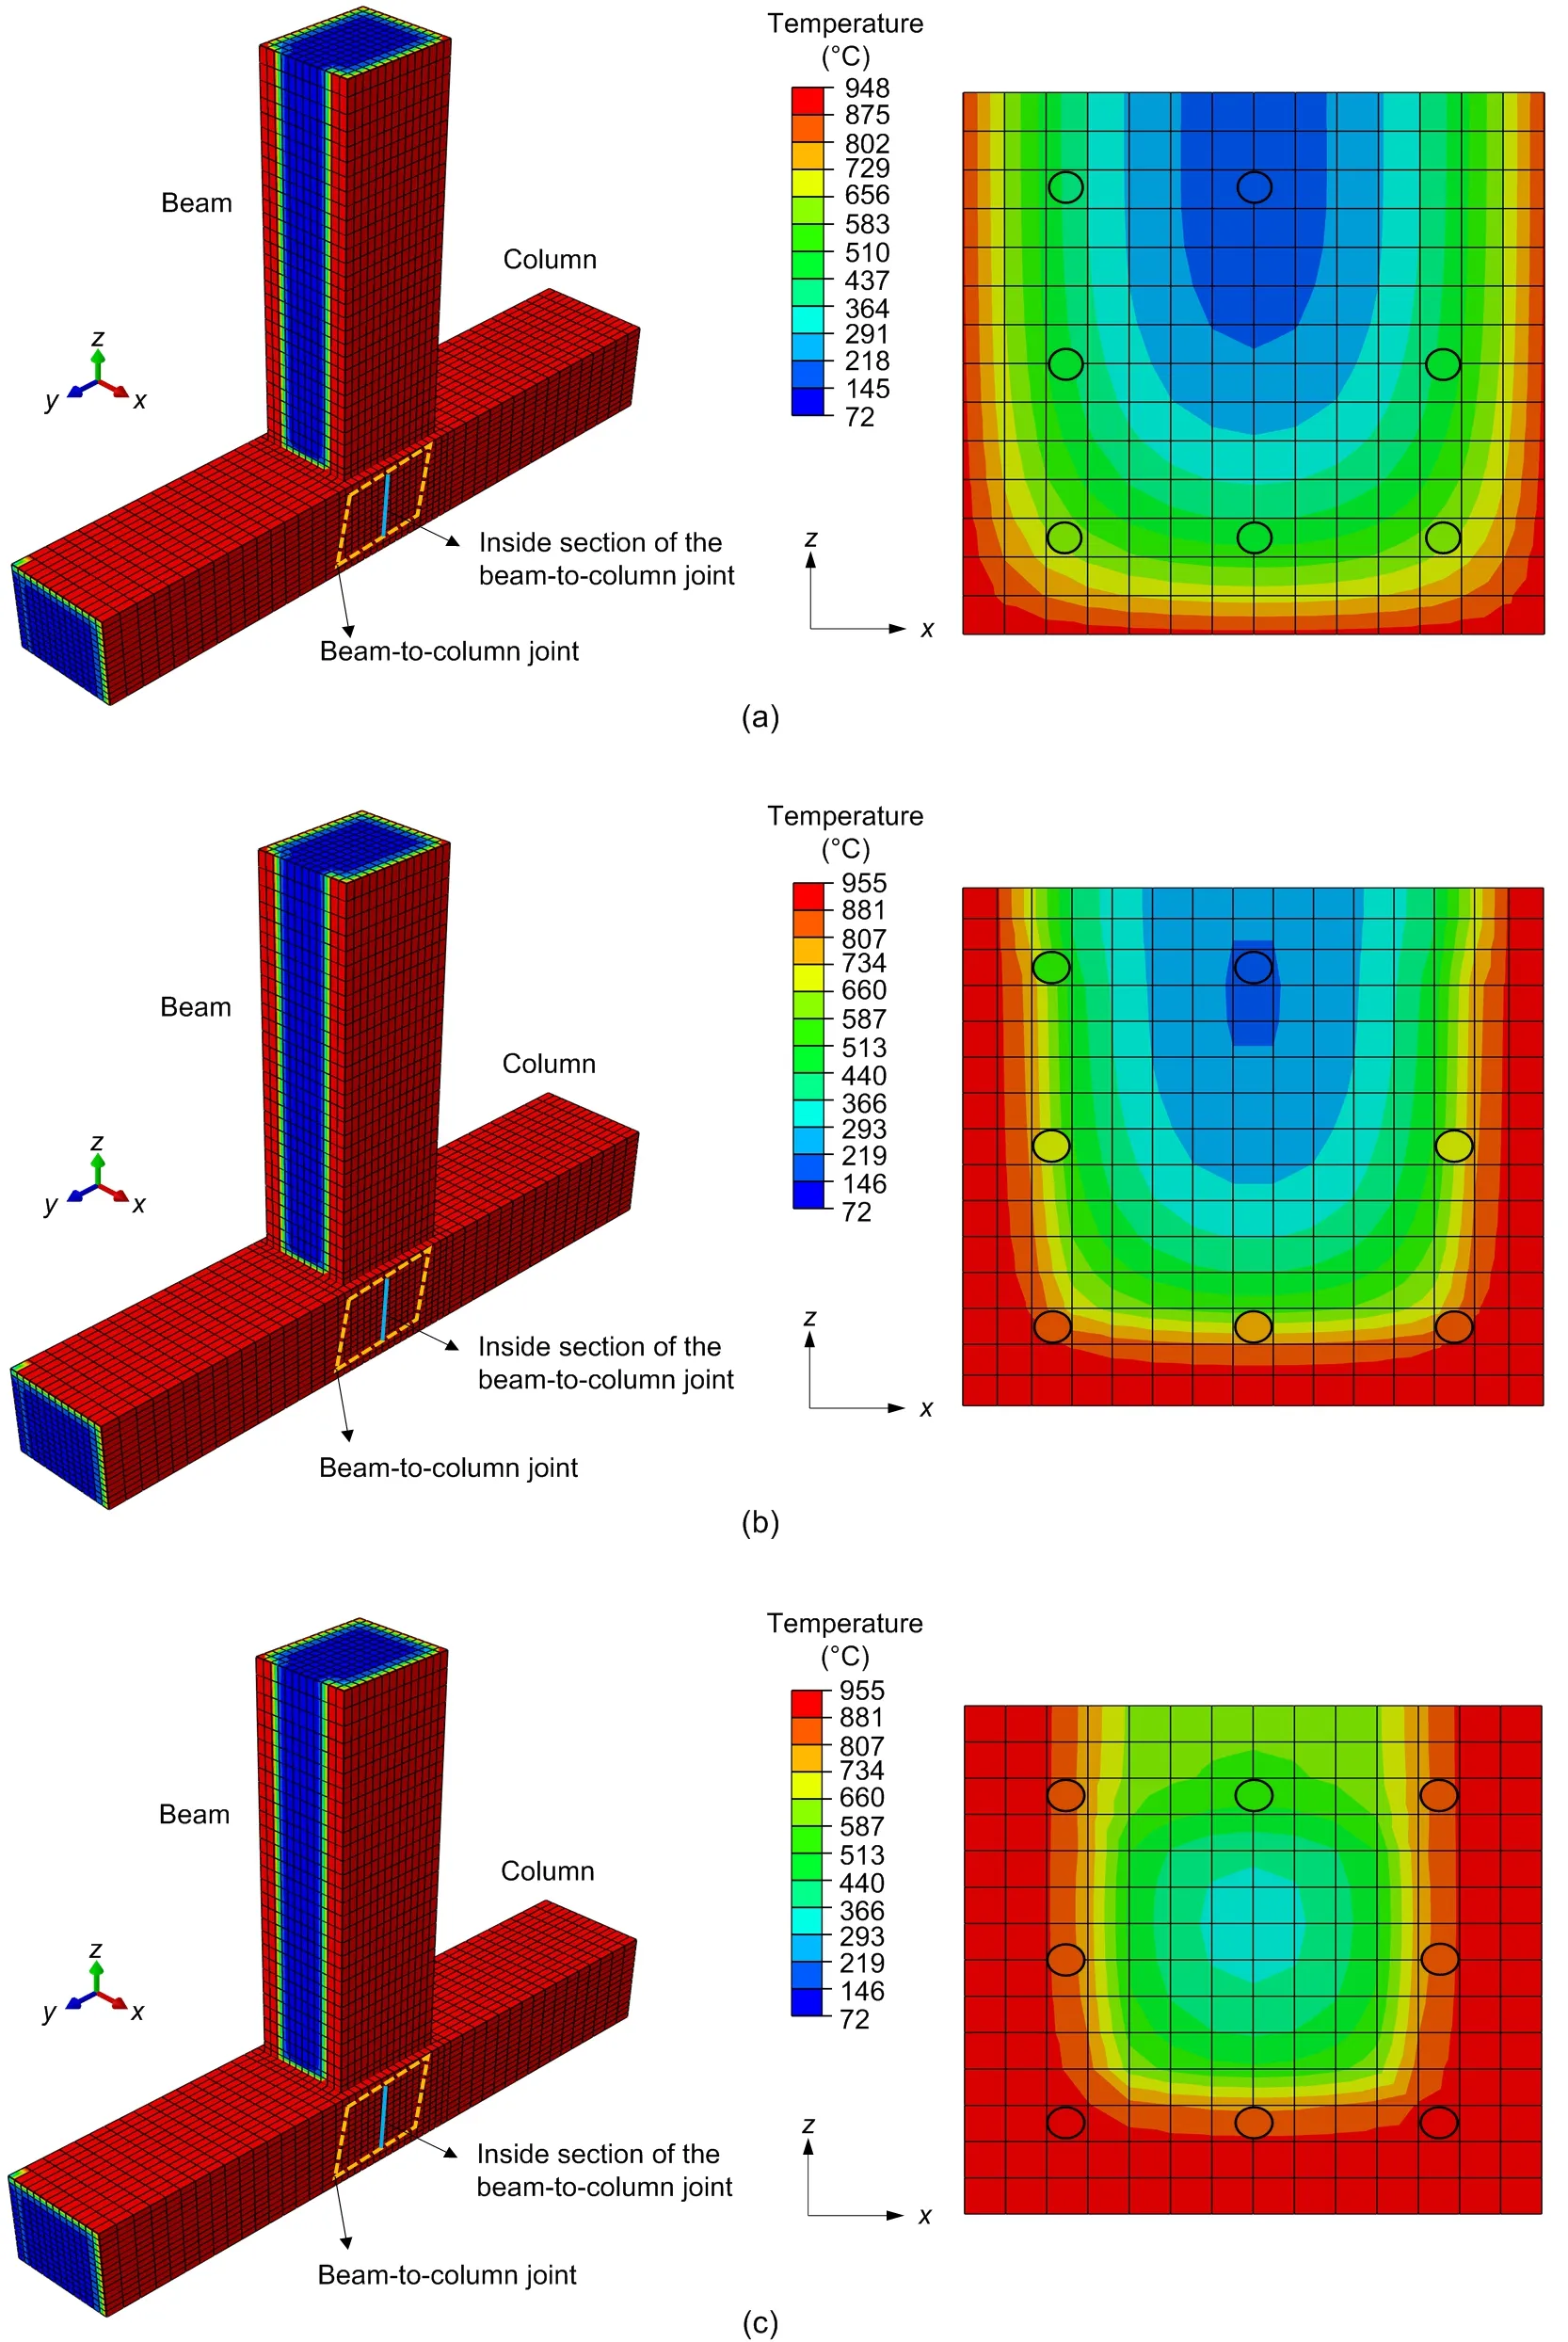
Fig.17 Temperature distribution at the beam-to-column joint
3.3 Parametric study
Fig.18 (p.455) shows the shape and geometry of the RCC in this study.A constant value was considered for several parameters,including the beam length,column length,column height,beam width,column width,tie spacing,and percentage of transverse reinforcements of the column and beam.
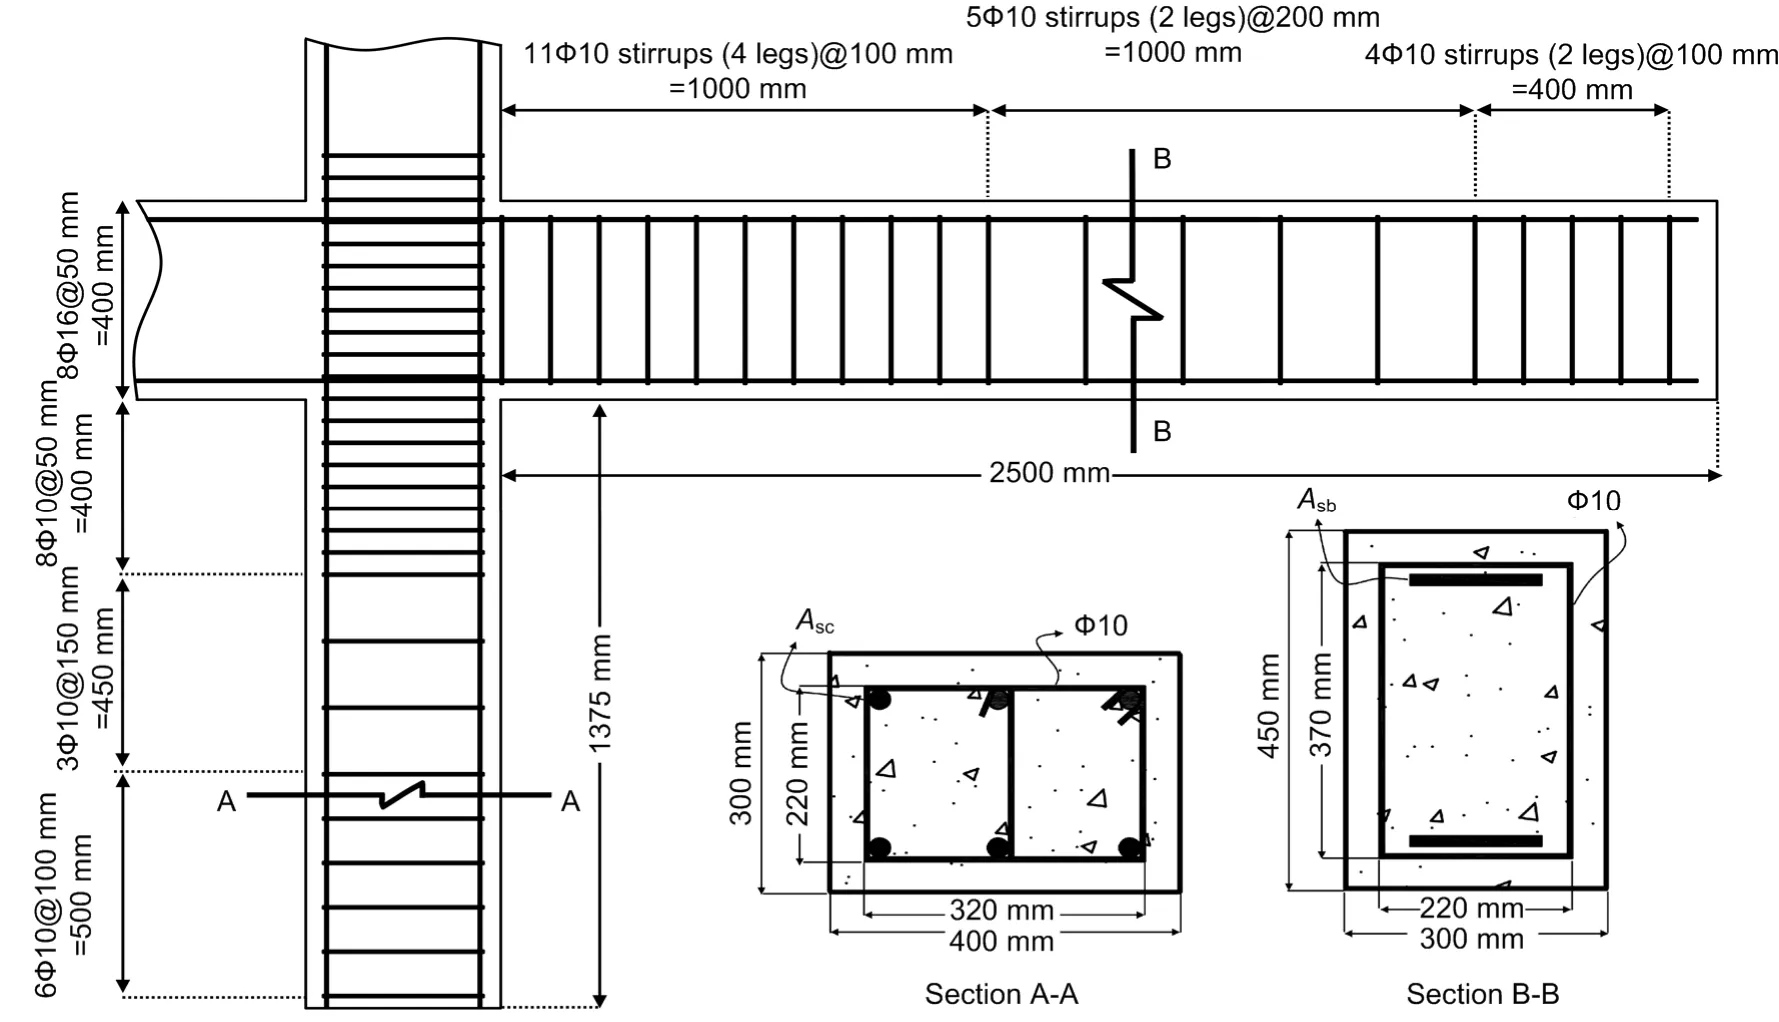
Fig.18 Geometry of constant parameters in the RCC (Asc and Asb are the areas of bars in column and beam,respectively)
Fig.19 (p.456) demonstrates the variation of each variable in the samples used in this study.It is clear that temperature was regularly changed in all datasets.Only the ratio of the compressive load to the compressive strength of the column (RCLS) was changed in FE nonlinear models 1–28.The compressive strength of concrete was changed in models 29–48,and the ratio of the longitudinal bars of the column (RLC) was changed in models 49–68.The percentage of connection transverse shear bars (PCTS) was changed in models 69–96.In the FE nonlinear models 97–116,the values of two variables,PCTS and the ratio of beam depth to column depth (RBCD),were changed.Finally,the values of four variables,including the RCLS,compressive strength,the ratio of longitudinal bars in the column and beam (RCB),and the bonded index of column bars (BIC),were changed in models 117–132.
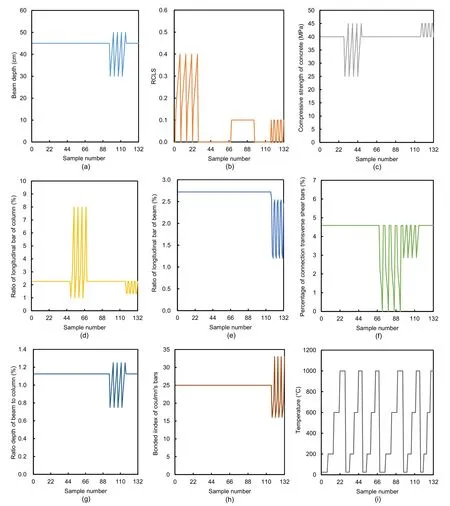
Fig.19 Values of each input variable
Note that all the changes in the reinforcements of the column and beam satisfied the requirements of ACI 318-14 (ACI,2014).Table 4 shows the correlation coefficient between each variable and output separately.According to the results of this table,the applied temperature had the most effect on the load-carrying capacity.The depth of the beam and the RBCD had a slight effect on the load-carrying capacity.
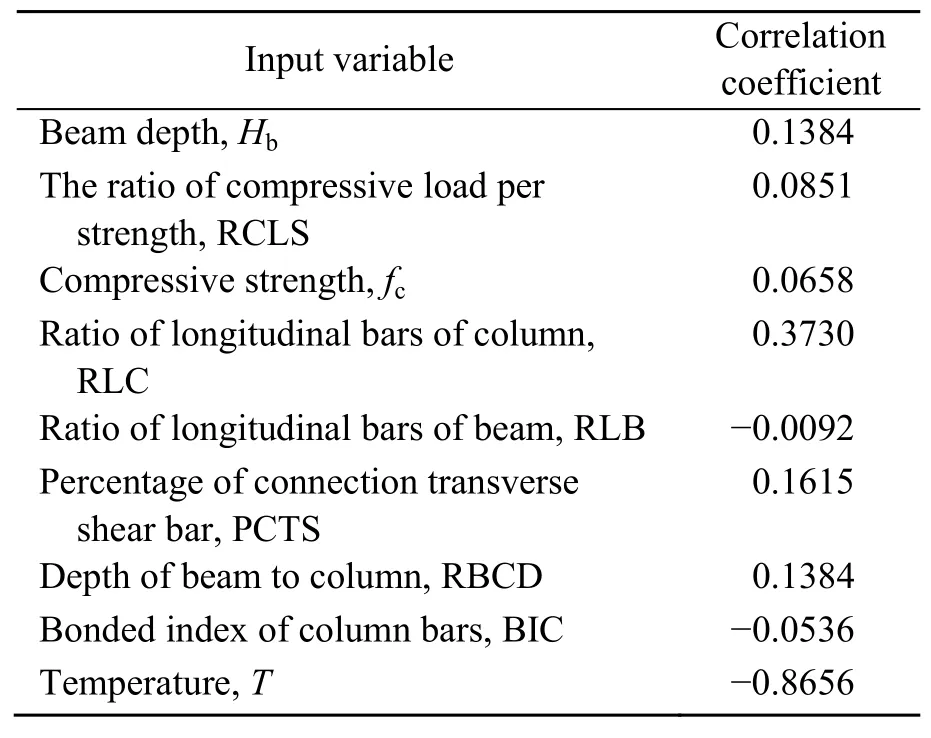
Table 4 Correlation coefficients between input variables and outputs
Fig.20a (p.457) shows the effects of the RCLS and temperature on the load-carrying capacity of the RCC,extracted from the results of models 1–28.The effect of temperature was slight at temperatures of 25 °C and 200 °C,but increased strongly at temperatures of 600 °C and 1000 °C.Based on the results,the load-carrying capacity of the RCC was reduced by about 40% and 76% at temperatures of 600 °C and 1000 °C,respectively.The effect of the RCLS was notconsiderable,but by increasing the RCLS,the load-carrying capacity of the RCC was increased.
The effects of compressive strength and temperature on the load-carrying capacity in samples 29–48 were evaluated (Fig.20b).Although increasing the compressive strength of concrete increased the load-carrying capacity of the RCC,temperature played a more important role.For example,the load-carrying capacity of the RCC was reduced by about 45.5% and 88.3% when the temperature of the RCC under fire increased from 25 °C to 600 °C and 1000 °C,respectively.
Fig.20c demonstrates the effects of the RLC and temperature on the remaining load-carrying capacity of the RCC under PEF.The ratio of longitudinal bars of the column affected the load-carrying capacity of the RCC,which increased by 234.8%,217.3%,296.8%,and 492.9% when the RLC increased from 1% to 8% at 25,200,600,and 1000 °C,respectively.According to these results,the RLC was the most effective parameter for improving the PEF resistance of the RCC,although the load-carrying capacity reduced strongly at temperatures of 600 °C and 1000 °C.In contrast,based on the results of Fig.20d,the PCTS had only a slight effect on the load-carrying capacity.Temperature,especially at 600 °C and 1000 °C,played an important role in the load-carrying capacity of the RCC in relation to PCTS.
Fig.20 Effect of different variables on the load-carrying capacity of the RCC
The effect of the combination of the PCTS and the RBCD on the load-carrying capacity of the RCC was evaluated (Fig.20e).The combination of these parameters had a slight effect on the load-carrying capacity of the RCC.Based on the results,increasing both these parameters can effectively improve the load-carrying capacity of an RCC under fire.However,increasing the PCTS and the RBCD,unlike increasing the RLC,cannot increase the fire resistance.On the other hand,their effect is not as drastic as increasing the RLC.Increasing both of these parameters can increase the load-carrying capacity by 43.1%,36.8%,69.7%,and 166.7% at temperatures of 25,200,600,and 1000 °C,respectively.In addition,increasing the BI causes a reduction in the load-carrying capacity (Fig.20f) because the load-carrying capacity of the RCC reduced by increasing the RLC and BI.However,the RLB did not have a significant effect on the load-carrying capacity of the RCC.In contrast,the RLC was the most effective variable in terms of the load-carrying capacity,but the load-carrying capacity decreased by increasing the RLC and BI.As a result,the BI did not have a positive effect on the load-carrying capacity of the RCC.
According to the results shown in Fig.20,the most effective parameters for improving the fire resistance of an RCC are the RLC and RBCD.The results show that the effect of RLC is greater than the effect of RBCD for improving the resistance of RCCs under PEF.
3.4 Damage mechanisms
Three kinds of damage were observed in the RCCs,including bending failure mode,bending and shear failure modes,and shear failure modes.The results show that most samples collapsed because of bending cracks.On the other hand,the failure of the samples subjected to a temperature of 1000 °C occurred due to shear and bending failure modes.Also,the failure mode of the samples in which the RLC was 8%,or the RBCD was 0.75,occurred due to shear and bending failure modes.There were several samples in which the shear failure mode occurred.For example,it occurred in the samples subjected to 1000 °C,and with an RLC of 8%.Figs.21a and 21c show the tensile and compressive damages of the bending failure mode,respectively.Figs.21b and 21d demonstrate the tensile and compressive damages of the shear and bending failure modes,respectively.
4 Surrogate models for predicting the load-carrying capacity of RCCs
In this study,four surrogate models,including MLR,MLnER,GEP,and an ensemble model,were used to predict the remaining load-carrying capacity of the RCC under PEF.These surrogate models are explained as follows.
4.1 MLR
MLR was considered as the first model to predict the remaining load-carrying capacity in this study.This statistical method attempts to model the relationship between two or more independent variables and a dependent variable by fitting a linear equation to observed data.In this study,nine independent variables were considered:beam depth,compressive strength of concrete,percentages of beam and column longitudinal reinforcements,percentage of joint transverse reinforcement,column depth,column reinforcement bond index,axial load of the column,and temperature.Load-carrying capacity was considered as the dependent variable.Eq.(7) represents the formulation of the MLR method:
whereYis the dependent variable,X1,X2,…,Xiare the independent variables andβ0,β1,…,βiare linear regression terms that have constant values.eis the estimated error term that is acquired from the constant variance and normal distribution of independent random sampling with mean zero (Shishegaran et al.,2018).The MLR technique calculatesβ0,β1,…,βiby using the least square error method in which the best-fitting line is obtained by minimizing the sum of the squares of the errors,as shown in Eq.(8):
whereX′ is the transpose ofX.
4.2 MLnER
MLnER was considered as the second model to predict the remaining load-carrying capacity in this study.This technique can be considered as an improved form of the MLR method in which the relationship between two or more independent variables and a dependent variable is modeled by summing the natural logarithm equations instead of linear equations.Eq.(9) represents the formulation of the MLR method:
Fig.21 Tensile and compressive damage on the RCC
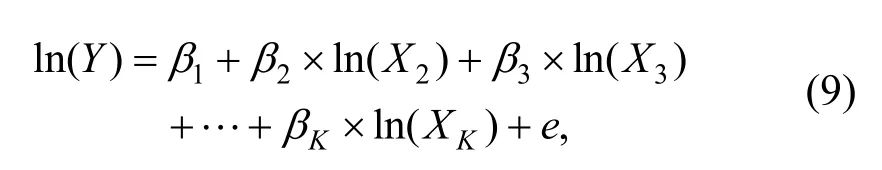
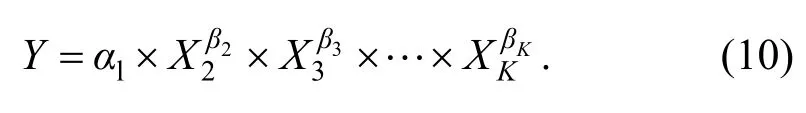
whereβ1,β2,…,βKare regression terms of the MLnER model.Ifαlis chosen such thatβ1+eequals ln(αl),then Eq.(9) can be rewritten in a simple form,as shown in Eq.(10):
4.3 GEP
GEP was selected as the third model in this study to predict the remaining load-carrying capacity of the RCC under PEF.This evolutionary algorithm is a combination of genetic programming (GP) and genetic algorithm (GA),and was invented by Ferreira in 1999 (Ferreira,2002).In this method,genes are composed of a head domain and a tail domain.The head domain contains a group of mathematical functions,including trigonometric functions,exponential functions,user-defined functions,and a combination of these functions,and also a set of terminals,including independent variables of the problem and constant values.The tail domain is composed only of terminals.In the GEP method,roulette wheel sampling is utilized to select data and reproduce them with modification.In other words,inappropriate data are removed,and the suitable data are replaced and used in the next generation.The steps of the GEP algorithm are illustrated in a flow chart (Fig.22).
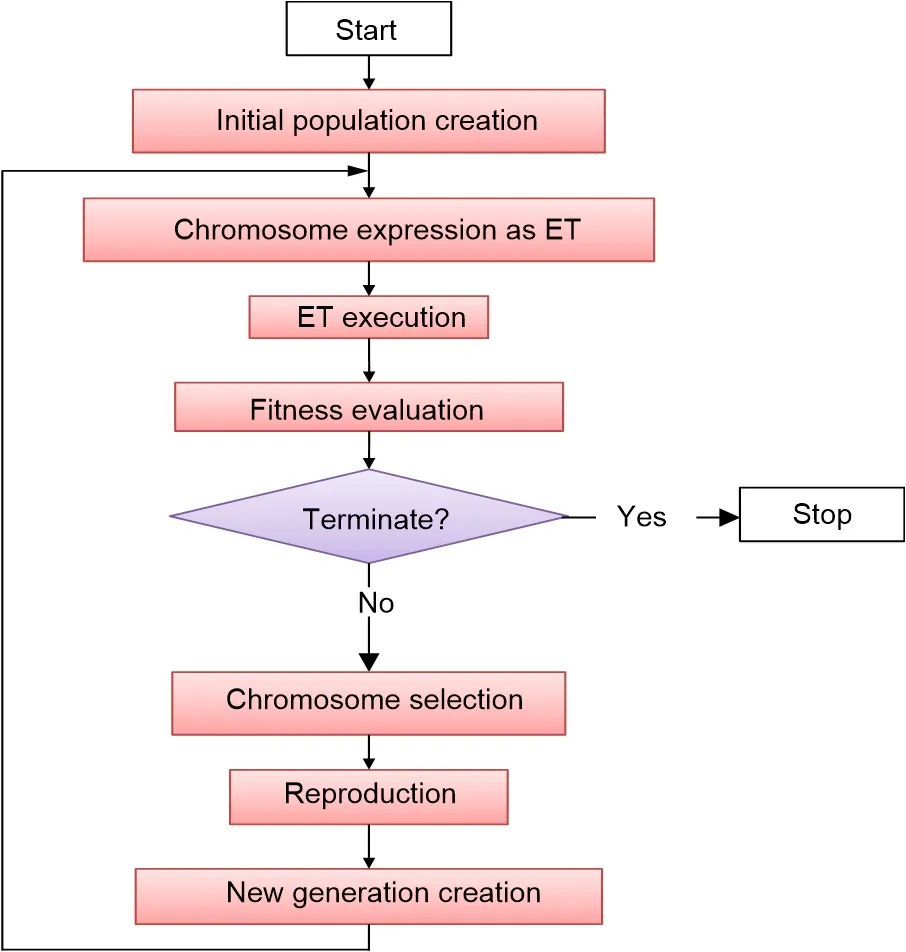
Fig.22 Steps of GEP (ET means equation and terminal)
4.4 Combination of MLR,MLnER,and GEP
In 1969,Bates and Granger first proposed combining the prediction methods to improve their accuracy (Islam and Alam,2013).In this study,an ensemble model was used as the fourth model to predict the remaining load-carrying capacity of the RCC under fire and lateral loadings.This model is a combination of the MLR,MLnER,and GEP methods,in which the outputs of MLR and MLnER,and all independent variables of GEP are imported as input variables (Fig.23).As a result,the fourth model could be considered as the combination of one linear and two nonlinear numerical models.
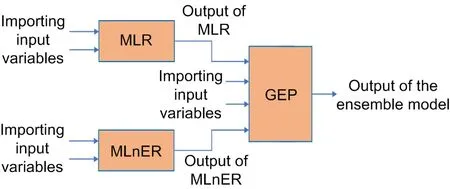
Fig.23 A flow chart for explaining the ensemble model
4.5 Results of prediction models
In all models,nine input variables were considered and used to predict the remaining load-carrying capacity of the RCC under PEF.The beam depth and RBCD were considered as input variables,although the column depth was considered as a constant value (40 cm) in this study.The column depth,RBCD,and beam depth are used for designing RCCs;thus,we evaluated the effect of them on the residual load-carrying capacity of the RCC under PEF (ACI,2014).The results show that GEP used only RBCD,and not beam depth.Table 5 lists the input variables and output in this study.
Note that the compressive load ratio (P) is defined as,in whichFandAgdenote the applied axial load of the column and the cross section of the column section,respectively.In the parametric study,after verifying the FE nonlinear model,132 various RCCs were simulated and analyzed by the commercial FE software ABAQUS.Nonlinear FE analysis for each specimen was implemented in 360 min on average by using a computer with the configuration:Core (TM) i7-2760QM CPU @ 2.40 GHz,RAM 6 GB.The surrogate models estimated the load-carrying capacity of the RCC in only a few seconds.Training and testing are two common steps involved in using surrogate models.In this study,70% of the samples (92 samples) were selected randomly and used for training the surrogate models.The input variables and FE results were used to calibrate the equation of each surrogate model.To evaluate the validity of the formulas obtained in the calibration step,the outputs of the remaining 40 samples were calculated based on these formulas,and then the calculated values were compared with the nonlinear FE results.The proposed formulas for MLR,MLnER,GEP,and the ensemble model are presented in Eqs.(11)–(14),respectively.
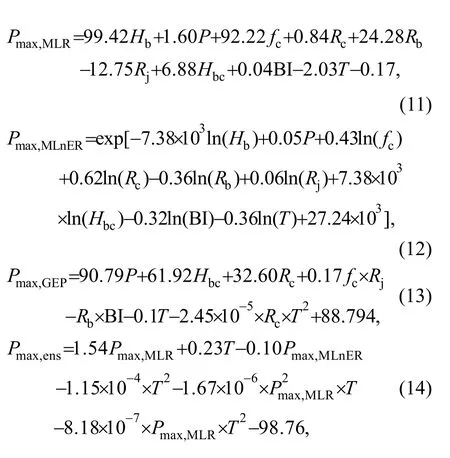
wherePmax,MLR,Pmax,MLnER,Pmax,GEP,andPmax,ensare defined as the residual load-carrying capacities of the RCC under PEF that were obtained from MLR,MLnER,GEP,and the ensemble model,respectively.To compare the accuracy of the numerical models in predicting nonlinear FE results,the RMSE,NMSE,coefficient of determination,and fractional bias were calculated for both the training and testing steps (Table 6).
With respect to all the statistical parameters,the MLR model gave a better prediction than the MLnER method (Table 6).The coefficients of determination of the GEP model were 0.980 and 0.964 in the calibration and validation datasets,respectively,which represent a better prediction than the MLR model.Furthermore,the values of RMSE and NMSE of GEP in both the training and testing steps were less than those of the MLR model.Thus,GEP performed better than MLR with respect to the coefficient of determination,RMSE,and NMSE.Both the GEP model and MLR model under-predicted results in the training step and over-predicted results in the testing dataset,according to the fractional bias parameter.
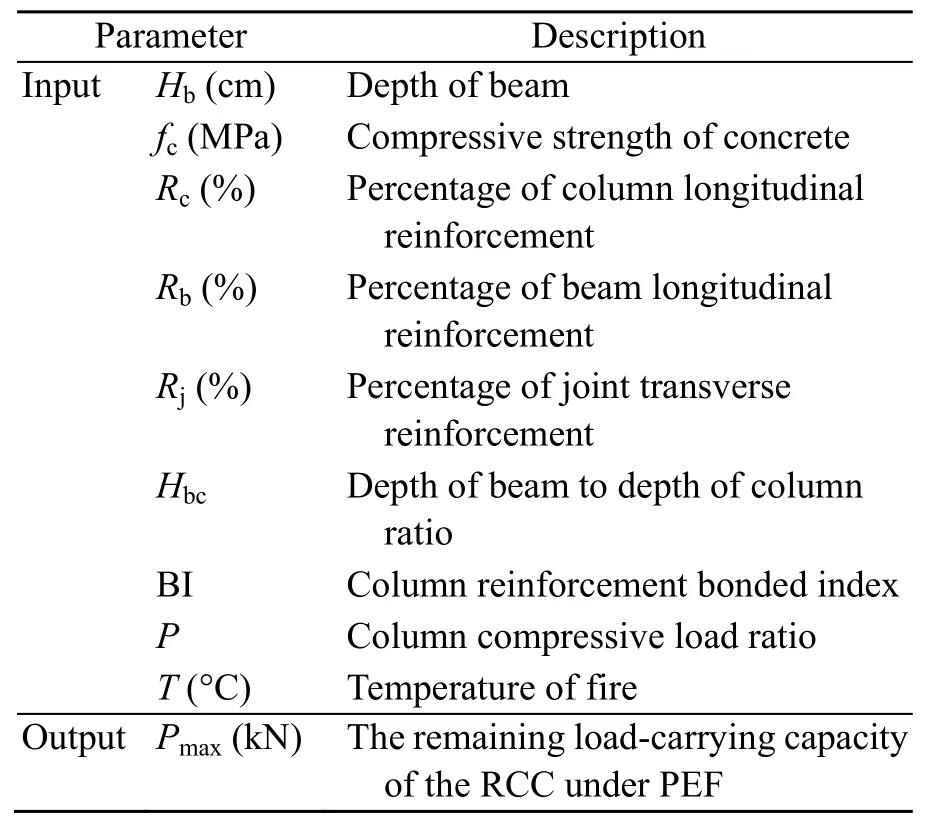
Table 5 Description of input variables and output
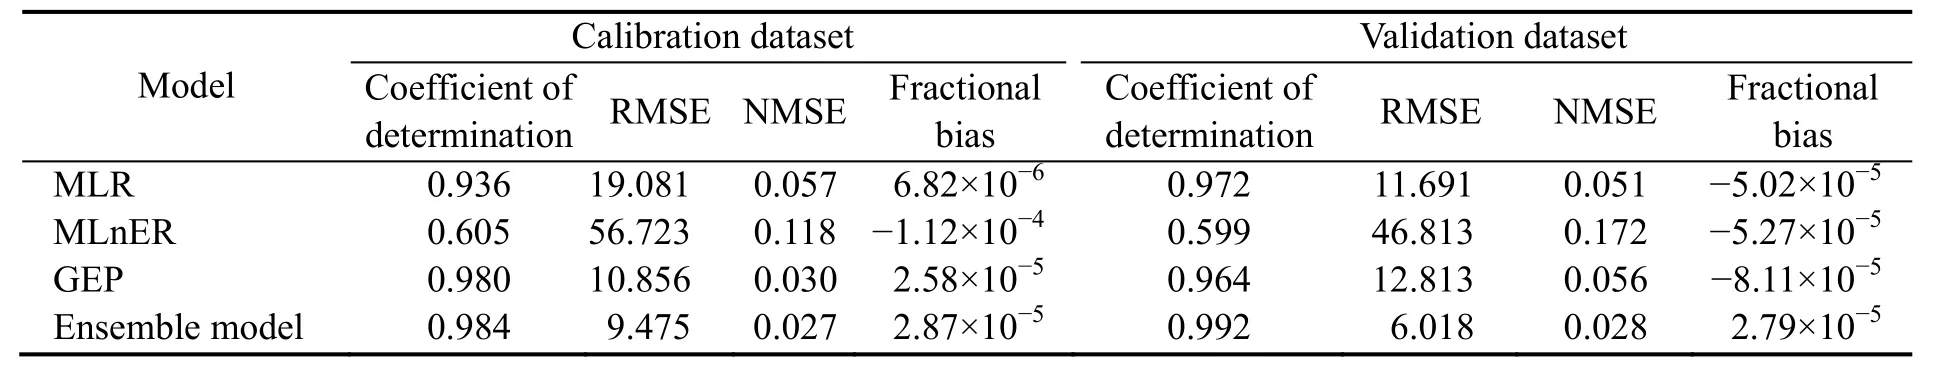
Table 6 Statistical parameters of the prediction models in the calibration and validation datasets
The ensemble model gave the best results in predicting the remaining load-carrying capacity of the RCC.The coefficients of determination of the ensemble model were 0.984 and 0.992 in the training and testing datasets,respectively,which are closer to 1 in comparison with the rsults of other models.Also,the values of RMSE and NMSE of the ensemble model in both the training and testing datasets were less than those of other models.
Another way for comparing the accuracy of the models in predicting the FE results is by calculating and comparing the error terms of the prediction models.Three error terms for each prediction model,including the maximum positive error,the maximum negative error,and MAPE,are shown in Table 7.
With respect to the maximum positive errors,the MLnER model shows better results in comparsion to MLR and GEP in predicting the residual load-carrying capacity of the RCC under PEF.The maximum negative errors of the MLR,MLnER,and GEP models were −112.05%,−178.09%,and −106.91%,respectively,which indicate that GEP performed better than the other two models based on the maximum negative error.According to the MAPE results,GEP performed better than the MLR and MLnER models.The results indicate that the ensemble model,which was developed based on the combination of these single models,can perform better than the single models because this model included all feature of these single models.Based on all the parameters of the error terms,the accuracy of the ensemble model for predicting the remaining load-carrying capacity of the RCC was better than that of the single models (Table 7).Thus,the ensemble model was selected as the best prediction model with respect to both statistical parameters and error terms.The maximum positive and negative errors of the ensemble model were calculated as 15.75% and −54.57%,respectively,and its MAPE as 6.49%.
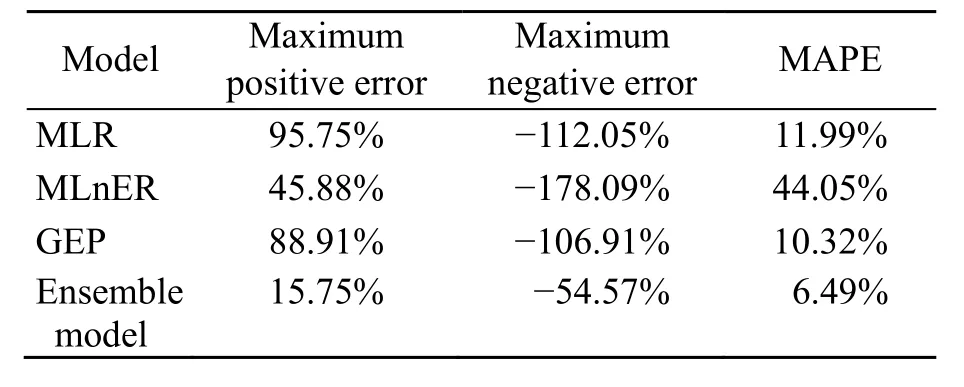
Table 7 Error terms of all models in predicting the remaining load-carrying capacity of the RCC
The error distributions of the four prediction models are shown in Table 8.The prediction results were divided into six categories,including the ‘very good’,‘good’,‘acceptable’,‘unacceptable’,‘bad’,and ‘worst’ predicted values.These categories correspond to the relative errors of 0–10%,10%–25%,25%–50%,50%–75%,75%–100%,and more than 100%,respectively.Using this approach,the best model was selected as the one with the highest proportion of errors in the ‘very good’ and ‘good’ categories.
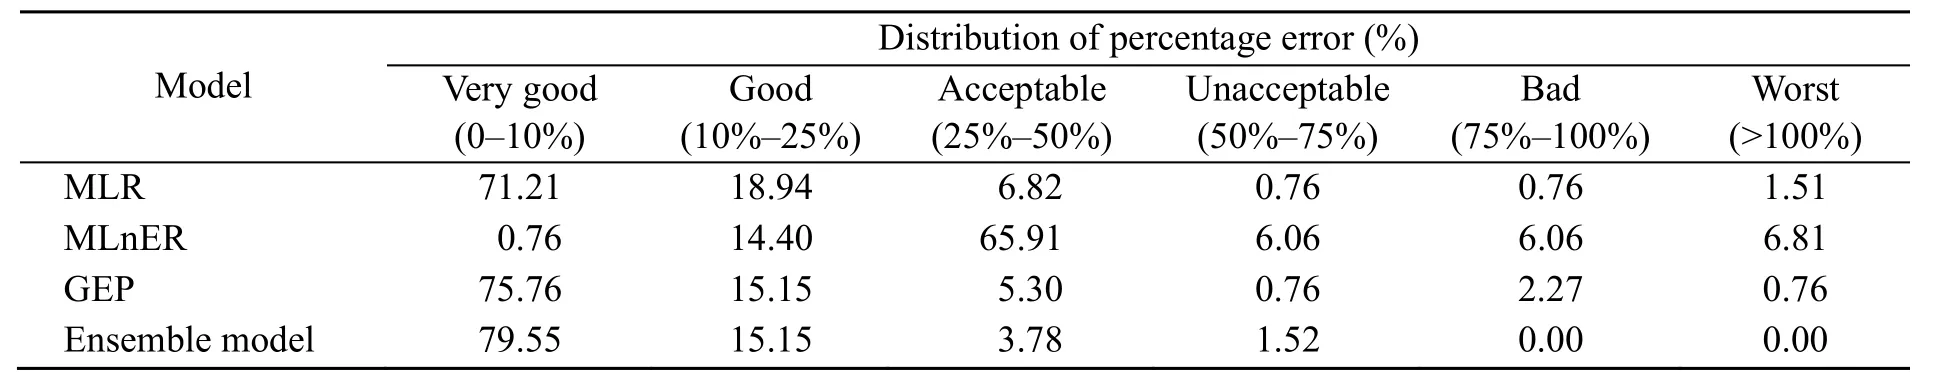
Table 8 Distribution of percentage errors of all prediction models
Based on the distribution of relative errors of the models,GEP and the ensemble model predicted the remaining load-carrying capacity of the RCC under PEF with the best accuracy.The results show that 75.76% and 15.15% of outputs of GEP were classified into the ‘very good’ and ‘good’ categories,respectively,whereas 79.55% and 15.15% of outputs of the ensemble model were predicted with very good and good accuracy,respectively.Furthermore,the errors of four samples predicted by GEP were more than 75%,whereas the errors of all samples that were predicted by the ensemble model were less than 75%.The results of the error terms,statistical parameters,and distribution of errors show that the ensemble model is an improved version of GEP.
The error distribution of the samples predicted by the ensemble model is shown in Fig.24.To justify the errors,the absolute errors of more than 25% were evaluated to find a reason for them.
According to Fig.24,the absolute errors of 87 samples predicted by the ensemble model,were close to zero.Moreover,the absolute errors of 130 samples were less than 50%.Samples 44 and 64 had errors of about −52% and −55%.The remaining load-carrying capacity of sample 64 was estimated to be 13.65 kN from FE nonlinear analysis,although the value predicted for this sample by the ensemble model was 21.09 kN (Fig.25).There was only a 7.44-kN difference between the FE results and the predicted results.In addition,this sample had the lowest load-carrying capacity among the samples.A small error can be justified and understood in predicting a small value.As a result,the error of the value predicted by the ensemble model was in an acceptable range.
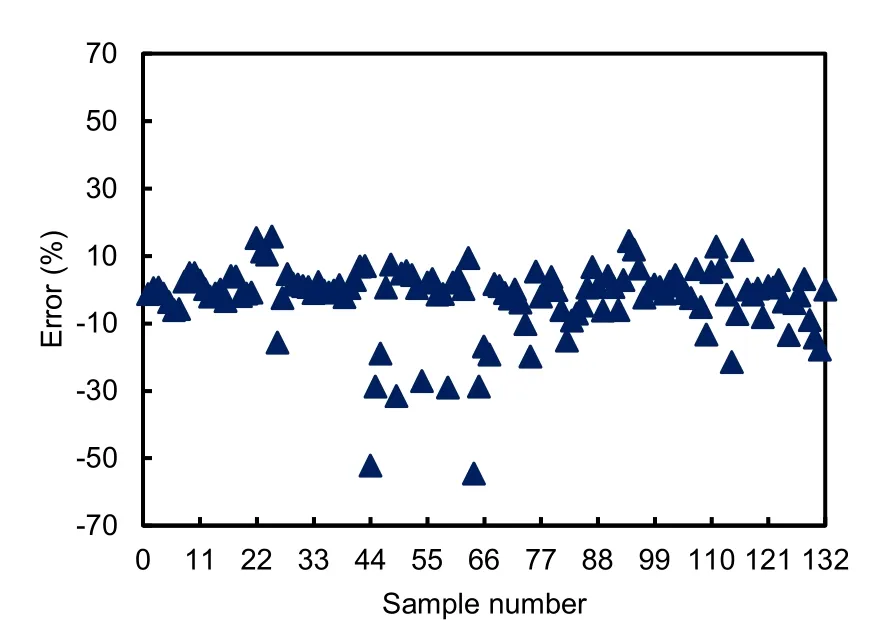
Fig.24 Error distribution obtained from the ensemble model
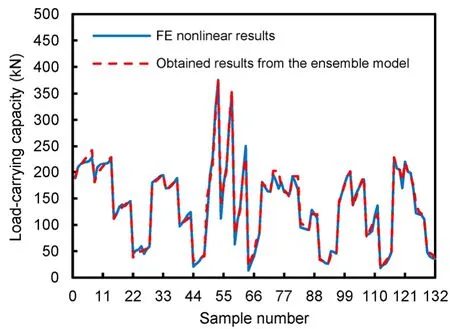
Fig.25 Comparison of the load-carrying capacities of the RCC obtained from the ensemble model and nonlinear FE analysis
The error of sample 44 was −52%.The estimates of the load-carrying capacity of the RCC obtained from FE nonlinear analysis and the ensemble model were 20.89 kN and 31.82 kN,respectively.Thus,the difference between the values obtained from FE nonlinear analysis and the ensemble model was about 10.39 kN.Therefore,the highest negative errors were related to samples which had a load-carrying capacity of less than 50 kN.
According to these results,a safety factor should be applied to the ensemble model for improving the reliability of this model.Based on the results of the maximum negative error of the ensemble model,the safety factor was selected as 1.55.The following equation is proposed for applying the safety factor to the results of the ensemble model:
wherePmax,SFis defined as the modified load-carrying capacity of the RCC under PEF,and SF is the safety factor.
5 Conclusions
In this study,the performance of RCCs under PEF was evaluated using nonlinear FE analysis.After verifying and validating an RC frame and an RCC with the results of two previous experimental tests,132 RCCs were simulated by the FE nonlinear method.The effects of nine variables,including the beam depth,compressive strength of concrete,percentages of longitudinal reinforcements of the beam and column,percentage of joint transverse reinforcement,column depth,column reinforcement bond index,axial load of the column,and temperature on the remaining load-carrying capacity of the RCC were evaluated.In the next part of the study,four models,MLR,MLnER,GEP,and an ensemble model,were used to predict the load-carrying capacity of the RCC.Seventy percent of the samples selected randomly were used for training the prediction formulas.The results of the remaining dataset were used to evaluate the validity of the prediction models.The key conclusions of this study can be summarized as follows:
1.PEF had considerable negative effects on the load-carrying capacity of the RCC.Increasing the temperature from 25 °C to 600 °C and 1000 °C caused more than 25% and 75% reductions,respectively,in the load-carrying capacity of the RCC.
2.The most effective parameter for improving the fire resistance of the RCC was the RLC.Increasing the RLC from 1% to 8% increased the load-carrying capacity of the RCC at different temperatures by 234.8%–492.9%.In contrast,RLB had no significant effect on the performance of the RCC under fire conditions.
3.Increasing the compressive strength of concrete increased the remaining load-carrying capacity of the RCC under PEF slightly.This effect was more significant at higher temperatures,at which the mechanical properties of steel decrease rapidly.
4.Both PCTS and RBCD improved the fire resistance of the RCC,although the effect of their combination was more marked at high temperatures.In contrast,increasing the BI resulted in a reduction in the load-carrying capacity of the RCC.
5.The results show that the applied temperature,RLC,and RBCD had significant effects on the failure mode of the samples.
6.Based on the different statistical parameters,error terms,and error distributions,the ensemble model,which is a combination of MLR,MLnER,and GEP,was selected as the best model for predicting the remaining load-carrying capacity of the RCC under PEF.
7.For improving the accuracy of the results of the ensemble model,a safety factor of 1.55 should be applied to the results of this model.
Contributors
Aydin SHISHEGARAN designed the research.Mehdi MORADI processed the corresponding data.Aydin SHISHEGARAN and Mohammad Ali NAGHSH wrote the first draft of the manuscript.Aydin SHISHEGARAN,Behnam KARAMI,and Mohammad Ali NAGHSH helped to organize the manuscript.Mohammad Ali NAGHSH,Arshia SHISHEGARAN,and Aydin SHISHEGARAN revised and edited the final version.
Conflict of interest
Aydin SHISHEGARAN,Mehdi MORADI,Mohammad Ali NAGHSH,Behnam KARAMI,and Arshia SHISHEGARAN declare that they have no conflict of interest.
 Journal of Zhejiang University-Science A(Applied Physics & Engineering)2021年6期
- Journal of Zhejiang University-Science A(Applied Physics & Engineering)的其它文章
- Optimizing the neural network hyperparameters utilizing genetic algorithm
- Damage detection in steel plates using feed-forward neural network coupled with hybrid particle swarm optimization and gravitational search algorithm*
- A deep energy method for functionally graded porous beams