Rock-like behavior of biocemented sand treated under non-sterile environment and various treatment conditions
Meghn Shrm,Neelim Stym,*,Krishn R.Reddy
a Discipline of Civil Engineering,Indian Institute of Technology Indore,Indore,453552,India
b Department of Civil,Materials,and Environmental Engineering,University of Illinois at Chicago,Chicago,IL,USA
Keywords:Bacteria Microbially induced calcite precipitation(MICP)Soil stabilization Microstructure Calcite content
ABSTRACT Microbially induced calcite precipitation (MICP) is a recently developed technique for microbiological ground improvement that has been applied for mitigating various geotechnical challenges.However,the major challenges,such as calcite precipitation uniformity,presence of different bacteria,cementation solution optimization for cost reduction,and implementation under non-sterile and uncontrolled field environment are still not fully explored and require detailed investigation before field application.This study aims to address these challenges of MICP to improve the geotechnical properties of sandy soils.Several series of experiments were conducted using poorly graded Narmada River (India) sand,which were subjected to various biotreatment schemes and tested for unconfined compressive strength (UCS),split tensile strength (STS),ultrasonic pulse velocity (UPV),hydraulic conductivity (after 6 d,12 d,and 18 d of treatment),and calcite content.The microstructure of sand was examined through a scanning electron microscope (SEM).Initially,the sand was individually augmented with two non-pathogenic bacterial strains,i.e.Sporosarcina (S.) pasteurii and Bacillus (B.) sphaericus.The stopped-flow injection method was adopted to provide cementation solutions at three different durations (treatment cycle) of 12 h,24 h,and 48 h and three different pore volumes (PVs) of 1,0.75,and 0.5.The pore volume here refers to the porosity which is expressed as a ratio,i.e.a porosity of 50% was used as 0.5.The results showed rock-like behaviors of biocemented sand with the UCS,STS,and UPV enhancement up to 2333 kPa,437 kPa,and 2670 m/s,respectively.The hydraulic conductivity reduction of 96.6% was achieved by 12% of calcite formation after 18 d of treatment using Sporosarcina pasteurii,12-h treatment cycle,and one pore volume of cementation media in each cycle.Overall,a 24-h treatment cycle and 0.5-pore volume cementation solution were found to be the optimal treatment which was effective and economical to achieve heavily cemented,rock-type biocemented sand using both bacteria.
1.Introduction
The conventional soil improvement techniques include replacement of soil,preloading for consolidation,deep mixing of cement and chemicals,dynamic compaction,vibro-densification,and grouting.These methods are energy-and time-consuming,expensive,and have a detrimental effect on the environment during either manufacturing phase (i.e.cement) or application phase(i.e.chemicals).The compaction and densification methods are not feasible at greater depths and also affect the stability of surrounding structures (DeJong et al.,2010;Sharma et al.,2021a).Karol (2003) carried out a case study in Japan and demonstrated the negative impact of acrylamide grout leaching in water and its poisoning effects.After the report of the case study,almost all chemical grout were banned in Japan,and many countries implemented similar prohibition.Other methods such as the use of acrylate liquid and supplementary cementitious materials were investigated to improve soils,especially collapsible soils and expansive soils(Fattah et al.,2014,2015;Tiwari and Satyam,2019,2020;Tiwari et al.,2020a,b,c).It is necessary to explore an alternative method for ground improvement that is effective,economically viable,eco-friendly,and sustainable.
Microbially induced calcite precipitation(MICP)is an innovative and promising technique for ground improvement which uses the bacterial phase of soil to precipitate calcite in-situ.MICP,also known as biomineralization or biocementation,was found potentially significant for scaling down the carbon emissions and required energy,as compared to conventional techniques,i.e.use of Portland cement for soil stabilization (Wang and Leung,2008;Consoli et al.,2010).The cost of conventional methods is high when applied to large sites (Khodadadi and Bilsel,2012).On the other hand,a higher amount of calcite precipitation can be achieved through ureolysis process.Moreover,industrial production of urease producing bacteria could be economical if alternative nutrient sources can be used to replace standard growth media.The requirements of urea and calcium chloride can be justified with lower grades or can be possibly replaced with industrial wastes(Cuzman et al.,2015).The biotreatment time depends on the site-specific conditions,i.e.type of soil,but the time consumption during MICP process can be comparable to some of the conventional ground improvement methods which require more time for stabilization.Biocementation provides a sustainable solution for environmental and geotechnical challenges of conventional methods using nature’s biology concept(Stocks-Fischer et al.,1999;Bachmeier et al.,2002;Mitchell and Santamarina,2005;Ivanov and Chu,2008;DeJong et al.,2011,2013;Xiao et al.,2018).In most of the studies,bacteria which produces highly active urease were used for MICP(DeJong et al.,2006;Whiffin et al.,2007;Van Paassen,2009;Chou et al.,2011;Al Qabany et al.,2012;Burbank et al.,2013;Cheng et al.,2013;Al Qabany and Soga,2013;Li et al.,2016;Lin,2016;Mahawish et al.,2019).The bacteria were cultivated aerobically and augmented in soil.The cementation solutions,including urea,calcium chloride,nutrient broth,and buffer solutions,allow biogeochemical reactions to take place in soil matrix(Dawoud et al.,2014;Sharma et al.,2019).The bacteria secrete the ureases and act as nucleation sites,which hydrolyze the urea into ammoniums and carbonate ions,as shown in Eq.(1).

The carbonate ions react with available calcium ions generated from calcium chloride provided in the cementation solution.As a result of the following reaction,the calcite precipitation occurs between soil grains:

The precipitated calcium carbonate bridges the soil grains together by cementation in the soil matrix and converts sand into sandstone (Stocks-Fischer et al.,1999;Ivanov and Chu,2008;Burbank et al.,2013;Stabnikov et al.,2015;Omoregie et al.,2018).The precipitated calcite between the pore spaces of soil increases the strength (Mahawish et al.,2019;Xiao et al.,2019c),stiffness(O’Donnell and Kavazanjian,2015;Xiao et al.,2019c),and dilatant behavior of soil(Lin et al.,2015;Xiao et al.,2019d).Simultaneously,calcite precipitation reduces the hydraulic conductivity(Al Qabany and Soga,2013;Chu et al.,2013) and compressibility of porous media (Lee et al.,2013;Xiao et al.,2020).The strength-enhancing property of the biocementation technique leads to exploring the effectiveness of this method for various geotechnical applications.A few studies have successfully demonstrated the use of the MICP to treat sands under different relative densities and particle sizes(Gao et al.,2019;Xiao et al.,2019a;Nafisi et al.,2020).The wide applications of MICP include liquefaction mitigation,erosion control,radionuclide sequestration,coastal sand dune stabilization,fugitive dust control,oil recovery,ancient buildings reclamation,biogeochemical landfill cover,concrete reclamation,contamination immobilization,and hydraulic conductivity reduction(Finnerty and Singer,1983;Ramachandran et al.,2001;Whiffin,2004;DeJong et al.,2006;Kavazanjian and Karatas,2008;Van Der Ruyt and Van Der Zon,2009;Burbank et al.,2013;Reddy et al.,2019;Sharma et al.,2020).
Some laboratory and field investigations include sand column method,fully immersed flexible mold method,tank experiment,and field trial to achieve biocementation in soil(Van Paassen et al.,2010;Al Qabany et al.,2012;Bing,2014;Gomez et al.,2014a,b;Li et al.,2015;Choi et al.,2017).There are various challenges associated with the upscaling of MICP from laboratory-scale to large-scale field application.These associated challenges include:low activity of microorganisms at greater depth due to the lack of nutrients and anaerobic conditions;uncontrolled environmental conditions such as temperature;non-uniform calcite precipitation;formation of unwanted by-products;inadequate monitoring of biogeochemical reactions;lack of integrated biogeochemical models for the performance prediction;concerns with durability of biocemented soil;and lack of education of practitioners and engineers(DeJong et al.,2013;Terzis and Laloui,2019).Very few researchers have conducted large-scale testing and field applications of MICP (Van Paassen,2011;Gomez et al.,2016;Pablo et al.,2020).Nevertheless,the MICP has been gaining significant interest in geotechnical applications.However,the available information on large-scale applications and engineering behaviors of biotreated soil is still limited.A few studies have been conducted to understand the tensile behaviors of biocemented sand (Liu et al.,2019;Xiao et al.,2019b).The biocemented sand shows rock-like properties,but the investigations and detailed comparisons with rock properties have not been conducted.The mechanical behaviors,both micro-and macro-scale properties,of biocemented sand,should be investigated under uncontrolled environmental and non-sterile conditions that are found in actual field.It is necessary to explore the formation of calcite crystals,the amount and frequency of injection of cementation solution,and the effect of bacterial strain on biotreatment before applying the biotreatment in the field.
The authors have recently investigated the eligibility of Bacillus(B.) sphaericus (an under-recognized bacterium) and the effects of different urea and calcium chloride concentrations on the MICP process.B.sphaericus results in a significant amount of calcite precipitation as compared to Sporosarcina (S.) pasteurii,but the effect on engineering properties of soil still needs to be analyzed for better understanding (Sharma et al.,2019).The field application challenges of MICP method are also immense because of nonsterile conditions and environmental influences due to temperature variations (Sharma et al.,2021a).The present study was carried out to address the above-mentioned limitations of previous studies.The effects of different treatment durations and pore volumes(PVs)of cementation media on MICP were analyzed through laboratory experiments under non-sterile and non-temperaturecontrolled conditions.Pore volume refers to the porosity which is expressed as a ratio,i.e.a porosity of 50% was used as 0.5.The strength enhancement,rock-like behaviors,liquefaction resistance,and hydraulic conductivity reduction of biocemented sand were investigated using two bacterial strains,i.e.Sporosarcina pasteurii and B.sphaericus.The bacteria were augmented only at the beginning of the treatment;and then,it was allowed to attach to sand and stimulate for 24 h.If any of these soil-based bacteria are already present in the soil,then such bioaugmentation may not be needed,and the biostimulation can only be carried out using nutrient broth and urea medium.Different treatment durations and amounts of cementation solution were selected to optimize the treatment time and cost in field applications.The variations in hydraulic conductivity were also analyzed after 6 d,12 d,and 18 d of treatment.The microstructural changes that occurred due to biocementation between sand particles were analyzed through scanning electron microscope (SEM).
2.Materials and methods
2.1.Narmada sand properties
The sand used in this study was collected from the basin of the Narmada River near Indore,Madhya Pradesh,India.The sand was oven-dried for 24 h at 105°C (Sun et al.,2018).The grain size analysis was carried out according to the IS:2720 (Part 4) (1985).The coefficients of uniformity(Cu)and curvature(Cc)were 2.6 and 0.72,respectively.The average grain size (D50) of sand was 0.32 mm.The sand was classified as SP,a poorly graded sand,as per the IS classification system (IS:1498,1970).The grain size distribution curve is shown in Fig.1.The maximum and minimum void ratios (emaxand emin,respectively) were determined according to the IS:2720 (Part 14) (1983) using relative density apparatus.The values of emaxand eminwere 0.72 and 0.38,respectively.The silt content in the sand was 1.11%.The specific gravity of sand was determined as 2.65.The sand was prone to liquefaction,according to index properties,and biocementation was considered as one of the mitigation options (Koester and Tsuchida,1989).
According to the gradation and low silt content,the sand is considered best suitable for improvement by biocementation.The general criterion of soil grain size ranges from 50 μm to 400 μm for the bacterial activity in soil pore throats(Rebata-Landa,2007).The size of bacterium commonly varies from 0.5 μm to 3 μm,which is significantly smaller than the pore size of Narmada sand(Madigan and Martinko,2003).
2.2.Bacteria cultivation and growth media
Two alkalophilic,gram-positive,non-pathogenic,and urease active bacterial strains,i.e.S.pasteurii (ATCC 11859) and B.sphaericus (ATCC 14577),were used for strength enhancement of the sand (Fig.2a).The non-pathogenic bacteria were used to avoid any health hazards to applicants and contamination to the soil environment.The parent culture purchased from National Collection of Industrial Microorganisms (NCIM),India,was stored at -20°C.The preserved strains were used for the inoculation of bacteria in the non-autoclaved nutrient broth (Himedia) solution in a laminar airflow cabinet.The nutrient solution was not autoclaved before inoculation to reduce the energy consumption in autoclaving and simulate the large-scale cultivation of bacteria for field applications.The inoculated solutions of both bacteria were kept in an orbital shaking incubator at a rotation speed of 200 revolutions per minute (rpm) for 24 h (Fig.2b).The bacterial growth occurred in an incubator at 30°C under aerobic conditions (Fig.2c and d).The bacteria optical density at 600 nm wavelength (OD600) was measured by spectrophotometer(Fig.2e).The stepwise procedure for bacteria cultivation is shown in Fig.2.The cultured solutions were not centrifuged to obtain pellets of bacteria.Supernatant removal was avoided in this study to reduce the cost and save time in applications.OD600was maintained at 1 for the comparison of calcite formation by both bacteria in similar conditions.
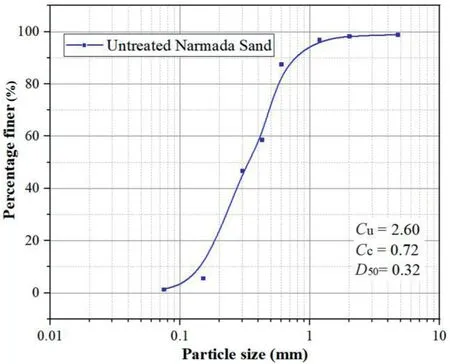
Fig.1.The grain size distribution of Narmada sand.
2.3.Cementation solution
The concentration of cementation media is one of the important factors affecting the amount and uniformity of calcite formation in pore throats of soil grains.The effect of different cementation media concentrations was analyzed in the previous study (Sharma et al.,2019).The equimolar concentration (0.5 M)of urea and calcium chloride dihydrate was found effective in achieving uniformity and higher calcite precipitation.This study includes an equal concentration of 0.5 M urea,and calcium chloride dihydrate (Xiao et al.,2019b).NH4Cl and NaHCO3were added as 10 g/L and 2.12 g/L,respectively,in cementation solution,which act as buffers.The 3 g/L of nutrient broth was mixed in the cementation solution.The cementation solution reagents were not autoclaved or filtered to target a more practical approach for field applications.The cementation solution was prepared using Narmada River water,which was filtered in Indian Institute of Technology Indore (IIT Indore) raw water treatment unit and received in laboratory taps.
2.4.Sample preparation and MICP treatment procedure
MICP treatment using urease producing bacteria on untreated Narmada River sand was carried out under the following conditions and setups:
(1) The PVC tube molds,with opening at the top and discharge nozzle at the bottom,were used to prepare cylindrical samples (Fig.3a and b).
(2) The inner diameters of the molds for unconfined compressive strength (UCS) and split tensile strength (STS) were 40 mm (Liu et al.,2019) and 70 mm,respectively.The diameter of STS sample(i.e.70 mm)was chosen higher as the sample needs to be placed along the diameter during testing.The larger diameter allowed a better understanding or visibility of tensile crack generation,as shown in Fig.3h.
(3) A Scotch-Brite®(Haryana,India)scouring pad was placed at the bottom of the mold,which acts as a filter.
(4) The molds were filled with oven-dried Narmada River sand to target 40%relative density.
(5) A funnel was used to fill the sand in the mold,maintaining the aspect ratio of 2:1 and 1:1 for UCS and STS samples(Fig.3b).
(6) The discharge nozzle was connected with a rubber pipe,and drainage of solutions was controlled through stainless steel sealing clamps fixed on rubber pipes.
(7) Another Scotch-Brite®scouring pad was placed at the top of the sand sample (Fig.3c).
(8) The soil samples were filled with two pore volumes (94 mL for UCS samples and 202 mL for STS samples) of tap water from top to bottom to expel air from the soil matrix.
(9) Initially,the drainage was stopped to create ponding of water at the top of the soil sample,and two-pore volume water was filled using a measuring cylinder.Then,the sealing clamps were opened to allow drainage of water (Mahawish et al.,2019).
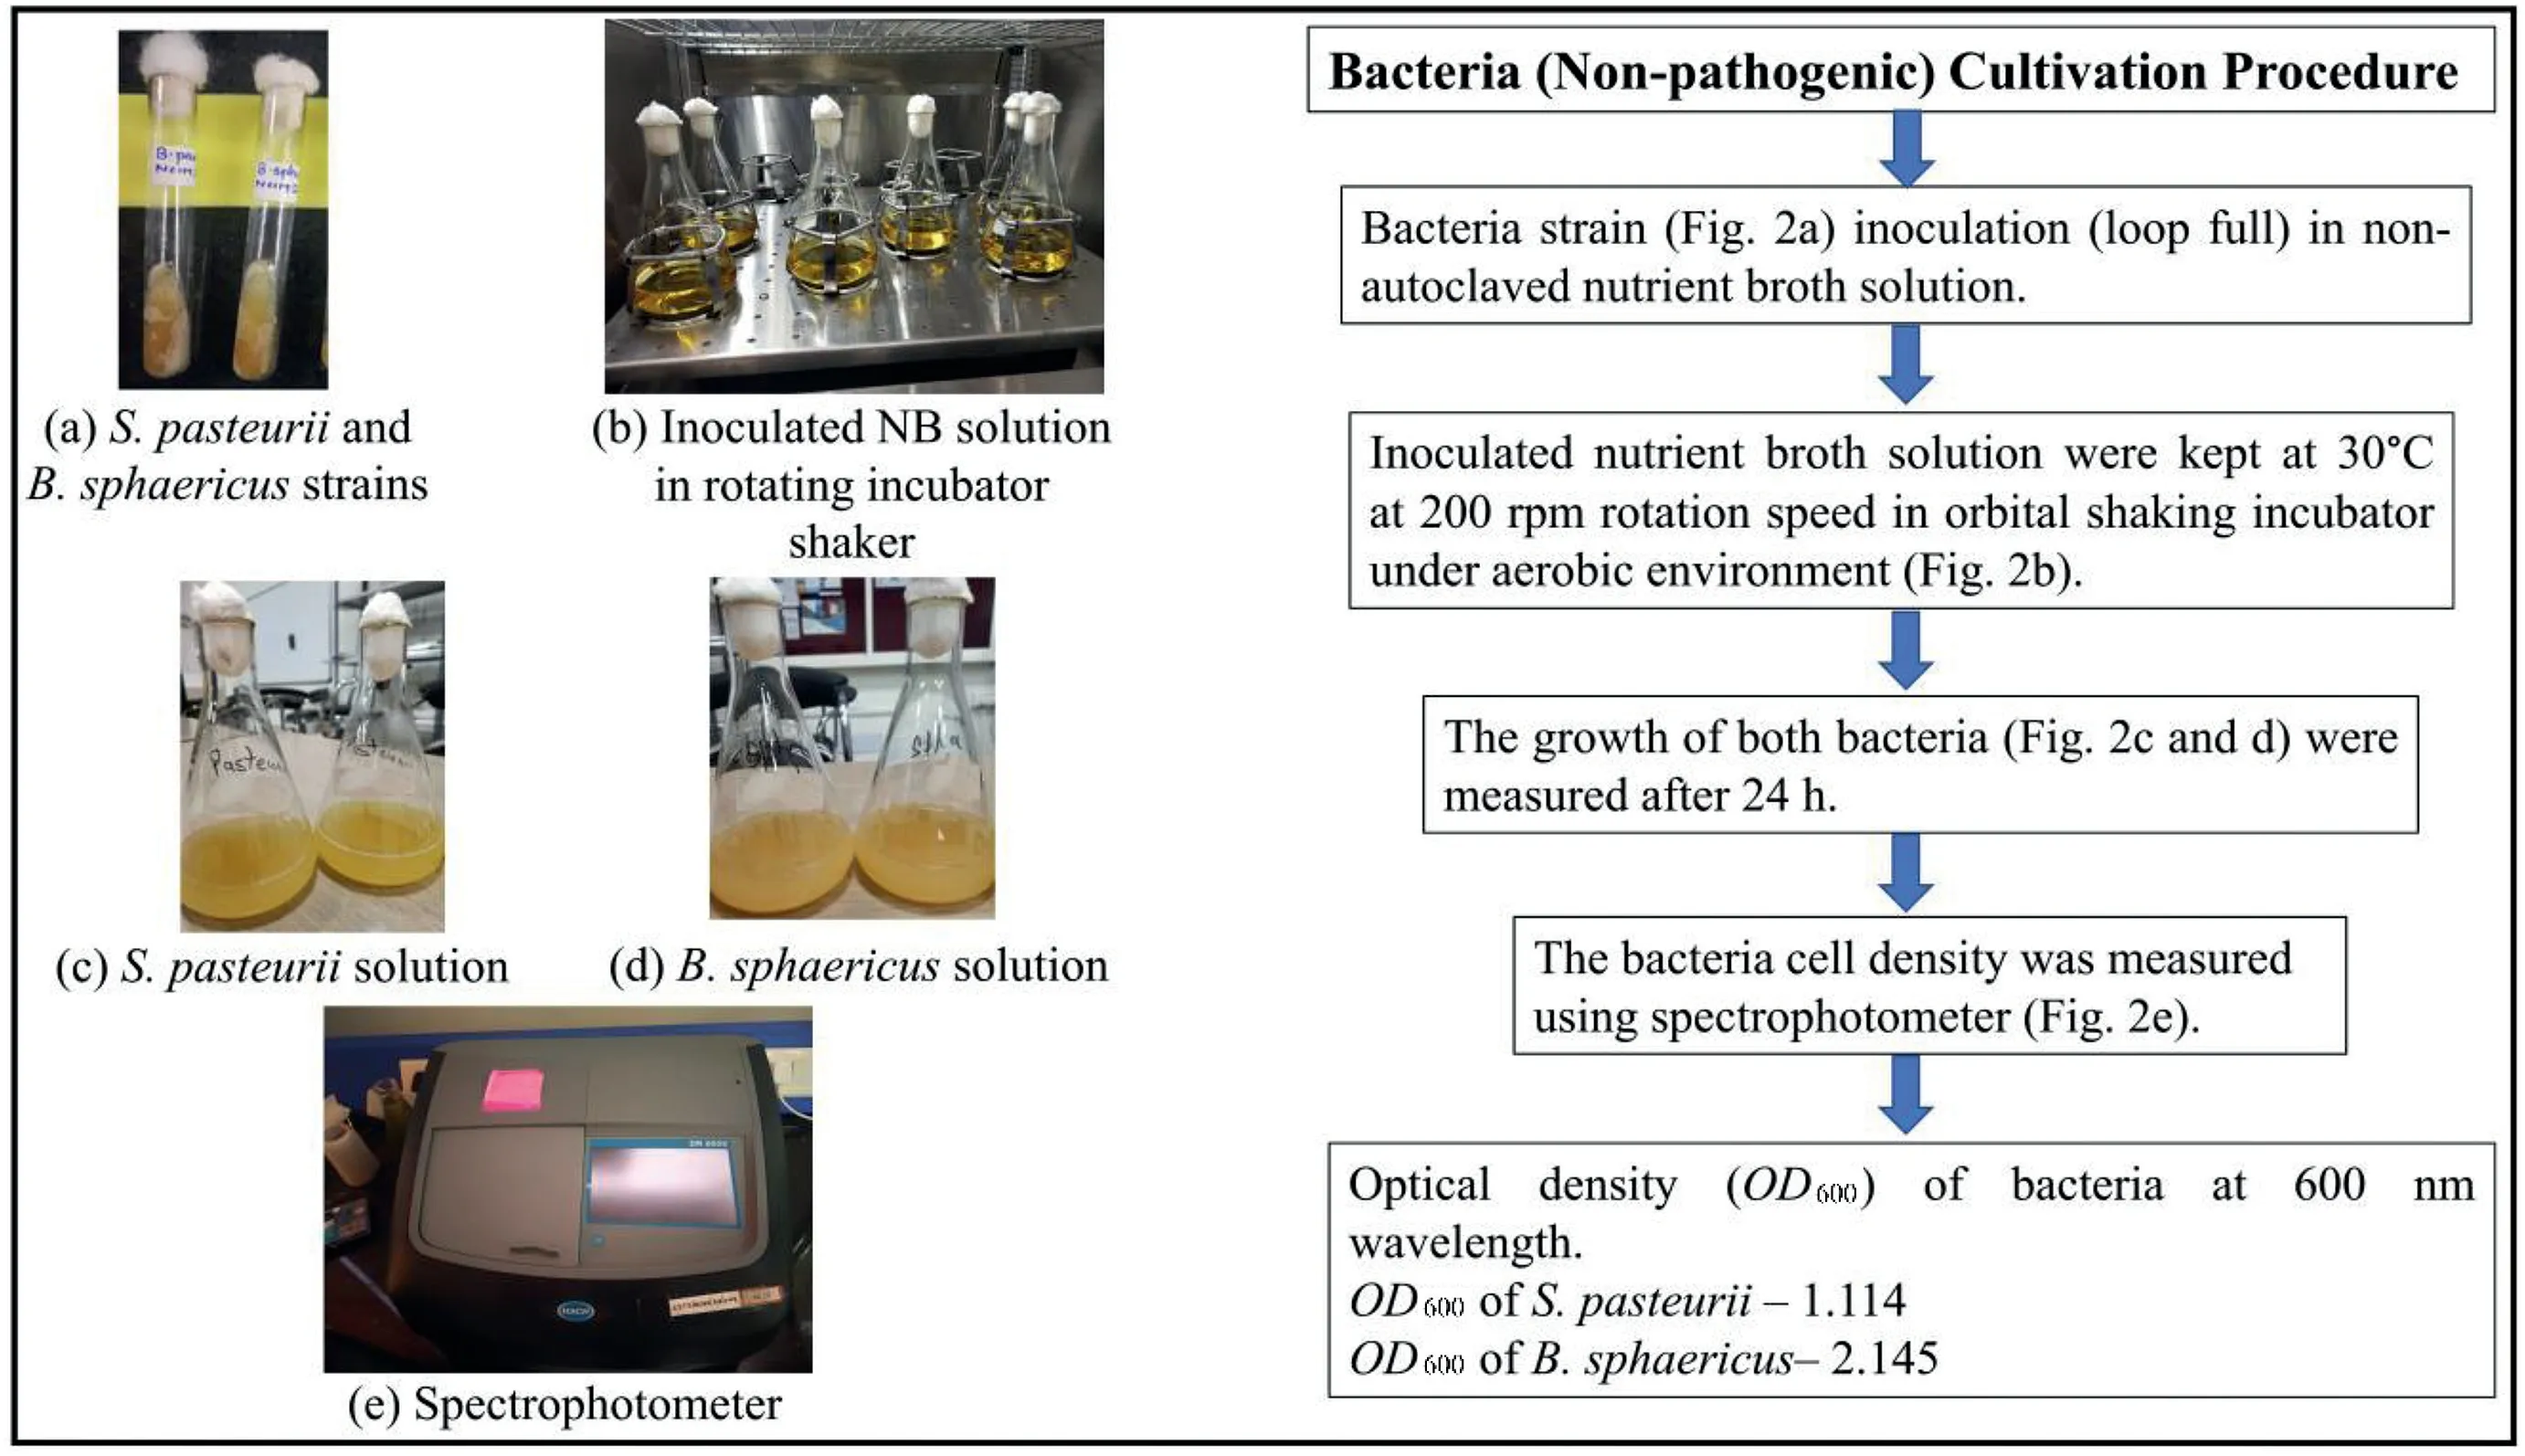
Fig.2.A detailed procedure of bacteria cultivation carried out in this study.
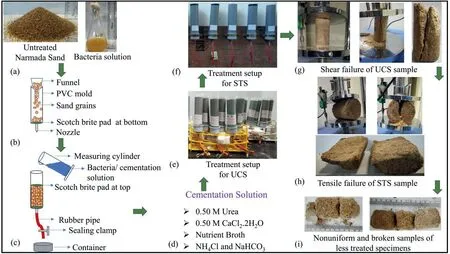
Fig.3.MICP treatment procedure for UCS and STS sample preparation and testing.
(10) The samples were placed in different combinations of the treatment cycle,bacterial strain,and pore volumes of cementation media to achieve the aim of the study.
Table 1 shows the details of a group of samples placed for MICP treatment.Different pore volumes of cementation solution were decided considering the saturation and absence of air in the sand matrix.The pore volumes of 0.75 and 0.5 were also used in a few studies (Gomez et al.,2016;Mahawish et al.,2018).However,the comparative effect of less pore volumes was not analyzed,which can be useful to achieve the economy in MICP technique.The treatment cycle was taken as the time interval up to which the sample holds the cementation solution.All samples were prepared in three replicas.
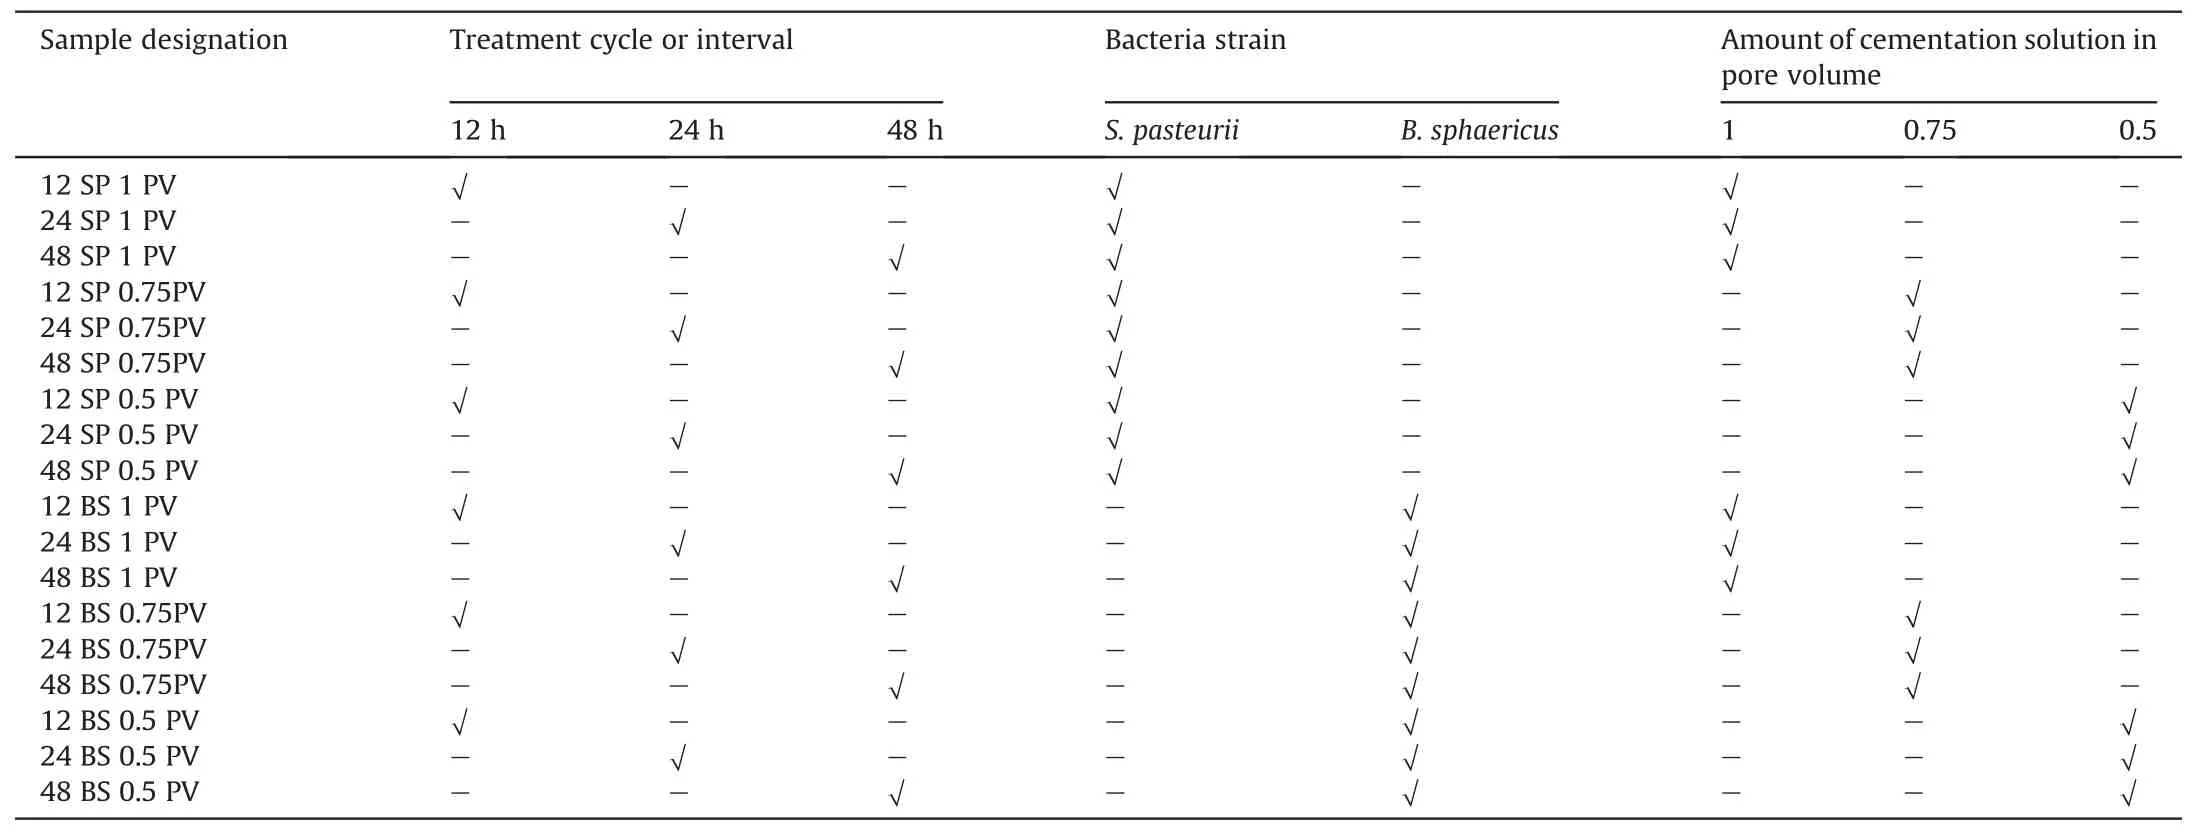
Table 1Details of samples for MICP treatment in this study.
The procedure of MICP treatment is described as follows:
(1) One pore volume bacteria solution was provided in saturated sand using a measuring cylinder.The bacteria solution was filled for 24 h for the uniform attachment of bacteria cells tothe sand surface;this duration was termed“attachment period”.After the attachment period,the bacteria solution was not drained to maintain significant bacteria cell concentration within soil pores.
(2) Thus,without removing the bacteria solution,urea medium(cementation media solution excluding calcium chloride dihydrate) was provided in 1 pore volume (PV) quantity for 24 h.The hydrolysis of urea started in the presence of urease secreted by bacteria,as mentioned in Eq.(1).The reason behind providing the urea medium after attachment period was to achieve a uniform distribution of carbonate ions before providing a calcium ion source.This period was considered as“simulation step”.
(3) The simulation step can be applied directly if the bacterium is already present in soil strata during field application.The presence of any specific bacterium can be analyzed through polymerase chain reaction (PCR) and DNA sequencing(Yargicoglu and Reddy,2015).
(4) After the simulation step,the filled solution was drained through a rubber pipe from the mold,and the treatment of sand continued up to 16 d with the variations of treatment cycle durations and cementation media pore volumes.Thus,the biotreatment was conducted up to 18 d in this study.This duration of treatment was decided based on the results of previous small-scale testing (Sharma et al.,2019) in which the biotreatment continued to 14 d and 28 d.The 28-d biotreated samples showed almost twice the amount of calcite precipitation than that of the 14-d samples.However,to economize the treatment by reducing cementation solution injections,it was decided to fix the treatment duration up to 18 d.
(5) The first two steps were similar for all the samples,and the 4th step continued from the 3rd day (after 48 h) of biotreatment.The cementation solutions were provided according to the details of the samples mentioned in Table 1.
(6) After every treatment cycle,the previously provided cementation solution was drained and freshly prepared cementation solution was injected according to the pore volumes in Table 1.
Fig.3c-f shows the procedure to provide bacteria/cementation solution,chemical components of cementation solution,and laboratory treatment setups for UCS and STS sample preparations,respectively.The stopped-flow injection method was adopted to achieve uniformity in calcite precipitation along the depth of the sample.Few studies have mentioned the higher effectiveness of the stopped-flow injection method over the continuous flow injection method to achieve uniform calcite formation (Barkouki et al.,2011).
2.5.Test procedures of UCS,STS,ultrasonic pulse velocity (UPV),hydraulic conductivity,and calcite content
The UCS testing was conducted on biocemented samples,according to the IS:2720(Part 10)(1991).The test was carried out to determine the strength of biocemented sand when treated with variable combinations of bacterium,cementation media pore volume,and duration of each treatment cycle.All the samples were oven-dried at 105°C for 24 h,and after that,the edges of all samples were smoothened using the concrete cutter for uniform loading.The UCS test was conducted at a constant strain rate of 1.25 mm/min to observe the propagation of shear failure in samples.Similarly,the STS test was carried out on a 1:1 aspect ratio sample by placing them along the diameter of UCS testing machine.
The non-destructive UPV testing was conducted on both UCS and STS samples,following the general procedure in IS:13311(Part 1)(1992).There is no standard test procedure for determination of the shear wave velocity in biocemented samples.A lubricating gel was applied on both ends of the cylindrical sample to fill the gap between the sample,and at receiving and transmitting transducers.
The hydraulic conductivity of UCS and STS samples was measured after 6 d,12 d and 18 d of treatment.The hydraulic conductivity test was conducted using a constant head method,as per IS:2720 (Part 17) (1986).The average hydraulic conductivity was determined for each sample and taken for the analysis with time and calcite content.
The broken samples of UCS and STS were collected and divided into three equal layers(top,middle,and bottom).The sub-samples were collected from the center of each layer for calcite content determination and uniformity analysis.The calcite content was determined using calcimeter,which is the combination of reaction cell and pressure gauge.The calcite precipitated sand was allowed to react with HCl in a closed reaction cell.This reaction generated the CO2gas in the reaction cell,and the pressure created by the gas was used to analyze the percentage of calcite in the sample.
2.6.Microcharacterization
The SEM analyses of untreated and biotreated samples were carried out at a beam intensity of 15 kV at 600× and 5000× magnifications,respectively.The microstructure analysis was conducted to determine the effect of different treatment cycles on the size and formation of crystals.The sub-samples of small sizes were collected from the center of broken samples to capture the sand-calcite bonds and calcite formation on the sand surface.The sub-samples were gold-sputter coated to generate the conductivity in samples.
3.Results and discussion
3.1.Effect of different biotreatment combinations and amount of calcite precipitation on UCS
As shown in Fig.3g,the biotreated samples were tested for UCS determination.The samples were smoothened at the top and bottom for uniform loading.Shear failure was observed in biocemented samples (Fig.3g).Fig.4 shows the macroscopic mechanical behaviors of biocemented samples,analyzed by UCS test and calcite precipitation.The average calcite content of three replicas and three layers of each sample was calculated to analyze the relation between UCS and calcite content.The UCS of each combination included three replicas with a coefficient of variation of less than 13%.The maximum UCS value of 2333.3 kPa with 12%of calcite content was found in the sample“12 SP 1 PV”.The sample designated as“12 SP 1 PV”received a total of one pore volume of S.pasteurii solution,one pore volume of urea medium,and 34 pore volume of cementation solution in 18 d of treatment.The sample“12 BS 1 PV”showed almost 31% less strength (1609.21 kPa UCS)and 2% a less amount of calcite precipitation than those of“12 SP 1 PV”.The difference between these two samples was the type of bacteria injection.The less strength of the B.sphaericus sample may be due to environmental conditions,especially laboratory temperature (average high temperature of 26.5°C and average low temperature of 9.8°C in January 2020).The experiment was carried out in winter at IIT Indore,India.The laboratory temperature was not controlled to simulate field conditions of varying temperatures in day and night.The effect of temperature was incorporated on the basis of the previous study,which was conducted on these two bacteria to find out the suitability of MICP through the amount of calcite precipitation and microcharacterization (i.e.SEM,X-ray diffraction (XRD) and Fourier-transform infrared spectroscopy(FTIR)) (Sharma et al.,2019).An almost similar amount of calcite precipitation was found in the samples biotreated by these two bacteria,and the crystal growth was also comparable.However,the experiments of the previous study were carried out in summer(June 2019)with average high and low temperatures of 36.2°C and 24.1°C,respectively.
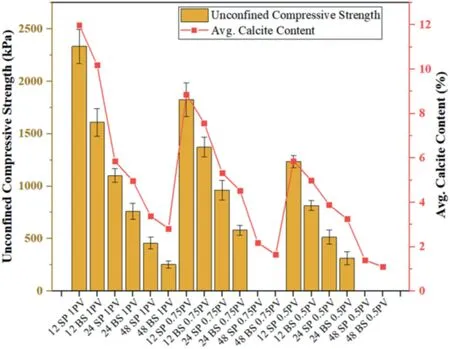
Fig.4.Variation of UCS value with average calcite content of biocemented samples.
The results from Fig.4 signifies that prolonging the time of the treatment cycle,i.e.12 h to 24 and 48 h,and decreasing the pore volume of cementation media,resulted in decrease of strength and calcite precipitation.The samples“48 SP/BS 0.75PV”and“48 SP/BS 0.5 PV”were found nonuniformly cemented with less than 2.5%of calcite content.The total pore volume of bacteria solution,urea medium,and cementation solution received by these samples was 6-8 PV in 18 d.This amount of cementation media pore volume was found ineffective to strengthen the sand.The extracted nonuniform and broken samples are shown in Fig.3i.The UCS values of these samples were taken as zero,as it was not possible to determine the strength of samples by the UCS test.
It can be interpreted from the results that 24-h cycle treated samples show almost half of UCS values and calcite contents than that of 12-h treatment cycle with similar pore volume and bacteria.Though,this trend was not followed by 48-h cycle treated samples when compared with 24-h cycle samples.The UCS values and calcite contents of 48 h of treatment cycle samples was almost 0.33-0.4 times that of 24-h cycle treated samples.This was because of the early completion of the biochemical reaction,which forms the calcite crystal between sand grains.The crystal growth may be affected by the time-lag in simultaneous injections.The small size of crystals resulted in less strength of biocemented samples.The results of this study are consistent with the previously reported studies (Liu et al.,2017;Mahawish et al.,2019),even though the method of treatment,cementation media concentrations,and treatment cycle methodology were different.
3.2.STS variation of different sample groups with average calcite precipitation percentage
The biocemented samples of the 1:1 aspect ratio was placed along the diameter in the compression testing machine.The tensile failure was observed in biocemented samples,as shown in Fig.3h.STS variation of different groups of samples with average calcite content is shown in Fig.5.The amounts of calcite precipitation of three replicas and for three layers were found almost similar to that of UCS samples.Hence,the average calcite content was taken similar to that of the UCS samples.The STS results show an increasing trend with the increase in percentage of calcite formation,as shown in Fig.5.The results indicate a similar pattern of STS samples as UCS of all treatment combinations,and the coefficient of variation of each replica was also found to be less than 13%.It can be interpreted from the results that the value of STS is 0.176-0.219 times that of UCS.A similar linear relationship between UCS and STS was observed by Liu et al.(2019).
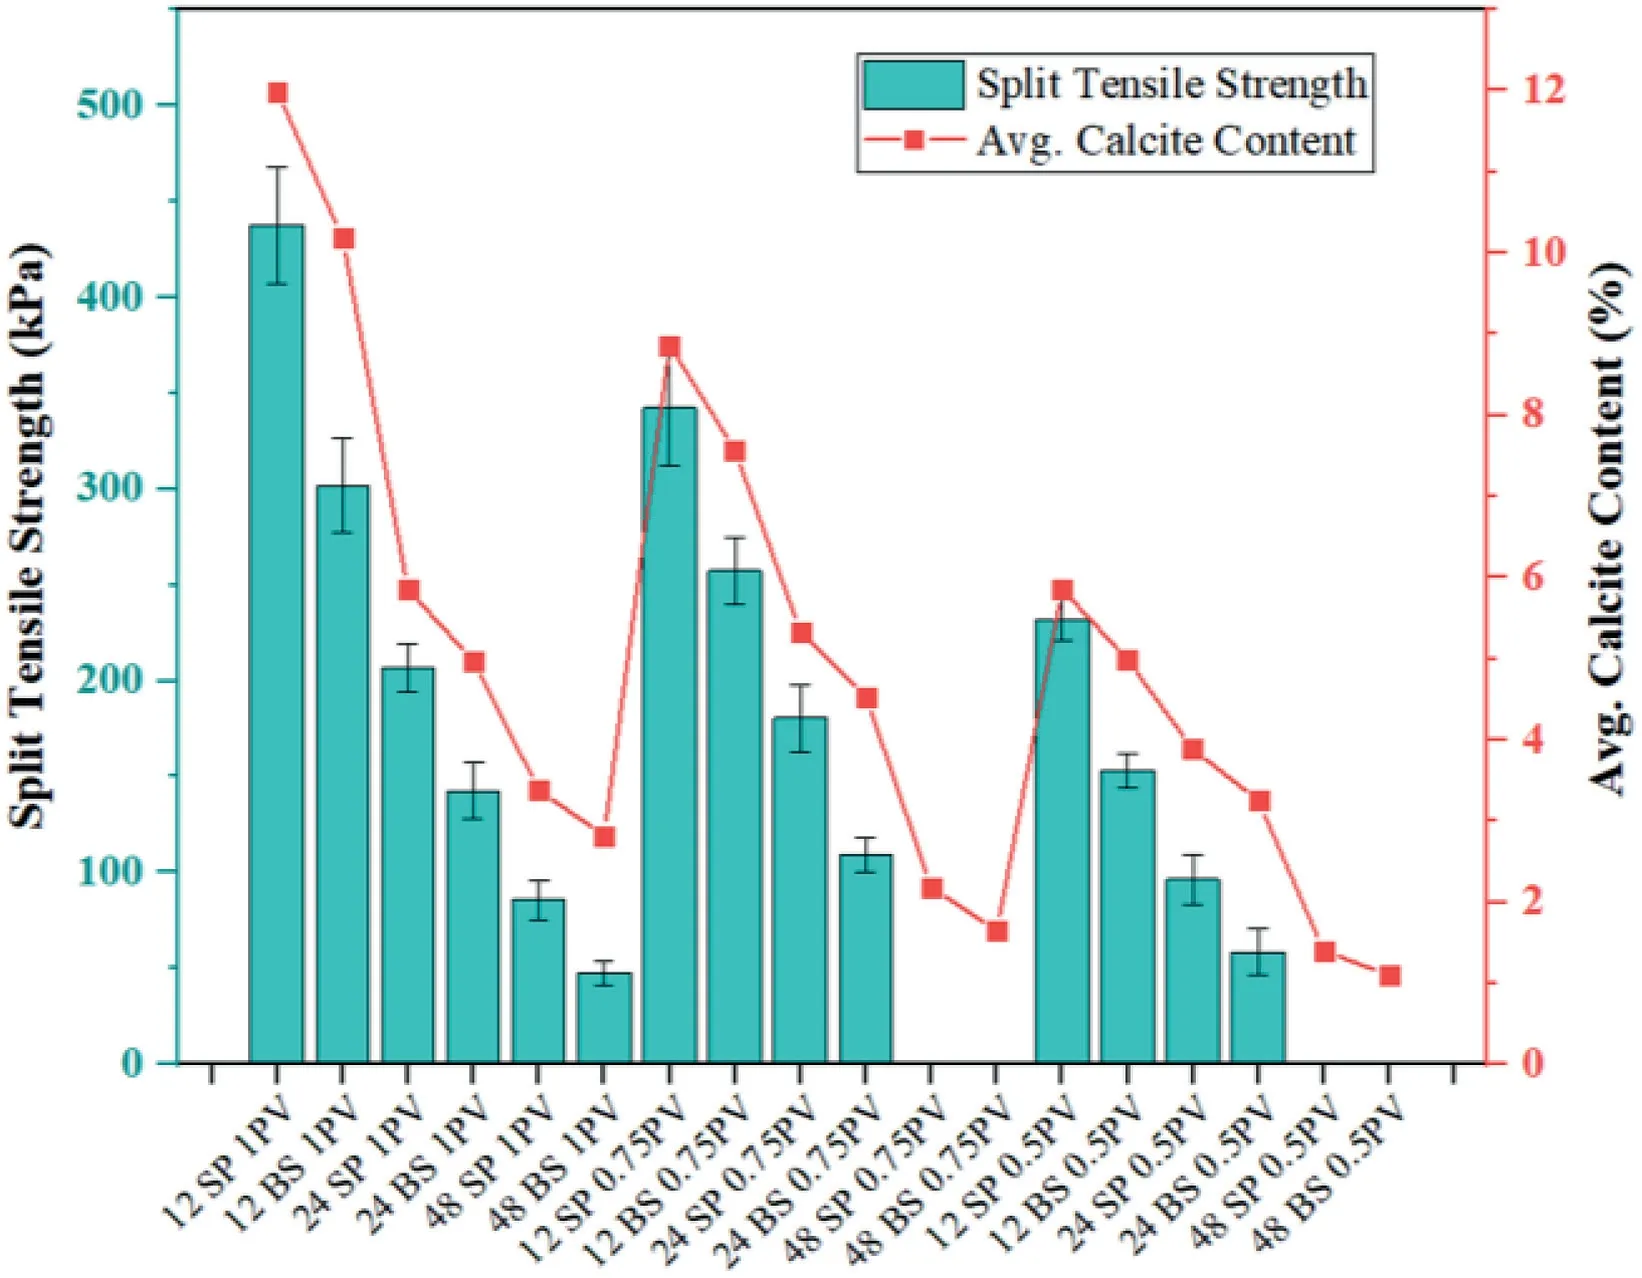
Fig.5.STS variation with average calcite content and different combinations of biotreatment.
The maximum (437.5 kPa) and minimum (47.6 kPa) STSs were observed in samples“12 SP 1 PV”and“48 BS 1 PV”,respectively.The amount of total cementation media pore volume provided in samples“48 SP/BS 1 PV”and“24 SP/BS 0.5 PV”was similar in 18 d of treatment.However,the strength was found a bit higher in samples“24 SP/BS 0.5 PV”.This may be due to less time-lag in treatment injections as compared to that in the 48-h cycle treated samples.The size of calcite crystals must be large in frequently injected cementation solutions for biotreatment.A few studies(e.g.Gandhi et al.,1995)demonstrate the mechanism of forming crystals,which includes the dependency of the crystals size on already developed crystal’s growth and nucleation of new crystals.The growth of existing crystal and formation of the new crystal depend on the interplay of cementation solution,urease producing bacteria,and duration of each treatment cycle (Mujah et al.,2019).The consequent treatment cycle in 24 h allowed the growth of already formed crystals,which resulted in large-size crystals.Thus,biocemented samples having higher calcite content with larger size of crystals in 24-h treatment cycles showed higher strengths.However,in 48-h treatment cycle,the available bacterial cell has already been attached or covered with calcite precipitation.Hence,the nucleation of new crystal initiated every time when cementation solution was poured,which resulted in a small size of a number of crystals.Overall,less calcite content and small size of crystals in biocemented samples treated with 48-h treatment cycles leads to lower strength improvement (Mujah et al.,2019).Hence,24-h treatment cycle can be adopted for the economical application of this method on large-scale testing.
Similar to UCS samples,the STS samples treated with 0.75PV and 0.5 PV following 48 h of treatment cycle were found broken or less precipitated while removing from molds.The STS test was not possible to conduct on these samples,hence the value was taken as zero.The percentage of calcite precipitation was also found to be little (1%-2.5%) in these samples,as shown in Fig.5.
3.3.Analysis of rock-like behaviors of biocemented sand through UPV
Fig.6 shows the UPV or shear wave velocity of biocemented samples under different treatment conditions,along with the equipment used for testing.The UPV of untreated,poorly graded liquefiable sand cannot be determined using the instrument,as the unsupported,cylindrical sample cannot be prepared.The literature was explored to identify the sand with similar properties for the comparison of shear wave velocity.Riveros and Sadrekarimi(2020a) examined that the shear wave velocity of poorly graded untreated sand(16%-36%of relative density)ranged from 149 m/s to 303 m/s at different confining pressures(ranging from 50 kPa to 900 kPa).Barkouki et al.(2011) reported 100 m/s of shear wave velocity in poorly graded sand at 100 kPa of vertical load.
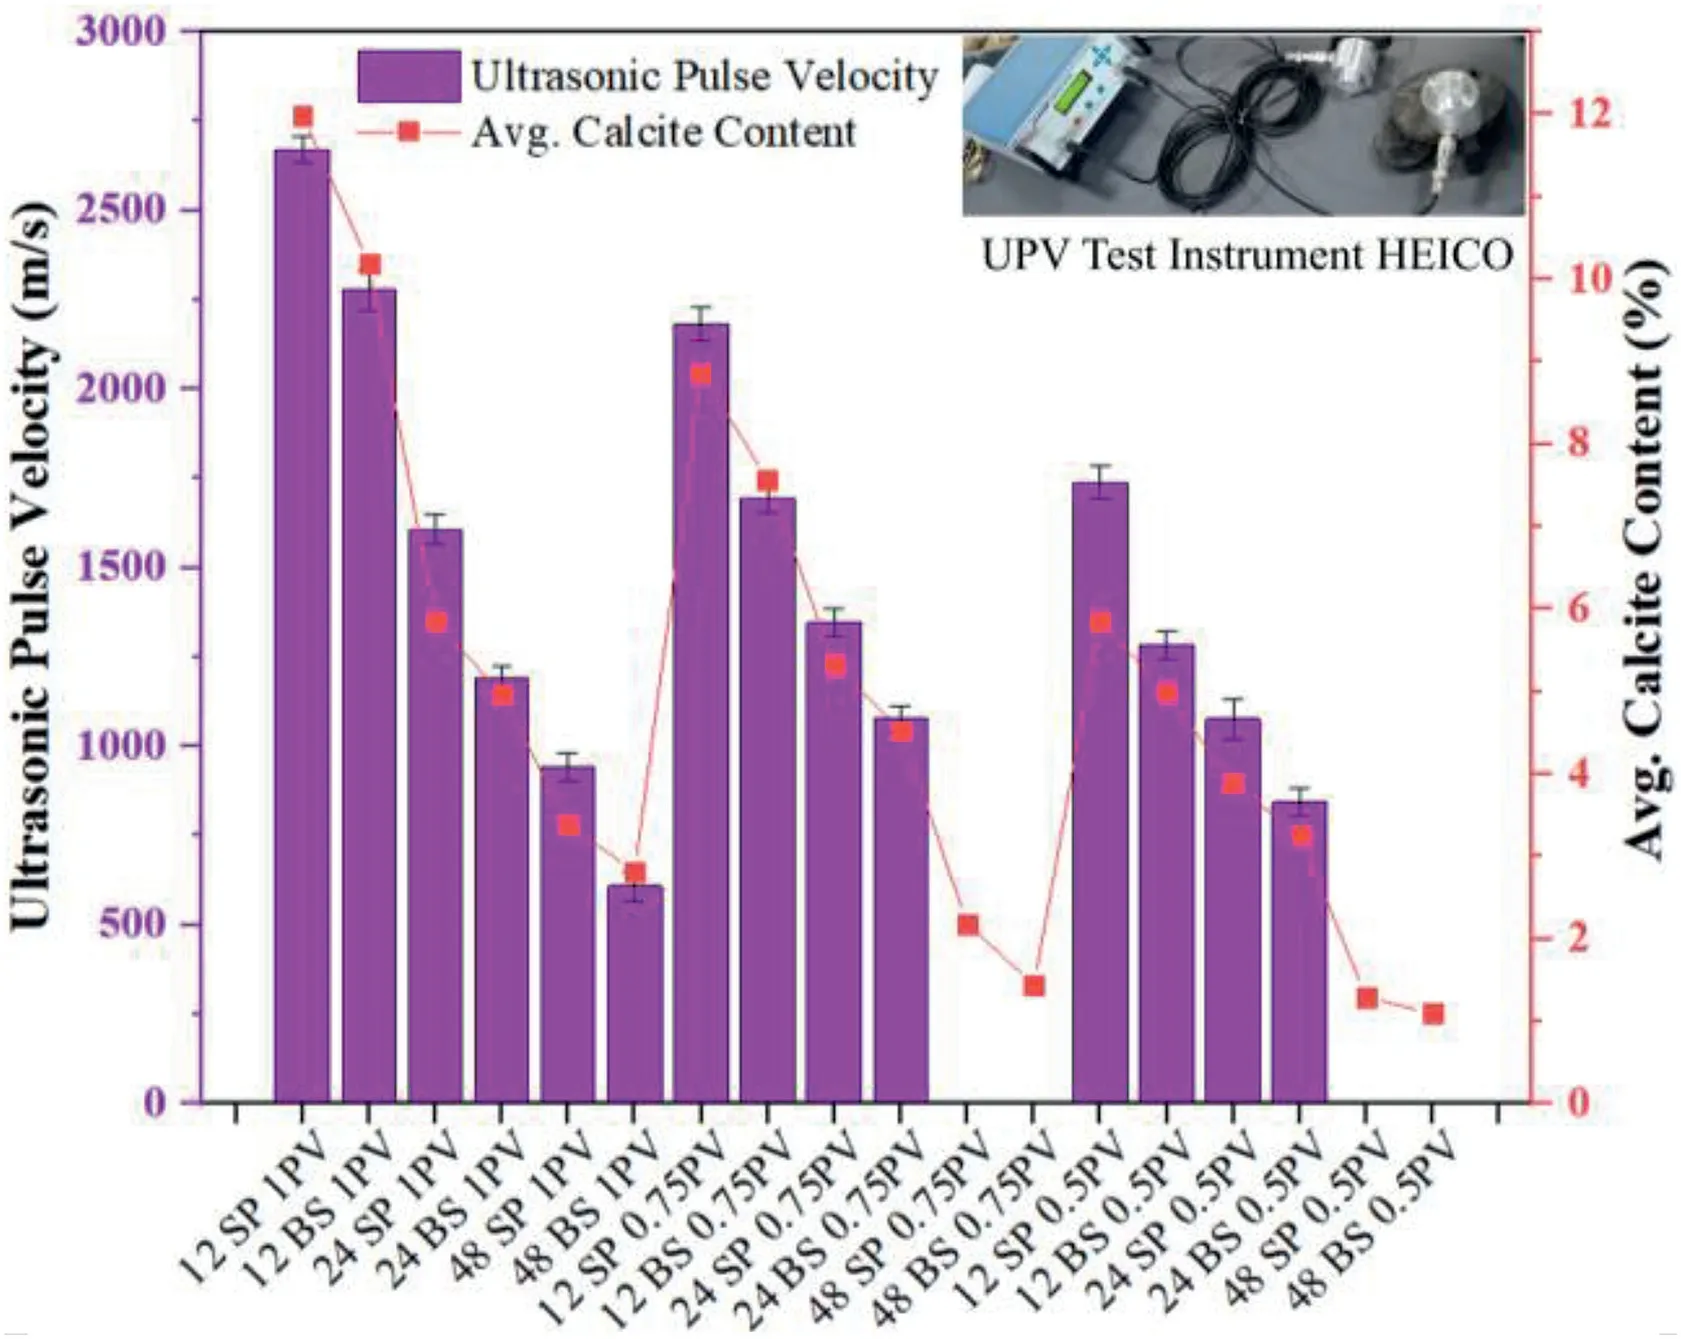
Fig.6.UPV values of biocemented sand under various treatment conditions.
Fig.6 shows the UPV values of biocemented samples treated in different conditions.The maximum UPV,i.e.2670 m/s,was observed in the sample“12 SP 1 PV”with 12% of average calcite content.The variation in UPV is in line with UCS and STS variations with calcite content.The minimum UPV of 608 m/s was measured in the sample“48 BS 1 PV”with 2.8% of calcite content.The minimum UPV of biocemented sample in this study was higher than that in Riveros and Sadrekarimi(2020a)which was 275 m/s at 3%of calcite content.The higher UPV value in this study was due to continuous cementation solution injection up to 18 d and differences in crystal morphology.It can also be interpreted that the shear wave velocity of biocemented sample is 75%-95% higher than that of the untreated sand.The ultrasonic shear wave velocity of samples“12 SP 1 PV”,12 BS 1 PV”,and“12 SP 0.75”was 2670 m/s,2278 m/s,and 2183 m/s,respectively,with 9%-12% of calcite content which is similar to the shear wave velocity of sandstone(Khazanehdari and Sothcott,2003).This signifies the rock-like properties of a biocemented sample.The field case studies on liquefaction occurrence show that when UPV>167 m/s,the soil is resistant to liquefaction (Saxena et al.,1988).Hence,the liquefaction can be mitigated with a minimum amount of 2.8%-3% calcite precipitation,also,if the higher strength is not required.The cementation level and ultrasonic shear wave velocity measured in this study represent a Holocene to Pleistocene geologic age range with different types of soil classes,according to the National Earthquake Hazards Reduction Program of USA (NEHRP,2003).Table 2 shows that all biocemented sand samples lay in the heavily cemented category and behaved like rock/hard rock according to the UPV or shear wave velocity (Vs) values except sample“48 BS 1 PV”.The lightly cemented or aged sand (stiff soil) category with 180 m/s ≤Vs≤360 m/s (NEHRP site class D) was not observed in molded biocemented samples.Montoya and Dejong (2015)observed lightly cemented sand with 300 m/s shear wave velocity and 1.01% mass of calcite.The samples which had less precipitated calcite content,i.e.samples“48 SP/BS 0.75PV”and“48 SP/BS 0.5 PV”,may lie in class D.Hence,it can be interpreted from Table 2 and Fig.6 that 0.5 PV cementation solution in 24-h treatment cycle bioaugmented with S.pasteurii can be used to achieve heavily cemented rock-type biocemented sand.The increase in treatment cycle duration and decrease in cementation solution pore volume can result in almost four times the reduction of the biotreatment cost.The sample“24 BS 0.5 PV”also lies in heavily cementedcategory.Thus,if B.sphaericus is present in the soil,biostimulation can be applied,which can further reduce the cost in culturing the bacterium and its application for bioaugmentation.

Table 2Cementation level,soil type,and site classification of biocemented samples according to NEHRP (2003).
3.4.Uniformity of calcite precipitation along with the biotreated sample depth
Fig.7 shows the variation of calcite precipitation with different treatment combinations and at different depths of samples.The calcite content was determined from three replicas and three layers with the average coefficient of variation for each layer less than 21%.The coefficient of variation was considered acceptable because of the effectiveness of MICP method majorly based on the activity of living organisms,i.e.bacteria.There are various factors which influence the MICP process,including bacterial density,pH value,temperature,crystal formation,etc (Tang et al.,2020).Nafisi et al.(2020) considered the values of coefficient of variation are higher than 21%.As described in Sections 3.1 and 3.2,the percentage of calcite formation between the sand grains affects the strength of the sample.The nonuniform and minimum amount of calcite precipitation was measured in sample“48 BS 0.5 PV”due to 48 h of treatment cycle and less pore volume of cementation solution.Thus,the samples“48 BS 0.5 PV”,“48 BS 0.75PV”,“48 SP 0.5 PV”,and“48 SP 0.75PV”were not sufficiently and uniformly cemented.The lag in treatment injections and less pore volumes also result in nonuniformity in calcite precipitation.This is an important observation as the uniformity of calcite precipitation is one of the major concerns of MICP method.
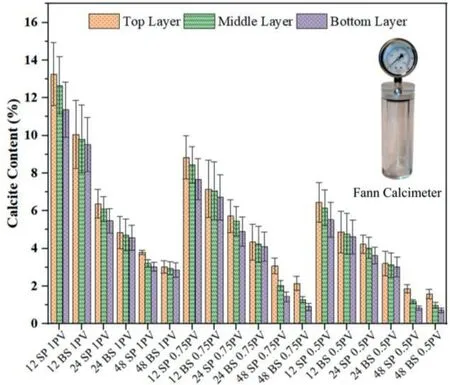
Fig.7.Three-layer calcite formation variation with all the combinations of biotreatment.
As shown in Fig.7,calcite precipitation in each layer of biocemented samples was almost similar with little variation along with the depth.The challenge of uniform calcite precipitation was effectively overcome in this study.The uniformity calcite precipitation in each sample shows the effective application of bacterial strains,cementation solution,and injection method.The amount of calcite precipitation decreased with the increase in treatment cycle duration and reduction in cementation media pore volume.The S.pasteurii treated samples also resulted in a 15%higher amount of calcite formation than B.sphaericus did.This signifies the robust nature of S.pasteurii bacterium to sustain in various environmental conditions and also enforces further study on the effect of MICP process at variable temperature using different bacterial strains.The amount of calcite precipitation was found in closed combination with previous studies (Mahawish et al.,2018;Sharma et al.,2019,2021b).
3.5.Reduction in hydraulic conductivity with time and calcite content
Fig.8 shows the decrease in hydraulic conductivity as compared to untreated Narmada sand,and after 6 d,12 d and 18 d of biotreatment of each sample combination.The average hydraulic conductivities of UCS and STS samples were taken for analysis,as the discharges were almost similar while taking the readings.It can be interpreted from the results that biotreatment leads to a decrease in hydraulic conductivity with increases in treatment time and cementation media pore volume,and a decrease in treatment cycle duration.The reduction in hydraulic conductivity with increasing treatment time was found to be due to the formation of calcite between sand grains as a result of continuous cementation solution injections and reducing porosity.The calcite formation between sand grains leads to development of new preferential flow paths to transmit cementation solution(Cheng and Cord-Ruwisch,2014).
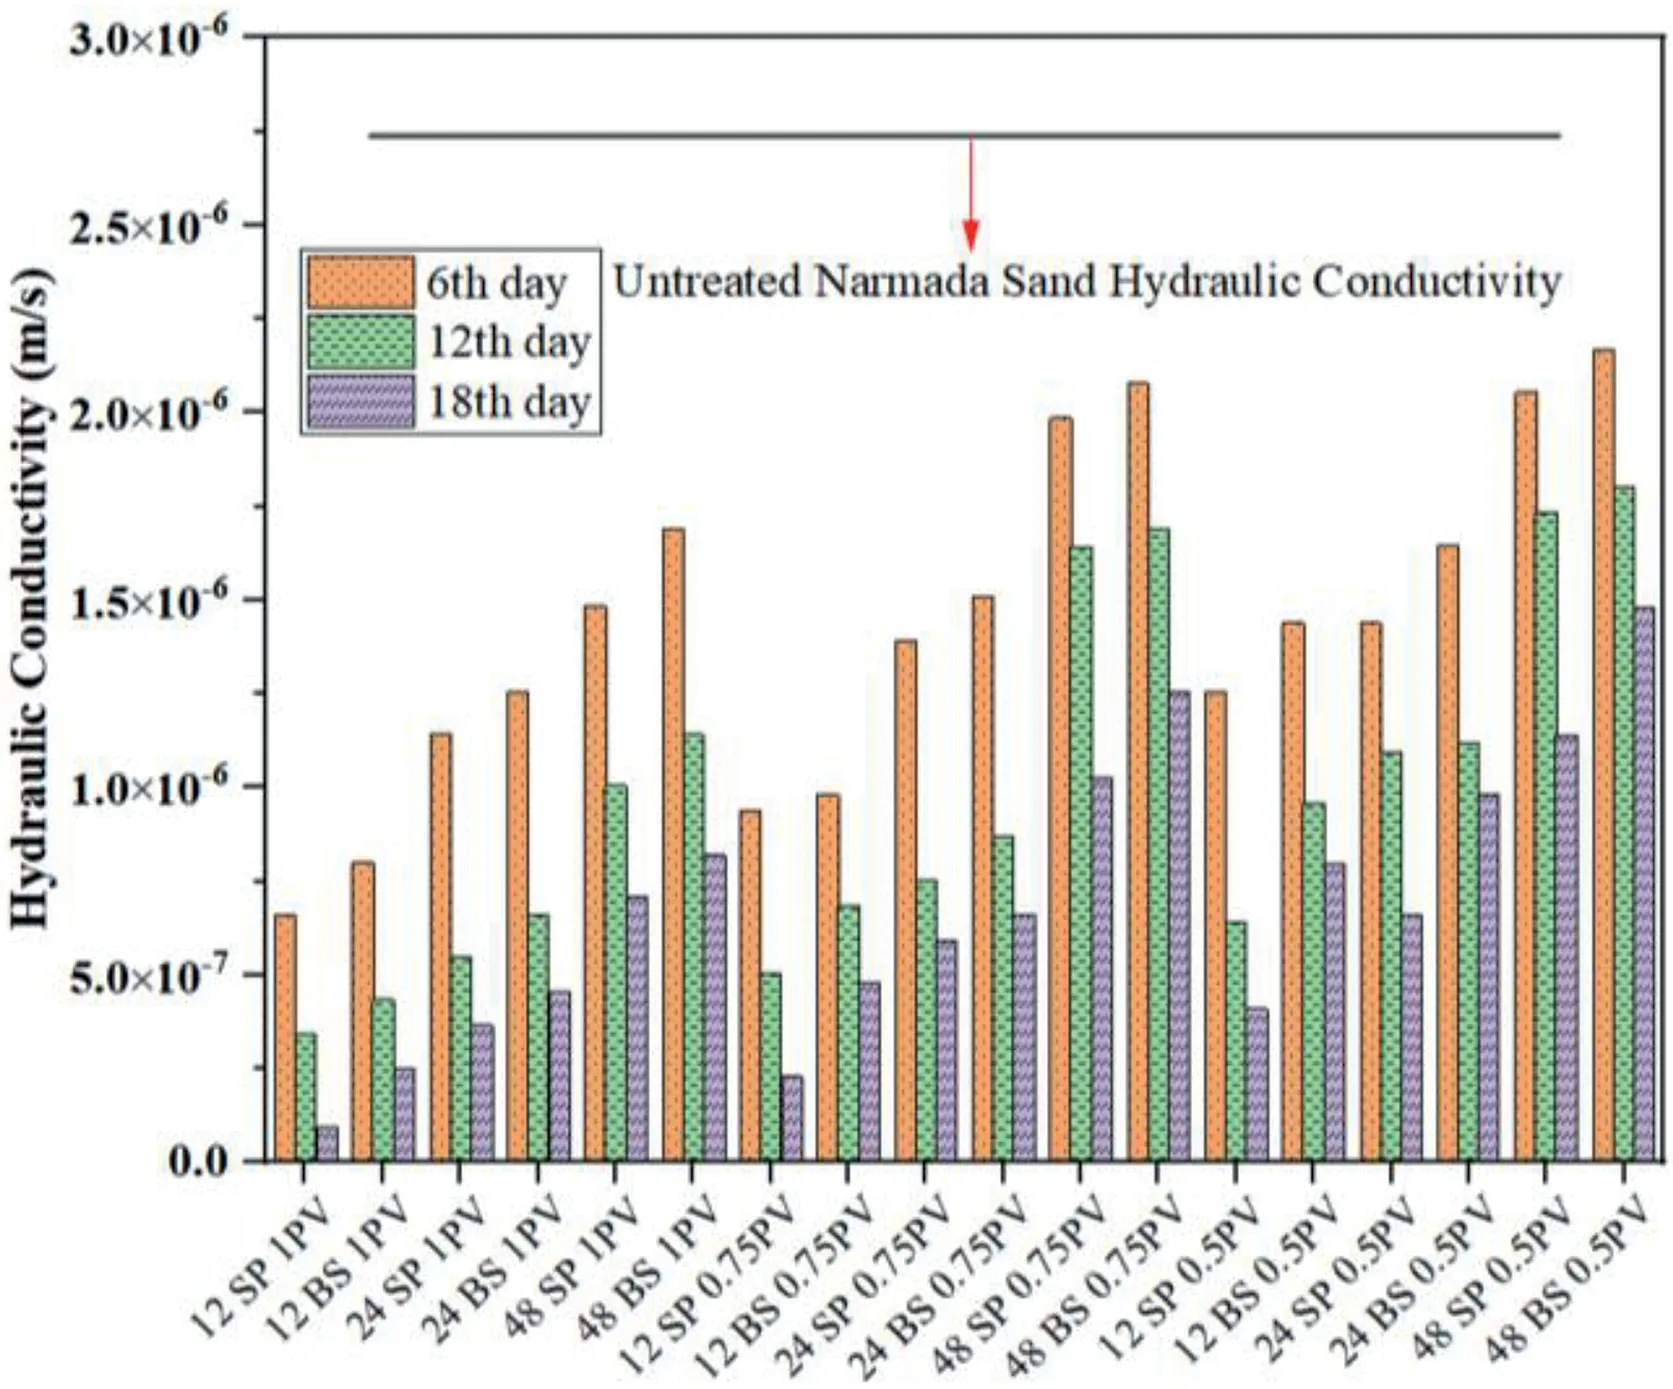
Fig.8.Comparison of hydraulic conductivity for untreated sand and different treatment durations of all sample combinations.
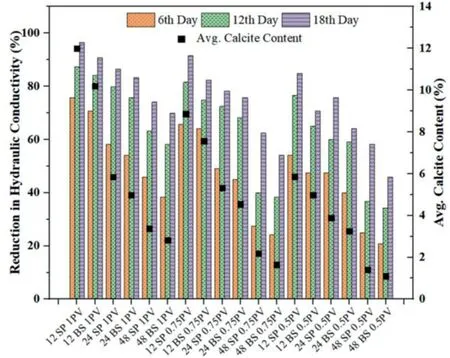
Fig.9.Reduction percentage in hydraulic conductivity with varying times of treatment and average calcite contents.
Fig.9 shows the reduction percentage in hydraulic conductivity with respect to untreated Narmada sand.The higher calcite content leads to a higher reduction in hydraulic conductivity.The average calcite content was maximum after 18 d of treatment in sample“12 SP 1 PV”,which shows a 96.6%reduction in hydraulic conductivity.The minimum decrease (45.8%) in hydraulic conductivity was found with a minimum amount of calcite precipitation in sample“48 BS 0.5 PV”.As mentioned in Table 2,the NEHRP site class A samples showed initial permeability reduction in the range of 55%-75%after 6 d of treatment,which is significant enough to mitigate the liquefaction hazard at the initial level of MICP treatment only.The rate of reduction in permeability decreased with time,as 75%-87% and up to 96% permeability reduction,after 12 d and 18 d of treatment,respectively,in class A samples.Class B samples showed permeability reduction of 40%-55%,up to 75%,and up to 83%,after 6 d,12 d,and 18 d of treatment,respectively.Class B samples treatment combinations can be used to achieve the economy in treatment.Classes C and D samples showed considerable permeability reduction,but treatment methodology can be avoided if higher strength and rock-like behaviors of soil are required.The reduction in hydraulic conductivity was found in line with the previous studies (Ivanov et al.,2010;Proto et al.,2016).Whiffin et al.(2007) mentioned the permeability reduction only up to 30% after the biocementation,with considerable improvement in strength.The less reduction in permeability was observed as the advantage of MICP method that allows more treatment injection for strength improvement,if needed,to increase liquefaction resistance.
Sharma et al.(2021a) elaborated the effect of calcite precipitation on hydraulic conductivity of soil.It was concluded that the wide range of permeability reduction,i.e.30%-99%,in various studies (Van Paassen,2009;Al Qabany and Soga,2013;Chu et al.,2013;Hoang et al.,2020) at similar calcite content might be possible due to the morphology and formation of calcite crystal.There are various factors which affect the biogeochemical reactions and crystal formation,including soil type,bacteria type for augmentation or stimulation,OD (optical density) of bacteria,cementation solution concentration,injection method (stoppedflow or continuous-flow),interval of every injection,total treatment duration,pH value,and environmental conditions,e.g.temperature (Zhao et al.,2014;Mahawish et al.,2018;Mujah et al.,2019).Hence,this study was carried out in non-sterile and environmentally uncontrolled conditions,so that the major factors affecting the calcite precipitation can be incorporated.Additionally,the effect on strength and liquefaction resistance improvement can be examined to apply this method on large-scale applications.The results show the successful application of the method in an uncontrolled field environment;hence the major challenges of MICP can be addressed using the proposed method in this study.
3.6.Effect of subsequent treatment cycle duration on the microstructure of sand
Fig.10 shows the SEM image of untreated Narmada sand at 600× magnification and 100 μm scale.The SEM image shows discrete sand grains,which require bonds for effective strength enhancement.Fig.11 shows the SEM images of samples treated with the two bacterial strains,one pore volume cementation media,and three different treatment cycles for simultaneous cementation media injections.The SEM analysis was carried out,focusing on different treatment cycles to find the changes in crystal growth and size.The images were taken at 5000 × magnification and 10 μm scale for comparison.
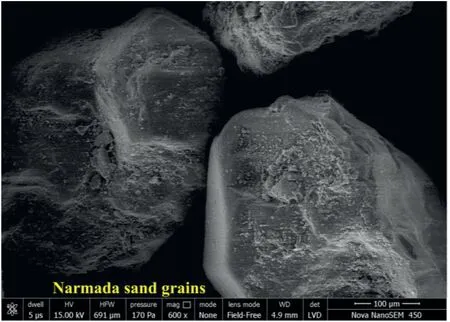
Fig.10.SEM image of untreated Narmada sand.
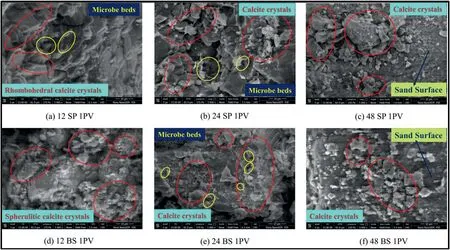
Fig.11.SEM images of biotreated samples with the two bacterial strains and one pore volume cementation solution in different treatment cycles.
Fig.11a and d clearly indicates the compact and larger size of crystals.Fig.11a shows more of rhombohedral crystal formation and Fig.11b shows the configuration of spherulitic crystals.This can be one of the reasons for the less strength of B.sphaericus treated samples.Comparisons between the biocemented samples of 12-h treatment cycle (Fig.11a and d) with 24-h (Fig.11b and e) and 48-h (Fig.11c and f) treatment cycles show the simultaneously smaller size of crystals.The reason behind the variation of crystal sizes is the duration of subsequent injections of cementation solutions.Fig.11a,b and e shows the presence of microbial beds in the form of hollow cylindrical spaces on the calcite surface;this confirms the formation of cell-Ca bond and functioning of the MICP method.
The growth of already formed crystal and the formation of a new crystal depend on the interaction of attached bacteria and cementation solution (Gandhi et al.,1995).The frequent cementation injections resulted in the growth of already precipitated crystals,which further led to formations of large-size crystal.On the other hand,increasing the time-lag in subsequent treatment cycles resulted in the formations of new crystals,which were relatively small in size.The less amount of calcite precipitation and smaller size of crystals resulted in lower strength of biocemented sand.
4.Conclusions
The present study was carried out under simulated typical field conditions (non-sterile with uncontrolled environment,e.g.temperature).Two urease producing bacteria,i.e.S pasteurii and B.sphaericus,were used as comparative studies of MICP on strength enhancement of the Narmada river (India) sand.The variables of different injection times (treatment cycle) (12 h,24 h,and 48 h),and pore volumes (1,0.75,and 0.5) of cementation media were considered to analyze the effect on mechanical strength improvement and reduction in hydraulic conductivity of sand.The shear wave velocity of the biocemented sample was determined using an UPV instrument.The shear wave velocity was measured to analyze the liquefaction resistance and rock-like behaviors of biocemented samples.The uniformity of calcite precipitation was examined by a three-layer calcite formation test.The conclusions of the study are drawn as follows:
(1) The bacterial variation showed higher strength in S.pasteurii treated samples than that in B.sphaericus treated ones.The winter temperature may have affected the spore-forming activity and urease production of B.sphaericus,which resulted in 31% less strength than that of S.pasteurii augmented samples.However,a significant strength improvement was observed in B.sphaericus treated samples,which shows the possibility of biostimulation if this strain is also present in the soil.No major effect of non-sterile and environmentally uncontrolled conditions was observed on treatment.A significant amount of calcite precipitation was found according to the treatment conditions.
(2) Shear failure in UCS samples and tensile failure in STS samples show the rock-like behaviors of biocemented sands.The relation between UCS and STS was also an important observation.The rock-like behaviors of biocemented samples was clearly observed through ultrasonic shear wave velocity results,which shows heavy cementation in almost all the samples.
(3) The treatment cycle of 12 h with one pore volume of cementation solution showed maximum strength and a higher percentage of calcite precipitation.Though,24-h treatment cycle and 0.5 pore volume cementation solution also resulted in significant improvements in strength and shear wave velocity,which can be used in large-scale testing for the practical and economical application with almost four-time reduced cost.
(4) The biocemented sand’s strength increased and hydraulic conductivity decreased with the decrease in treatment cycle time,increase in treatment duration with a higher pore volume of cementation solution.The continuous reduction in hydraulic conductivity was observed with the time and amount of calcite formation.
(5) The uniformity in calcite precipitation shows the effectiveness of the bacteria attachment approach,0.5 equimolar concentration of cementation solution,and stopped-flow injection method.The formation of crystals had a significant effect on the strength improvement of soil.
(6) The SEM analysis indicates the effect of the time-lags between subsequent treatment cycles.The increase in treatment cycle duration reduced the size of calcite crystals and calcite precipitation,which significantly decreased the strength of biocemented sand.
Overall,the study showed optimal conditions for the strength improvement and hydraulic conductivity reduction of Narmada sand.Additional studies on the effects of temperature and largescale testing are recommended to develop guidance on applying MICP in actual full-scale field.
Declaration of competing interest
The authors declare that they have no known competing financial interests or personal relationships that could have appeared to influence the work reported in this paper.
Acknowledgments
The authors gratefully thank and acknowledge the support of the Discipline of Biosciences and Biomedical Engineering,IIT Indore,for permitting the laboratory access and providing other facilities.
 Journal of Rock Mechanics and Geotechnical Engineering2021年3期
- Journal of Rock Mechanics and Geotechnical Engineering的其它文章
- Effects of oil contamination and bioremediation on geotechnical properties of highly plastic clayey soil
- Bearing capacity of surface circular footings on granular material under low gravity fields
- Effect of natural and synthetic fibers reinforcement on California bearing ratio and tensile strength of clay
- Engineering and microstructure properties of contaminated marine sediments solidified by high content of incinerated sewage sludge ash
- An improved specimen preparation method for marine shallow gasbearing sand sediments and its validations
- Modification of nanoparticles for the strength enhancing of cementstabilized dredged sludge
