Uncertainties of thermal boundaries and soil properties on permafrost table of frozen ground in Qinghai-Tibet Plateau
To Wng,Erxing Peng,Lijing Xi,Guoqing Zhou,Jinzhou Wng
a State Key Laboratory for Geomechanics and Deep Underground Engineering,School of Mechanics and Civil Engineering,China University of Mining and Technology,Xuzhou,221116,China
b State Key Laboratory of Frozen Soil Engineering,Northwest Institute of Eco-Environment and Resources,Chinese Academy of Sciences,Lanzhou,Gansu,730000,China
c School of Food Engineering,Ludong University,Yantai,264025,China
Keywords:Frozen soil Spatial variability Thermal boundary Soil properties Probabilistic permafrost table
ABSTRACT In the permafrost regions of the Qinghai-Tibet Plateau(QTP),the permafrost table has a significant effect on the stability of geotechnical engineering.The thermal boundaries and soil properties are the key factors affecting the permafrost table.Complex geological environments and human activities can lead to the uncertainties of thermal boundaries and soil properties.In this paper,an array of field experiments and Monte Carlo (MC) simulations of thermal boundaries and soil properties are carried out.The coefficient of variation (COV),scale of fluctuation (SOF),and autocorrelation distance (ACD) of uncertainties of thermal boundaries and soil properties are investigated.A stochastic analysis method of the probabilistic permafrost table is then proposed,and the statistical properties of permafrost table on the QTP are computed by self-compiled program.The proposed stochastic analysis method is verified with the calculated and measured temperature observations.According to the relationship between ACD and SOF for the five theoretical autocorrelation functions (ACFs),the effects of ACF,COV,and ACD of soil properties and the COV of thermal boundaries on the permafrost tables are analyzed.The results show that the effects of different ACFs of soil properties on the standard deviation (SD) of permafrost table depth are not obvious.The SD of permafrost table depth increases with time,and the larger the COVs of thermal boundaries and soil properties,the deeper the SD of permafrost table;the longer the ACD of soil properties,the shallower the SD of permafrost table.This study can provide a reference for the stability analysis of geotechnical engineering on the QTP considering the uncertainties of thermal boundaries and soil properties.
1.Introduction
Permafrost is a product of heat exchange between the atmosphere and lithosphere.In China,the area of permafrost is about 2.15×10⁶km2,which accounts for 22.3%of the country’s land area.The Qinghai-Tibet Plateau (QTP) is the largest permafrost area in China,with a frozen soil area of 1.47×10⁶km2,about 70%of China’s permafrost area (Tai et al.,2018;Zhang et al.,2020).The climate change is significant which affects the thermal boundary conditions at the underlying surface of the permafrost on the QTP.This can exacerbate the melting of permafrost(Zhang et al.,2018;Mu et al.,2020).In addition,the permafrost is very sensitive to temperature variation and the heat transfer occurs continuously in the frozen ground.The soil properties of the permafrost region affect its heat conduction process(Yu et al.,2016;Zhang et al.,2015).The thermal boundary and soil properties have a significant effect on the permafrost table of the QTP in Southwest China,and the permafrost degradation has a negative effect on the stability of geotechnical engineering.Therefore,the permafrost table of the QTP is very important for the design of geotechnical engineering.Understanding the dynamic evolution of the permafrost table is the key to solving this problem (Luo et al.,2018;Wang et al.,2019;Tai et al.,2020a).Traditional analysis of permafrost degradation is mainly focused on the deterministic temperature and permafrost table(e.g.Haeberli et al.,2017;Mao et al.,2019;Tai et al.,2020b).To ensure the correctness of the results,suitable parameter inputs are required.Unfortunately,previous deterministic analyses generally ignore the uncertainties of thermal boundaries and soil properties.
The thermal boundary is complex and many factors can cause a rise of temperature,e.g.population growth,air environmental pollution,ecological environment deterioration,land destruction,dwindled forest resources,acid rain harm,and water contamination (Jensen and Traeger,2014;Glenis et al.,2015;Farsi and Mahjouri,2019).The rise of temperature can lead to the uncertainty of thermal boundary conditions at the underlying surface of the permafrost on the QTP.Specifically,the annual mean temperature,annual temperature variation,and temperature rising rate are uncertain (Haasnoot et al.,2018;Peleg et al.,2019).Stochastic process(SP)method can be used to characterize the uncertainty of the thermal boundaries at the underlying surface by the coefficient of variation (COV) (Liu et al.,2007;Wang et al.,2018a).The statistical characteristics and variation characteristics of thermal boundary on the QTP need to be understood,and the effect of COV of thermal boundary on the permafrost table of the QTP should be evaluated.As the geomaterial performances are anisotropic,the thermodynamic properties usually show uncertainties(Bungenstab and Bicalho,2016;Lyd˙zba et al.,2017;Wang et al.,2020;Tang et al.,2019;Tang and Phoon,2020).Specifically,the distributions of pores,moisture,and defects in soils are dynamically changing,and the physicochemical process of soil between the atmosphere and lithosphere is very complicated.These complexities and uncertainties can lead to inherent correlation and variability of the soil properties (Wang et al.,2013;Hamrouni et al.,2018;Contreras and Brown,2019;Siacara et al.,2020).Generally,permafrost is formed in a long-term air-cooled environment.Its soil properties are closely related to the pore distribution,water content,pore size,salt content,compactness,load history,temperature,and other factors (Liu et al.,2014;Li et al.,2019a,b).Random field (RF) method can then be used to characterize the spatial variability of frozen soil properties by autocorrelation function(ACF),COV,and autocorrelation distance (ACD) in the permafrost regions of QTP (Liu et al.,2017;Wang et al.,2018b).However,the variation characteristics of the permafrost regions of QTP should be well understood,in addition to the effects of ACF,COV and ACD of permafrost’s soil properties on the permafrost table of the QTP.Therefore,evaluating the effects of the uncertainties of thermal boundary and soil properties on permafrost table of the QTP is critically important.
In this study,an array of field experiments and Monte Carlo(MC)simulations of the thermal boundary and soil properties are carried out,and associated statistical characteristics are obtained.The COV,scale of fluctuation (SOF),and ACD of uncertainties of thermal boundaries and soil properties are also investigated.The uncertainties of thermal boundaries at the underlying surface of the permafrost on the QTP are considered as the SPs,and the spatial variations of permafrost’s soil properties are considered as the RFs.Then,a stochastic analysis method of permafrost table with thermal boundary model and heat conduction process is proposed,and the statistical properties of permafrost table of the QTP are computed by self-compiled program.Finally,the effects of the ACF,COV,and ACD of soil properties and the COV of thermal boundary on the probabilistic permafrost tables are analyzed.
2.Uncertainties of thermal boundaries and soil properties
2.1.Statistical characteristics of thermal boundaries
In addition to solar radiation,the thermal boundaries are also affected by air convection heat transfer,evaporation heat transfer,long wave radiation,phase transformation heat,and other factors(Chou et al.,2012;Hu et al.,2017).Based on the field monitoring data of climate change parameters on the QTP (Qin,2002;Niu et al.,2008),the annual mean temperatures and annual temperature variations of three different sampling points(areas I,II,and III) near the south of Kaixinling on the QTP were represented by MC simulation.Fig.1 shows the thermal boundaries of three different sampling points in the permafrost region of the QTP.Fig.1a-c shows the varied annual mean temperatures of areas I,II,III.The maximum annual mean temperatures of three areas are-3°C,-3.2°C,and-2.8°C,respectively.The minimum annual mean temperatures of three areas are-5.1°C,-5°C,and-5.1°C,respectively.Fig.1d-f shows the varied annual temperature variations of areas I,II,III.The maximum annual temperature variations of three areas are -10.6°C,-10.4°C,and -10.5°C,respectively.The minimum of annual temperature variations of three areas are -12.8°C,-12.8°C,and -12.7°C,respectively.These results reflect the uncertainties of atmospheric environments.Table 1 shows the statistical characteristics of thermal boundaries of three different sampling points in the permafrost region of the QTP.The annual mean temperatures of the three areas are -4.07°C,-4.06°C,and -4.07°C,respectively,and the standard deviations (SDs) are 0.44°C,0.37°C,and 0.41°C,respectively,with the maximum COV of 0.11.The means of the annual temperature variations of the three areas are-11.46°C,-11.57°C,and-11.57°C,respectively,with the SDs of 0.89°C,1.02°C,and 0.85°C,respectively.The maximum COV of annual temperature variations is 0.09.The skewness values of annual mean temperatures and annual temperature variations are not zero,suggesting that the statistical data distributions are asymmetric.The kurtosis characterizes the height of the peak probability density distribution curve at the mean values.
2.2.Statistical characteristics of soil properties
The thermal conductivity,heat capacity,and thermal diffusivity are the three main thermal parameters for the heat conduction process of permafrost.To evaluate the variation characteristics of permafrost,soil samples were sampled along the vertical direction near the south of Kaixinling on QTP.First,the permafrost grounds were drilled by a drilling machine and the vertical sampling depths were recorded.Then the frozen soil samples were covered by plastic wraps in order to prevent moisture loss.After that,the frozen soil samples were stored in the freezer.The sampling interval was 1 m and 30 soil samples were collected in each group.Areas I,II,and III were selected and three groups of soil samples were obtained.The heat conduction parameters of the soil samples were measured by the Hot Disk(Shanghai,China) thermal hazard technology.Table 2 shows the thermal properties of frozen and unfrozen grounds in a permafrost region of the QTP.The statistical characteristics of soil properties of the frozen and unfrozen grounds are shown in Fig.A1(see Appendix).From Fig.A1,it can be seen that the means of thermal conductivity,heat capacity,and thermal diffusivity in frozen state are 1.723 W/(m°C),1.858 × 106J/(m3°C),and 0.933×10⁻⁶m2/s,respectively.The COVs of thermal conductivity of three different heat transfer parameters in frozen state are 0.068,0.076,and 0.103,respectively.The means of thermal conductivity,heat capacity,and thermal diffusivity in unfrozen state are 1.36 W/(m°C),2.152 ×106J/(m3°C),and 0.635 ×10⁻⁶m2/s,respectively.The COVs of thermal conductivity of three different heat transfer parameters in unfrozen state are 0.08,0.074,and 0.102,respectively.There is a marked difference between frozen and unfrozen states.
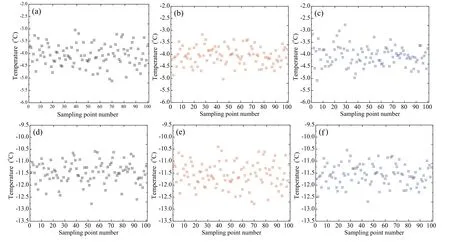
Fig.1.Thermal boundaries in a permafrost region of the QTP:(a)Annual mean temperatures of area I;(b) Annual mean temperatures of area II;(c)Annual mean temperatures of area III;(d) Annual temperature variations of area I;(e) Annual temperature variations of area II;and (f) Annual temperature variations of area III.
2.3.Variation characteristics of thermal boundary and soil properties
The COV is mainly used to character the dispersion degrees of different sampling data.A large COV generally means a large dispersion degree of the data.The COV of thermal boundary and soil properties can eliminate the influence of different units when comparing the variability of statistical data.According to the statistical characteristics of thermal boundary and soil properties of permafrost on the QTP,the COVs of the thermal boundaries and soil properties can be obtained.Table 3 lists the COV values of thermal boundaries and soil properties in the permafrost region of the QTP.Fig.2a and d shows the discrete distribution and statistical characteristics of COV.The average,maximum,and minimum values of COV are 0.143,0.235,and 0.068,respectively.Hence,we can conclude that the COVs of thermal boundaries and soil properties in the permafrost region fluctuate between 0.05 and 0.25.The ACD and ACF can reveal the spatial variability of the permafrost on the QTP.Previous studies reported that the spatial variability of uncertain thermal conduction parameter of frozen soil can be assessed by stable point of variance function (Wang et al.,2018b).This study calculated the SOF of soil properties of permafrost on the QTP.Fig.2b and e shows the discrete distribution and statistical characteristics of SOF.The average,maximum,and minimum values of SOF are 1.452 m,2.126 m,and 0.772 m,respectively.The SOF of soil properties in the permafrost region ranges between 0.6 m and 2.2 m.Five commonly used two-dimensional (2D) ACFs were 2D squared exponential(2D SQX),2D single exponential(2D SNX),2D second-order Markov (2D SMK),2D cosine exponential(2D CSX),and 2D binary noise(2D BIN)(Li et al.,2015).The 2D ACFs for characterizing the spatial variability of soil properties are listed in Table A1 in Appendix.Based on the relationship between ACD and SOF for different 2D ACFs,the ACD can be obtained from the results of SOF.Fig.2c and f shows the discrete distribution and statistical characteristics of ACD when the 2D ACF of soil properties is 2D SQX.The average,maximum,and minimum values of ACD are 0.819 m,1.199 m,and 0.436 m,respectively.Hence,it can be concluded that the ACD of soil properties in the permafrost region fluctuates between 0.4 m and 1.2 m.From Fig.2,it can be seen the thermal boundaries and soil properties are uncertain,thus the stochastic analysis can be used to investigate the probabilistic permafrost table of the QTP.These actual statistical data of thermal boundary and soil properties are the basis of stochastic analysis method.
3.Stochastic analysis method of permafrost table
3.1.Thermal boundary model of climate change
The QTP is one of the regions with the utmost solar radiation on earth because of its low latitude and high altitude.The permafrost on the QTP has the characteristics of high annual average ground temperature,thin frozen soil layer,and unstable soil structure.The energy balance analysis shows that the thermal boundary at the underlying surface of the permafrost on the QTP is a mixed condition.Radiation,convection,evaporation,and surface condition can affect the thermal boundary(Xia et al.,2015;Zhang et al.,2019).The boundary layer theory can be used to calculate the empirical temperature values between the surface and the local air temperatures based on measured data of Wudaoliang area.The permafrost grounds on the QTP have different thermal boundaries because of different surface conditions,latitudes,and longitudes (Luo et al.,2019).The thermal boundary at the underlying surface on the QTP can be expressed as

Table 1Statistical characteristics of thermal boundary in a permafrost region of the QTP.

Table 2Soil properties of frozen and unfrozen grounds in a permafrost region of the QTP.

where Asufis the annual mean temperature at the underlying surface(°C),Bsufis the annual temperature variation at the underlying surface (°C),Csufis the temperature rising rate at the underlying surface(°C/50 a),this the time(h),and φsufis the initial phase at the underlying surface (rad).
According to the field monitoring data of climate change on the QTP and the regression analysis method(Qin,2002;Xia,2015),the annual mean temperature,annual temperature variation,and initial phase at the underlying surface on the QTP can be expressed as
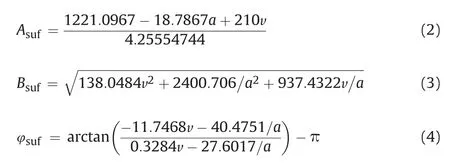
where v and a are the conversion factors at the underlying surface and the permafrost region,respectively.
The conversion factor v is closely related to the type of underlying surface.On the QTP,the conversion factor of the block surface measured in the Beiluhe is 0.101;the conversion factor of the sand surface measured in the Wuli is 0.155;the conversion factor of the gravel surface measured in the Kaixinling is 0.121;and the conversion factor of the asphalt pavement measured in the Huashixia is 0.181(Xia et al.,2015).The correction factor a can be expressed as

where H0is the mean atmospheric thickness(m),H is the altitude of the underlying surface(m),and θ is the latitude of the underlying surface (°).
3.2.Heat conduction process of permafrost
The permafrost is mainly composed of solid mineral particles,water,ice,and air.The distributions of pore,moisture,and defect in the soil are dynamically changing.This can cause significant changes in permafrost,and it can change the structure of the permafrost ground.Hence,the heat transfer parameters of permafrost are varied.Based on the method of uncertain thermal analysis with heat conduction and phase transition(Liu et al.,2014;Wang et al.,2018a),the uncertain heat conduction process of permafrost can be expressed as
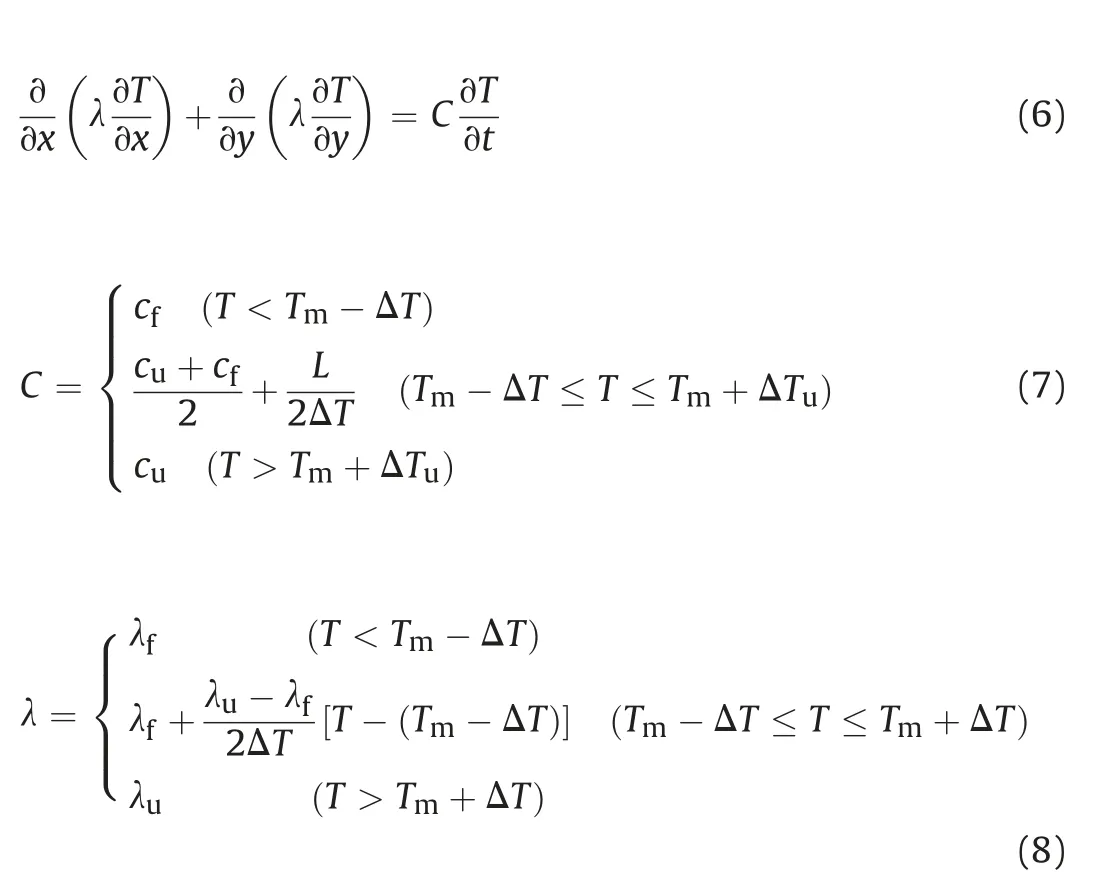
where λfand λuare the thermal conductivities in frozen and unfrozen states,respectively (W/(m°C));cfand cuare the heat capacity in frozen and unfrozen states,respectively (J/(m3°C));L is the latent heat(J/m3);and Tmand ΔT are the mean temperature and interval temperature,respectively,when the phase change occurs in frozen ground(°C);λ is the thermal conductivities(W/(m°C));C is the heat capacity (J/(m3°C));T is the temperature (°C).

Table 3The COV values of thermal boundary and soil properties in the permafrost region of the QTP.
3.3.Stochastic methodology
As the annual mean temperature,annual temperature variation,and temperature rising rate are varied,the SP method can be used to characterize the uncertainty of the thermal boundary at the underlying surface (Liu et al.,2007,2014;Wang et al.,2018a).The above-mentioned three parameters can be considered as three random variables.The thermal boundary conditions at the underlying surface of the permafrost on the QTP can be considered as one SP.The key parameter is the COV of thermal boundary.The spatial variability of soil properties can cause the uncertain heat conduction process.The spatial autocorrelation and crosscorrelation variations are the key characteristics of varying soil properties.The RF methodology can be used to characterize the spatial variability of soil properties of permafrost with ACF,COV,and ACD.The RF model can reflect the spatial autocorrelation and crosscorrelation variations,and it is an effective method to describe the uncertain soil properties (Vanmarcke,2010).In this study,the thermal parameters of permafrost are considered as 2D RFs.According to the local average(LA) theory,the 2D LA RF can be defined as

where Xerepresents the 2D LA RF,Aerepresents the area of e(m2),Ωerepresents the integral area of e (m2),e represent the 2D RF element,x is abscissa of e;and y is ordinate of e.
From Eq.(9),the covariance of two 2D LA RFs can be written as

where ρ(τ)represents the ACF of original 2D RF,Xe′ is the another 2D RF element,Ae′is the area of e′,A is the differential area of e,A′is the differential area of e′,x′is abscissa of e′,y′is ordinate of e′,σ is the standard deviation of original 2D RF,Ωe′is the integral domain.
Based on coordinate transformation,the covariance of two 2D LA RFs can be computed(see Appendix).The COVs of annual mean temperature,annual temperature variation,and temperature rising rate are the key parameters for characterizing the uncertain thermal boundary.The ACF,COV,and ACD of thermal conductivity,heat capacity,and thermal diffusivity are the key parameters for characterizing the changing soil properties of permafrost.The above stochastic methodology shows that the statistical properties of the original RF can be calculated by Eq.(A6).Then the 2D LA RF element can be generated,and the permafrost table of the QTP can be analyzed by iterative approach (Wang et al.,2018a).MATLAB 7.0 was used to program the stochastic analysis process of permafrost table in this study.The mean and SD values of probabilistic permafrost table of the QTP can be directly output by self-compiled program.
4.Results
4.1.Verification of stochastic analysis method
According to the geological data and satellite remote sensing data of the QTP,the latitude,longitude,and the type of underlying surface along the Qinghai-Tibet highway are first obtained (Qin,2002;Xia,2015).Then the measured and calculated data of annual mean temperatures and annual temperature variations of the underlying surface along the Qinghai-Tibet highway can be assessed.Fig.3 shows the comparison between the calculated and measured temperatures on the QTP.From Fig.3a,the measured temperatures along Qinghai-Tibet highway agree well with the calculated results.The largest difference of the annual average temperature between measured and calculated data is about 0.8°C,at the stake 2996 km along Qinghai-Tibet highway.From Fig.3b,it is obvious that the measured temperatures of the three sampling areas agree well with the calculated results.The largest difference of the temperature at different underlying surfaces between measured and calculated data is about 1.7°C (on April).The field data of permafrost ground had been measured by temperature sensors (Mu,2012).Fig.4 shows the comparison between the calculated and measured temperatures in the permafrost region of the QTP.From the results of the temperature distribution of Beiluhe under natural ground surface (see Fig.4a),it is apparent that the measured temperatures on 15 July and 15 October in 2009 along the vertical direction agree well with the calculated ones.The largest difference between measured and calculated data is about 0.5°C at the depth of 2.7 m under natural ground surface.From the results of the temperature distribution of Kaixinling under natural ground surface (see Fig.4b),it shows that the measured temperatures on 15 July and 15 October in 2009 along the vertical direction agree well with the calculated temperatures.The largest difference between measured and calculated data is 0.6°C at the depth of 3.8 m under natural ground surface.The comparisons show that the stochastic analysis method of permafrost table established in this paper is reasonable.However,the uncertainties of heat conduction,moisture movement,and deformation of permafrost interact and restrict each other.The stochastic coupling analysis method to characterize the uncertainties of the heat conduction,moisture movement,and deformation of permafrost needs to be developed.Further studies need to focus on the mesomechanics and microstatistical distribution test of random water movement,frost heaving,and ice-water phase transition during permafrost degradation process.The deterministic analysis method of permafrost can provide a reference for developing the stochastic coupling analysis method(Lai et al.,2014;Li et al.,2018;Tounsi et al.,2020).
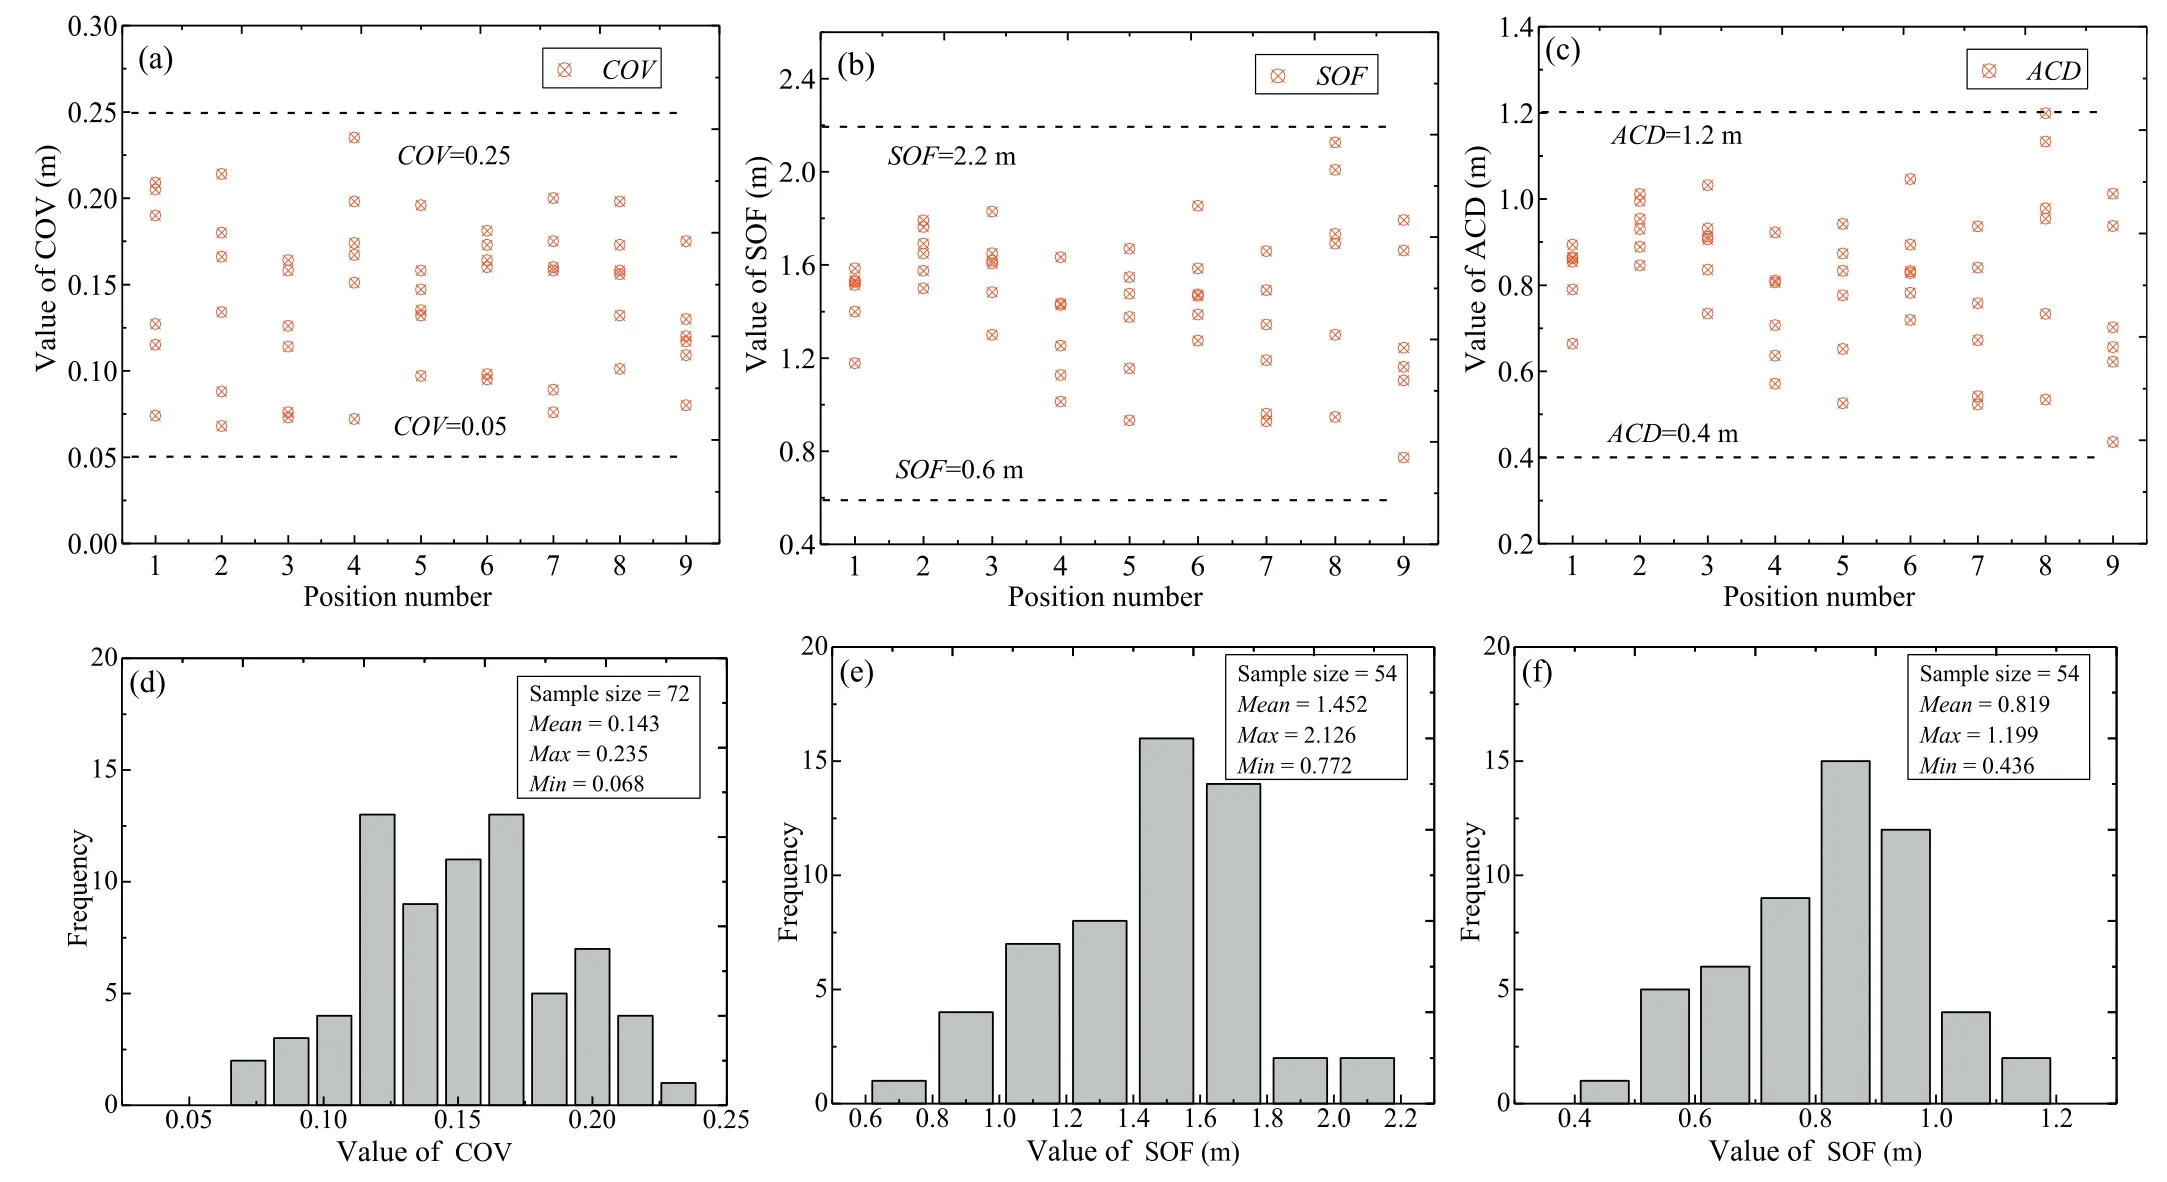
Fig.2.Variation characteristics of thermal boundary and soil properties in the permafrost region:(a) Discrete distribution of COV;(b) Discrete distribution of SOF;(c) Discrete distribution of ACD;(d) Statistical characteristics of COV;(e) Statistical characteristics of SOF;and (f) Statistical characteristics of ACD.
4.2.Statistical properties of permafrost table
The depth of permafrost table is very important for thermal analysis of permafrost engineering on QTP.The upper layer of permafrost table is the active layer that thaws in summer and freezes in winter.The lower layer of permafrost table is a yearround frozen layer.The permafrost table depth of QTP is stochastic due to the uncertainties of thermal boundaries and soil properties.Fig.5 shows the statistical properties of permafrost table depth in the permafrost region of the QTP.From the results of the Beiluhe (see Fig.5a),it is clear that the permafrost table depth is discrete and its increasing trend with time is obvious.The average permafrost table depth in Beiluhe is about 1.5 m under natural ground surface in the beginning.After 50 years,the average permafrost table depth is about 2.42 m under natural ground surface.The average increasing rate of permafrost table depth in Beiluhe is about 1.84 cm/a.The 5th percentile curve shows that the average permafrost table depth in Beiluhe is about 1.26 m under natural ground surface in the beginning.After 50 years,the average permafrost table depth is about 2.18 m under natural ground surface.From the results of the Kaixinling(see Fig.5b),the permafrost table depth is also discrete and its increasing trend with time is more obvious.The average permafrost table depth in Kaixinling is about 1.48 m under natural ground surface in the beginning.After 50 years,the average permafrost table depth is about 2.67 m under natural ground surface.The average increasing rate of permafrost table depth in Kaixinling is about 2.38 cm/a.The 5th percentile curve shows that the average permafrost table depth in Kaixinling is about 1.24 m under natural ground surface in the beginning.After 50 years,the average permafrost table depth is about 2.43 m under natural ground surface.These results demonstrate the statistical properties of permafrost table depth on the QTP.However,the thermal boundary at the underlying surface on the QTP was simplified as a function of the latitude,longitude,and type of ground surface.This is a limit in the present study.
4.3.Effect of soil properties’ ACF on permafrost table
Different ACFs of soil properties may affect the evolution process of the permafrost table.There are five commonly-used 2D ACFs(see Appendix),but it is difficult to determine which 2D ACF is reasonable.We attempt to clarify the effects of 2D ACFs of soil properties on the permafrost table of the QTP in this section.Table 4 shows the actual spatial variability of soil properties along the vertical direction near the south of Kaixinling on QTP.The different combinations of ACFs are shown in Table A2 in Appendix.The effects of different ACFs of soil properties on the permafrost table of the QTP can be assessed by above stochastic analysis method.Fig.6 shows the effects of different ACFs of soil properties on the SD of permafrost table depth.From Fig.6a,it can be seen that the different effects of five 2D ACFs of thermal conductivity on the SD of permafrost table depth are not obvious,and the largest difference of the SD of permafrost table depth is only 2.2 cm.The SD increases with the time,and the average SD of permafrost table depth is about 0.18 m under natural ground surface in the beginning and increases to 0.29 m after 50 years.From Fig.6b,the differences of the effects of five 2D ACFs of heat capacity on the SD are not obvious.The largest difference of SD is only 1.8 cm.The average SD is about 0.15 m under natural ground surface in the beginning and increases to about 0.24 m after 50 years.From Fig.6c,the differences of the effects of five 2D ACFs of thermal diffusivity on the SD of permafrost table depth are also not obvious,and the largest difference of the SD is only 1.6 cm.The SD increases with the time,and the average SD is about 0.16 m under natural ground surface in the beginning and increases to about 0.26 m after 50 years.These results demonstrate the differences of the effects of 2D ACF of soil properties on the permafrost table of the QTP.
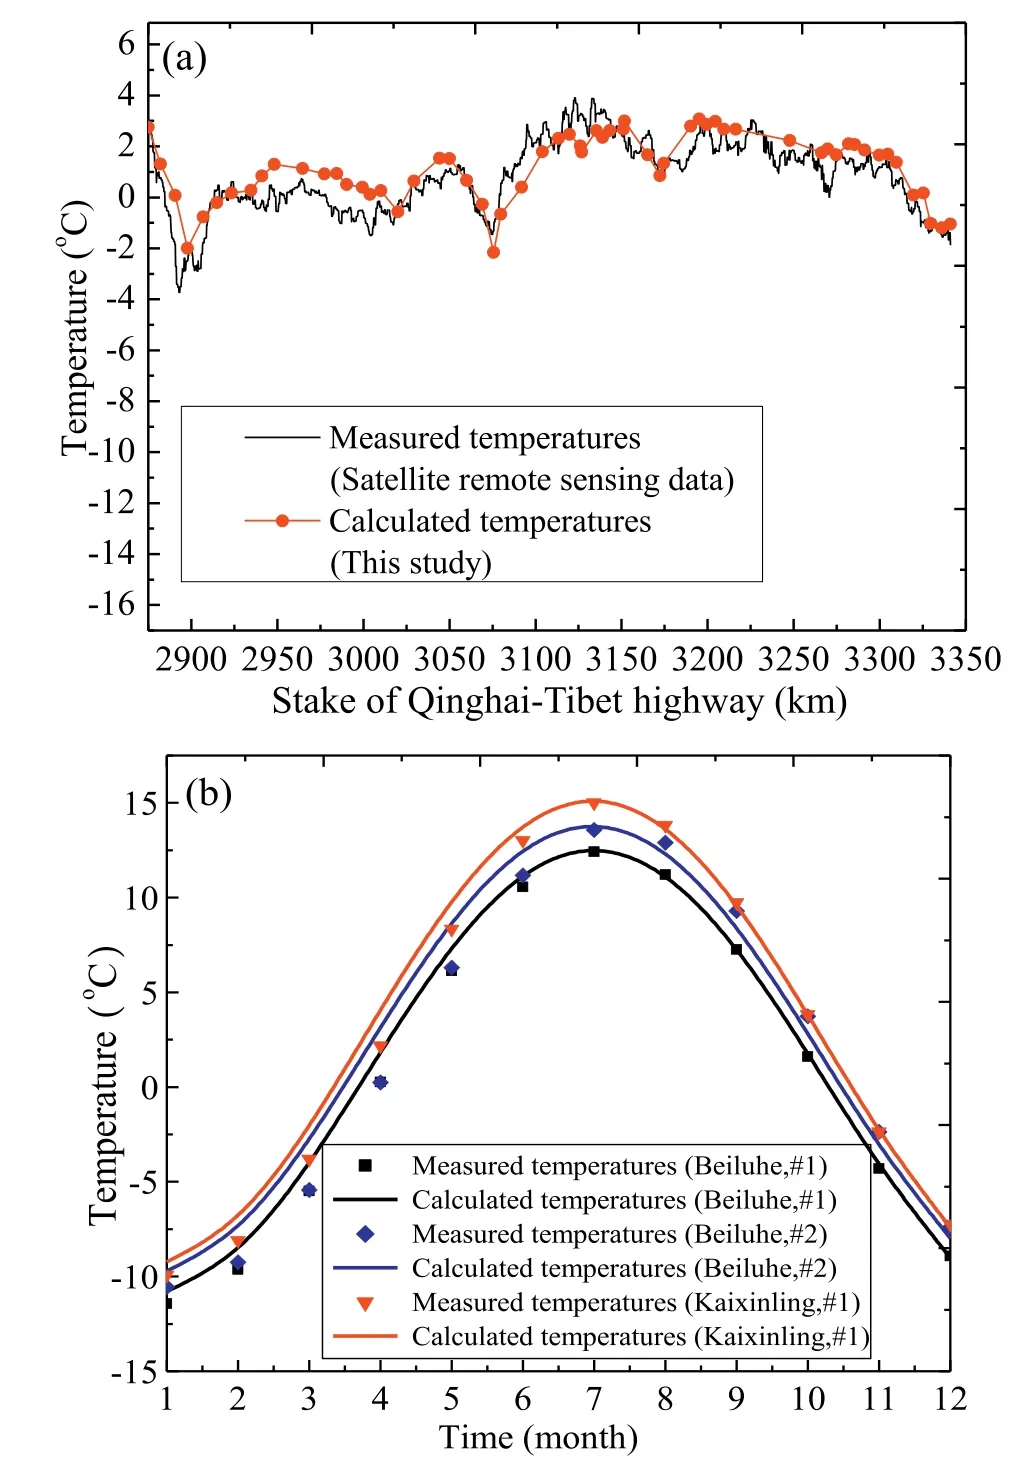
Fig.3.Comparison between calculated and measured temperatures on the QTP:(a)Annual average temperatures along Qinghai-Tibet highway;and (b) Temperatures of different underlying surfaces.
4.4.Effect of soil properties’ COV on permafrost table
The COV of soil properties can reflect the discrete characteristics of uncertainties of thermal conduction parameters.The statistical data show that the COV of thermal conduction parameters of soil properties in the permafrost region fluctuates between 0.05 and 0.25.The different combinations of COV are shown in Table A3 in Appendix.The reference case of COV of thermal parameters can be obtained from the variation characteristics of soil properties near the south of Kaixinling on QTP.Fig.7 shows the effects of different COV values of soil properties on the SD of permafrost table depth.From Fig.7a,it displays that when the values of thermal conductivity’s COV are 0.25,0.15,and 0.05,the maximum SDs of permafrost table depth are 0.35 m,0.25 m,and 0.15 m,respectively,while the minimum SDs are 0.21 m,0.16 m,and 0.08 m,respectively.When the values of thermal conductivity’s COV are 0.2 and 0.1,the increasing rates of the SD are about 0.23 cm/a and 0.17 cm/a,respectively.Fig.7b shows that when the values of heat capacity’s COV are 0.25,0.15,and 0.05,the maximum SDs of permafrost table depth are 0.29 m,0.24 m,and 0.21 m,respectively,while the minimum SDs are 0.18 m,0.14 m,and 0.12 m,respectively.The SD increases with the time.When the values of heat capacity’s COV are 0.2 and 0.1,the increasing rates of the SD are about 0.2 cm/a and 0.15 cm/a,respectively.It can be seen from Fig.7c that when the values of thermal diffusivity’s COV are 0.25,0.15,and 0.05,the maximum SDs are 0.32 m,0.25 m,and 0.18 m,respectively;while the minimum SD are 0.19 m,0.14 m,and 0.1 m,respectively.When the thermal diffusivity’s COV are 0.2 and 0.1,the increasing rates of the SD are about 0.21 cm/a and 0.16 cm/a,respectively.It is apparent that the larger the COV value of soil properties,the larger the SD of permafrost table depth.These results demonstrate the different effects of COV of soil properties on the permafrost table of the QTP.
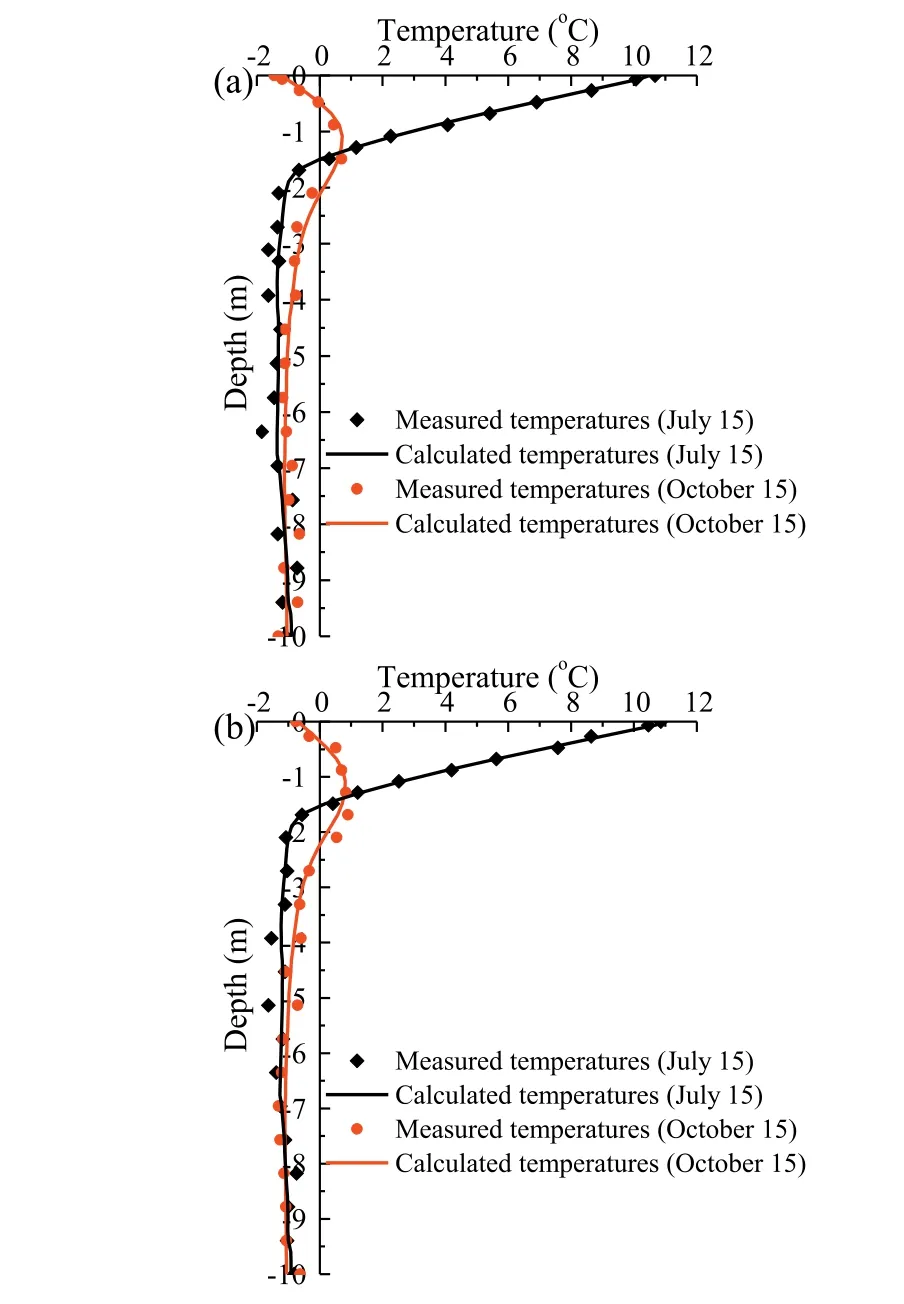
Fig.4.Comparison between the calculated and measured temperatures in the permafrost region of the QTP:(a) Temperature distribution of Beiluhe under natural ground surface;and (b) Temperature distribution of Kaixinling under natural ground surface.
4.5.Effect of soil properties’ ACD on permafrost table
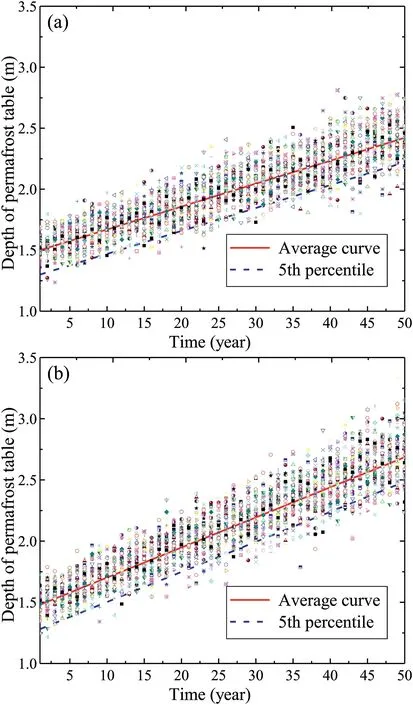
Fig.5.Statistical properties of permafrost table depth in(a)Beiluhe and(b)Kaixinling under natural ground surface.
Table A1 shows that the ACD of soil properties is a key parameter of ACF and it can indirectly affect the spatial variability of thermal conduction parameters and uncertain thermal process of permafrost ground on the QTP.The reference case of ACD of thermal conduction parameters can be obtained from the variation characteristics of soil properties near the south of Kaixinling on the QTP.Fig.2c and f shows the discrete distribution and statistical characteristics of ACD.The statistical data show that the ACD of thermal conduction parameter in the permafrost region ranges between 0.4 m and 1.2 m.The different combinations of ACD are shown in Table A4 in Appendix.Fig.8 shows the effects of different ACDs of soil properties on the SDs of permafrost table depth.It can be seen from Fig.8a that when the ACDs of thermal conductivity are 1.2 m,0.8 m,and 0.4 m,the maximum SDs of permafrost table depth are 0.32 m,0.3 m,and 0.25 m,respectively,while the minimum SDs are 0.2 m,0.18 m,and 0.16 m,respectively.When the ACDs of thermal conductivity are 1 m and 0.6 m,the increasing rates of the SD are about 0.22 cm/a and 0.21 cm/a,respectively.Fig.8b illustrates that when the ACDs of heat capacity are 1.2 m,0.8 m,and 0.4 m,the maximum SDs are 0.31 m,0.3 m,and 0.28 m,respectively,while the minimum SDs of permafrost table are 0.19 m,0.18 m,and 0.17 m,respectively.The SD of permafrost table depth increases with the time.When the ACDs of heat capacity are 1 m and 0.6 m,the increasing rates of the SD are about 0.24 cm/a and 0.21 cm/a,respectively.Fig.8c shows that when the ACDs of thermal diffusivity are 1.2 m,0.8 m,and 0.4 m,the maximum SDs are 0.31 m,0.29 m,and 0.27 m,respectively,while the minimum SDs are 0.19 m,0.18 m,and 0.16 m,respectively.When the ACDs of thermal diffusivity are 1 m and 0.6 m,the increasing rates of the SD are about 0.23 cm/a and 0.2 cm/a,respectively.It is obvious that thelonger the ACD of soil properties,the smaller the SD of permafrost table depth.The results show the different effects of ACD of soil properties on the permafrost table of the QTP.
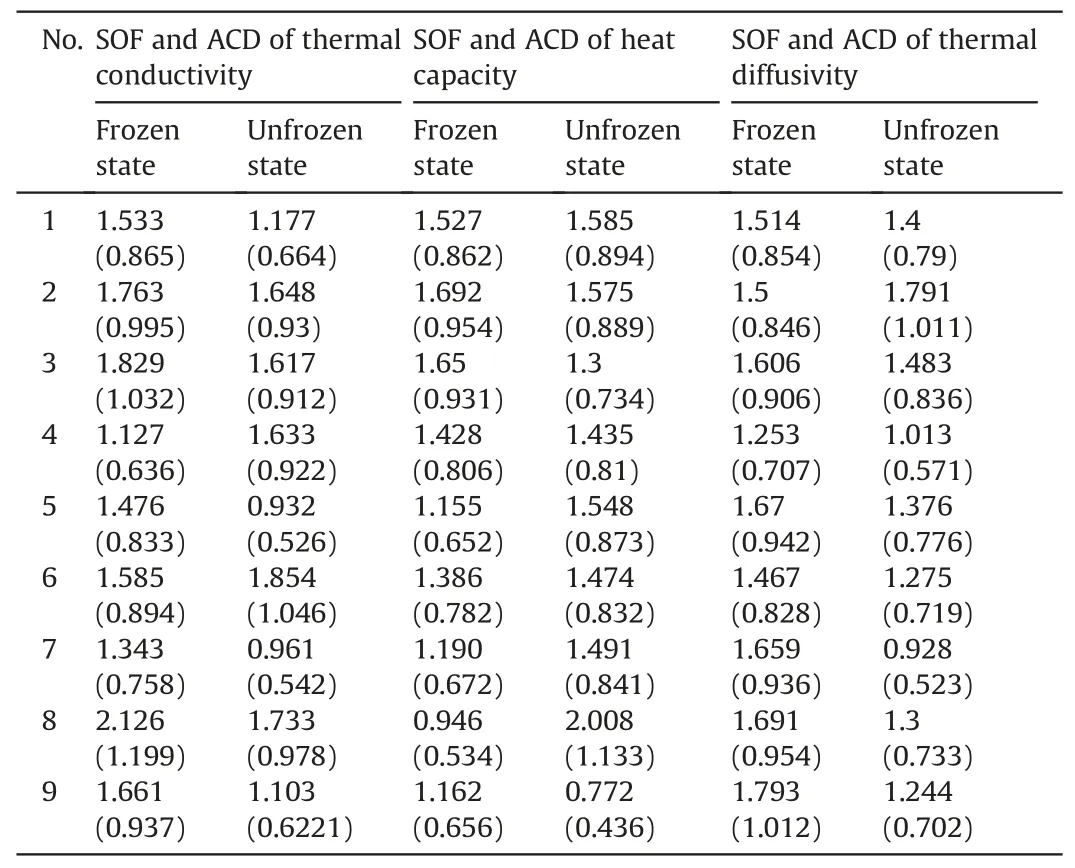
Table 4Spatial variability of soil properties in the permafrost region of the QTP.
4.6.Effect of thermal boundary’ COV on permafrost table
The COV of thermal boundary can reflect the discrete characteristics of thermal boundary at the underlying surface on the QTP.The statistical data show that the COV of thermal boundary parameters in the permafrost region fluctuates between 0.05 and 0.25.The different combinations of COV are shown in Table A5 in Appendix.The reference case of COV can be obtained from the variation characteristics of thermal boundary near the south of Kaixinling on QTP.Fig.9 shows the effects of different COV values of thermal boundary on the SD of permafrost table depth.From Fig.9a,when the COV values of annual mean temperature are 0.25,0.15,and 0.05,the maximum SDs of permafrost table depth are 0.34 m,0.29 m,and 0.26 m,respectively,while the minimum SDs of permafrost table depth of the QTP are 0.2 m,0.18 m,and 0.14 m,respectively.Taking the COV values of annual mean temperature at 0.2 and 0.1 as an example,the corresponding increasing rates of the SD are about 0.24 cm/a and 0.21 cm/a,respectively.From Fig.9b,it can be seen that when the COV values of annual temperature variation are 0.25,0.15,and 0.05,the maximum SDs are 0.39 m,0.29 m,and 0.21 m,respectively,while the minimum SDs are 0.24 m,0.18 m,and 0.13 m,respectively.The SD of permafrost table depth increases with the time.Taking the COV values of annual variation temperature at 0.2 and 0.1 as an example,the increasing rates of the SD are about 0.27 cm/a and 0.17 cm/a,respectively.Fig.9c suggests that when the COV values of temperature rising rate are 0.25,0.15,and 0.05,the maximum SDs are 0.36 m,0.30 m,and 0.23 m,respectively,while the minimum SDs are 0.22 m,0.18 m,and 0.13 m,respectively.Taking the COV values of temperature rising rate at 0.2 and 0.1 as an example,the increasing rates of the SD are about 0.24 cm/a and 0.19 cm/a,respectively.It illustrates that the larger the COV of thermal boundary,the larger the SD of permafrost table depth.These results demonstrate the different effects of COV of thermal boundary on the permafrost table of the QTP.

Fig.6.Effects of different ACFs of soil properties on SD of permafrost table depth:(a) Thermal conductivity;(b) Heat capacity;and (c) Thermal diffusivity.

Fig.7.Effects of different values of COV of soil properties on SD of permafrost table depth:(a) Thermal conductivity;(b) Heat capacity;and (c) Thermal diffusivity.

Fig.8.Effects of different ACDs of soil properties on SD of permafrost table depth:(a) Thermal conductivity;(b) Heat capacity;and (c) Thermal diffusivity.
5.Conclusions
The uncertainties of thermal boundaries and soil properties can affect the permafrost table of the QTP.In this study,a series of field experiments and MC simulation of the thermal boundaries and soil properties are carried out.The statistical characteristics and variation characteristics of thermal boundary and soil properties on the QTP are obtained.A stochastic analysis method of permafrost table with thermal boundary model and heat conduction process is proposed.The accuracy of the analysis method of permafrost table is verified by experiment data.Finally,the effects of the ACF,COV and ACD of soil properties and the COV of thermal boundary on the probabilistic permafrost tables are analyzed.The following conclusions can be drawn:
(1) The average depth of permafrost tables in Beiluhe and Kaixinling are about 1.5 m and 1.48 m under natural ground surface in the beginning and increase to about 2.42 m and 2.67 m after 50 years,respectively.The average increasing rates of permafrost table in Beiluhe and Kaixinling are about 1.84 cm/a and 2.38 cm/a,respectively.
(2) The differences of the effects of five 2D ACFs of soil properties on the SD of permafrost table depth are not obvious,and the largest difference of permafrost table’s SD is only 2.2 cm.The SD of permafrost table depth of the QTP increases with the time.The larger the COV of soil properties,the larger the SD of permafrost table depth.

Fig.9.Effects of different COV values of climate change on SD of permafrost table depth:(a) Annual mean temperature;(b) Annual temperature variation;and (c) Temperature rising rate.
(3) The ACD of thermal conduction parameters in the permafrost region fluctuates between 0.4 m and 1.2 m.When the ACDs of thermal conductivity are 1 m and 0.6 m,the increasing rates of the SD are about 0.22 cm/a and 0.21 cm/a,respectively.The longer the ACD of soil properties,the smaller the SD of permafrost table depth.
(4) The effects of COV of thermal boundary on the SD of permafrost table depth of the QTP are different.The increasing rates of the SD are about 0.24 cm/a and 0.21 cm/a when the COV values of annual mean temperature are 0.2 and 0.1,respectively.The larger the COV of thermal boundary,the larger the SD of permafrost table depth.
Declaration of competing interest
The authors wish to confirm that there are no known conflicts of interest associated with this publication and there has been no significant financial support for this work that could have influenced its outcome.
Acknowledgments
This research was supported by Open Fund of State Key Laboratory of Frozen Soil Engineering (Grant No.SKLFSE202017),Key Research and Development Program of Xuzhou (Grant No.KC20179),and Major State Basic Research Development Program(Grant No.2012CB026103).The authors wish to thank two anonymous reviewers and editor for their comments and advice.
Appendix A.Supplementary data
Supplementary data to this article can be found online at https://doi.org/10.1016/j.jrmge.2020.10.008.
 Journal of Rock Mechanics and Geotechnical Engineering2021年3期
- Journal of Rock Mechanics and Geotechnical Engineering的其它文章
- Effects of oil contamination and bioremediation on geotechnical properties of highly plastic clayey soil
- Bearing capacity of surface circular footings on granular material under low gravity fields
- Effect of natural and synthetic fibers reinforcement on California bearing ratio and tensile strength of clay
- Engineering and microstructure properties of contaminated marine sediments solidified by high content of incinerated sewage sludge ash
- Modification of nanoparticles for the strength enhancing of cementstabilized dredged sludge
- Rock-like behavior of biocemented sand treated under non-sterile environment and various treatment conditions
