Optimal placement of two soil soundings for rectangular footings
Marcin Chwała
Department of Geotechnology,Hydro Technology,and Underground and Hydro Engineering,Faculty of Civil Engineering,Wrocław University of Science and Technology,Wybrze˙ze Wyspia´nskiego 27,Wrocław,50-370,Poland
Keywords:Optimal borehole location Spatial variability Soil sounding Bearing capacity Fluctuation scale Rectangular foundation
ABSTRACT This study uses a recently proposed algorithm for consideration of soil sounding locations in the bearing capacity estimations of spatially variable soil for rectangular footings.The objective of the study is to assess the possibility of indicating general guidelines for optimal soil sounding locations in the case of two soundings and rectangular footings.The possibility of proposing such general guidelines would be extremely valuable from the engineering practice point of view.Moreover,it would be promising for future studies concerning more complex foundation arrangements.For this reason,numerous scenarios are analyzed for a variety of vertical and horizontal fluctuation scales and a variety of rectangular foundation lengths.For generality of the results,two correlation structures are considered,i.e.the Gaussian and the Markovian ones.The optimal sounding location results are discussed.The observations indicate that,for a specified vertical fluctuation scale,all optimal borehole locations in dimensionless coordinates form a curve.This phenomenon can be utilized in practical applications.The potential applications of the obtained results and the directions for future studies in this area are also discussed.
1.Introduction
Natural soil formation processes that contain complicated interactions between geology,topography and climate result in the spatial variability of soil properties (e.g.Ferreira et al.,2015).The spatial variability in soil strength properties is an issue of particular importance for engineers.This is due to its significant impact on the performance of all structures built on natural soils.In the case of shallow foundation bearing capacity,the modeling of spatial variability of soil strength properties as random fields becomes increasingly popular in recent years(e.g.Phoon and Kulhawy,1999;Rackwitz,2000;Fenton and Griffiths,2008).The explicit representations of two-dimensional(2D)random fields are widely used in finite element-based approaches(e.g.Griffiths and Fenton,2001;Fenton and Griffiths,2003;2008;Huang et al.,2013;Pieczy´nska-Kozłowska et al.,2015;Ali et al.,2016;Selmi et al.,2019;Shu et al.,2020;Vivescas et al.,2020).However,there are much less published studies concerning three-dimensional(3D)analyses(e.g.Simoes et al.,2014;Kawa and Puła,2020).This is mostly due to the fact that the numerical methods based on finite elements used to solve 3D issues are time-consuming procedures.If considering the impact of soil spatial variability on bearing capacity,the numerical efficiency is an important factor that verifies the practical applicability of the method (due to large number of simulations to be performed).
The location of the soil soundings with respect to the considered foundation is an important issue.Due to stronger correlation within the soil,the closer locations of soil soundings provide more reliable information about the soil parameters in the vicinity of the considered foundation.As a result,for closer cone penetration test(CPT) location,smaller uncertainty in the foundation bearing capacity estimation can be obtained.This information can be considered by using conditional random fields (e.g.Lloret-Cabot et al.,2012;Li et al.,2015;Cai et al.,2017;Jiang et al.,2018).To determine optimal locations of soil soundings which would have practical applications in the area of shallow foundations,3D analyses are necessary.However,there are no published results of the 3D finite element approach for borehole location optimization known to the author.There are few studies concerning 2D analysis,i.e.for slope stability problem by Li et al.(2016),Jiang et al.(2017),and Jiang et al.(2020).An interesting approach of site investigation program optimization that maximizes robustness and minimizes site investigation effort was proposed by Gong et al.(2014,2017).In the study by Herbut et al.(2020),the problem of optimal sensor arrangement during vibration monitoring is analyzed.
Despite the lack of 3D solutions for bearing capacity problem within the finite element method,a novel approach for determining optimal sounding location was proposed in the recently published study by Chwała (2020a,b).That study proposed approximate approach based on Vanmarcke (1983)’s spatial averaging and kinematical failure mechanism for undrained conditions(Chwała,2019).The approach provided by Chwała(2020a,b)is used in this study to assess the possibility of indicating general guidelines for optimal soil sounding locations in the case of two soundings and rectangular footing.Such general guidelines can be used for indicating optimal borehole locations before any information about the soil conditions are gained.To do this,some assumptions described in the following sections have to be made.The possibility of proposing such general guidelines would be valuable from the engineer’s point of view.Moreover,it would be promising for future studies concerning more complex foundation arrangements.Numerous scenarios are analyzed in this study for typical ranges of vertical and horizontal fluctuation scales and typical lengths of rectangular foundations.For generality of the results,two correlation structures were considered,i.e.the Gaussian and the Markovian ones (Fenton and Griffiths,2008).The obtained results are described in detail and discussed.It is shown that some general patterns for optimal soil sounding locations can be found for rectangular foundation.Moreover,in the conclusion section,some possible applications of the proposed algorithm are given.
2.Brief description of the algorithm used
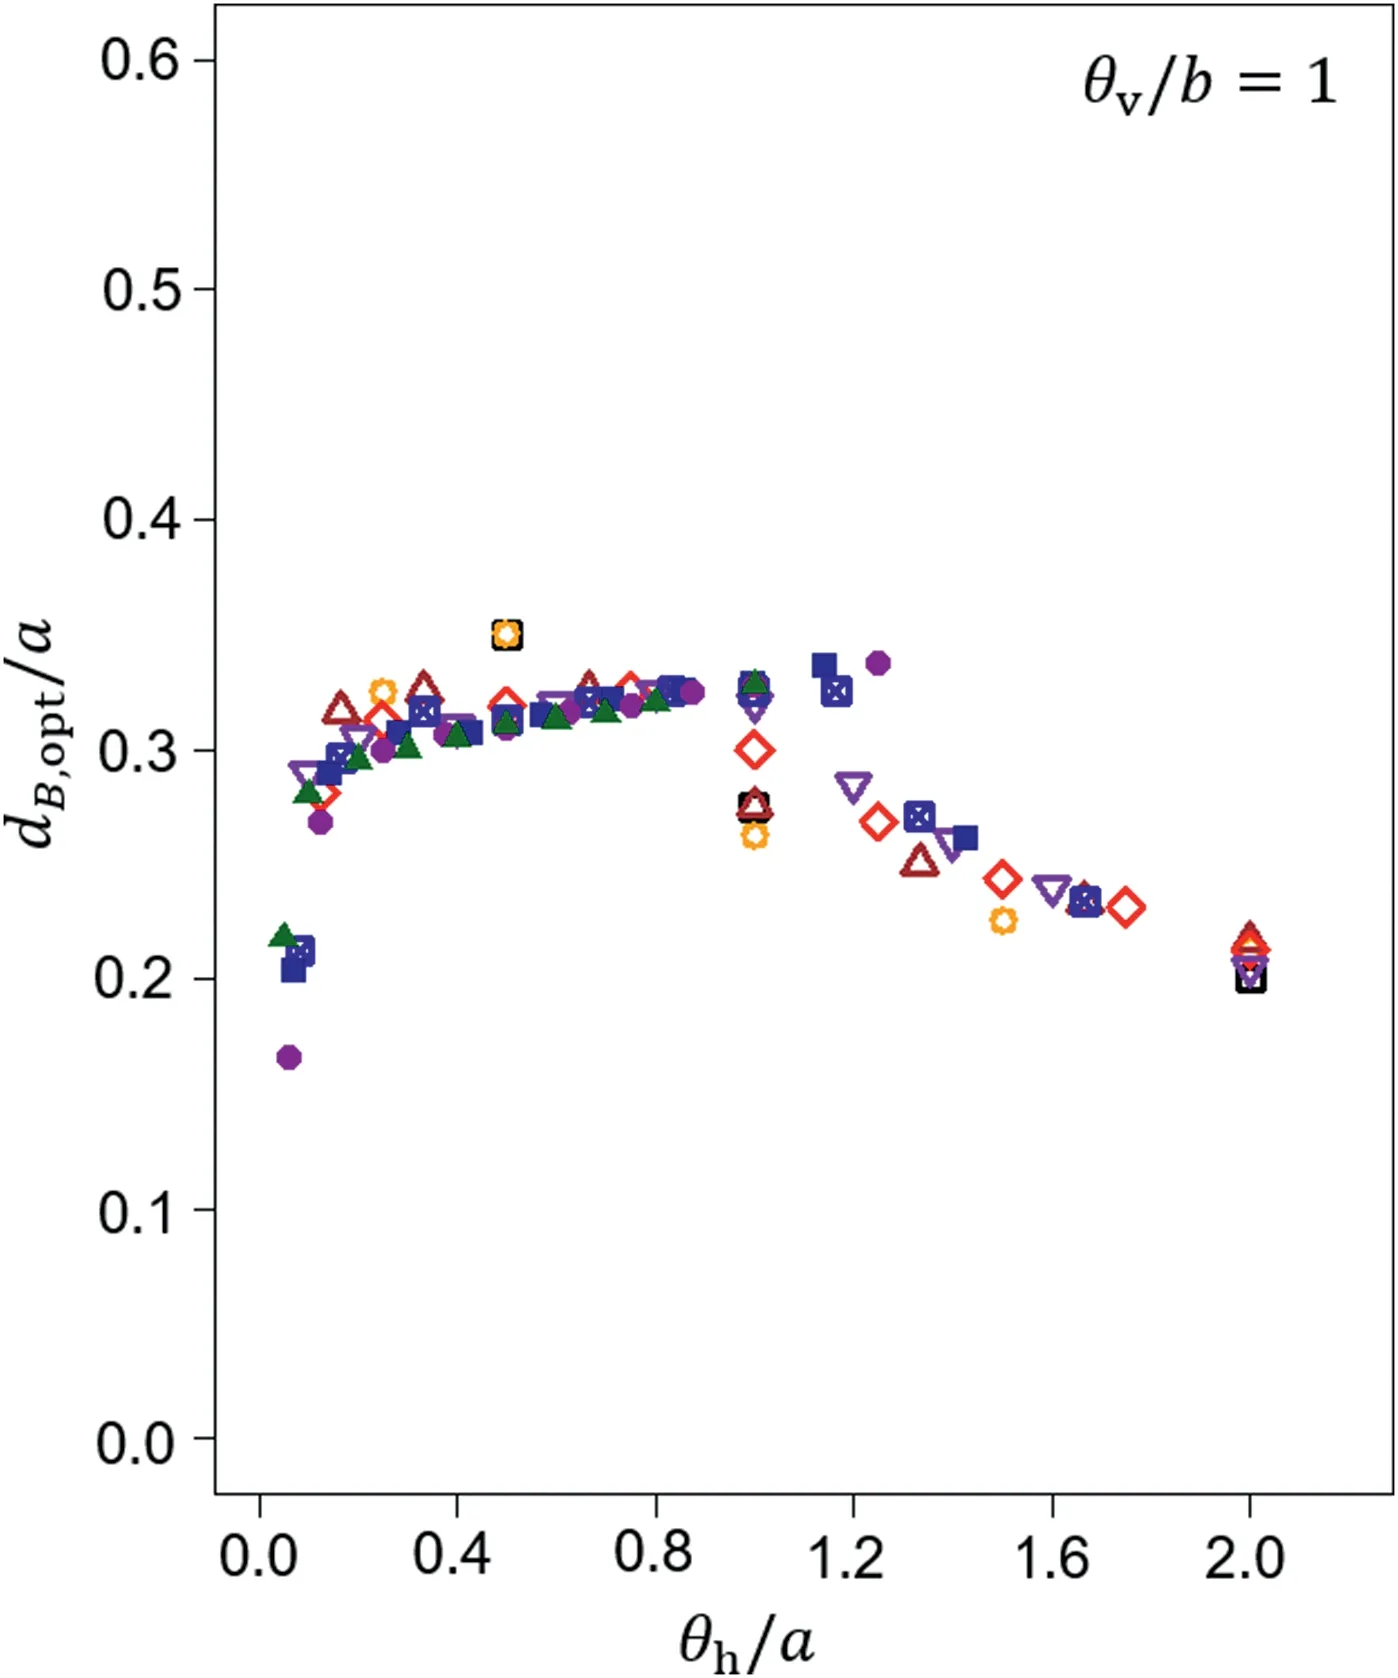
As mentioned in the Introduction,the main objective of this study is to assess the possibility of indicating general guidelines for optimal soil sounding locations in the case of two soundings and rectangular footings.For this reason,the algorithm proposed by Chwała (2020a,b) is used here.The algorithm uses a probabilistic adaptation of the deterministic failure mechanism described by Gourvenec et al.(2006).The assumed mechanism pertains to a rough foundation base under undrained conditions.The probabilistic version of the aforementioned mechanism was described in detail by Chwała(2019).To preserve the clarity and emphasize the original elements of this study,only some of the most important information about the used algorithm is repeated here.However,the approach used will be described with details in the next section.Only a part of algorithm proposed in Chwała(2020a,b)is used here.That part is responsible for estimating bearing capacity standard deviation for the assumed correlation structure,CPT locations and size of the foundation.Vanmarcke’s spatial averaging is used to obtain correlated set of single random variables responsible for describing undrained shear strength in each dissipation region.The Vanmarcke’s spatial averaging provides moving average field that is obtained after the random field averaging within the considered volume V (see Eq.(1)),where the domains of averaging are the dissipation regions (e.g.Fenton and Griffiths,2008).

where X denotes the random field,which describes undrained shear strength.The dissipation regions result from the assumed failure geometry(Chwała,2019).By deriving formulae for variance in each dissipation region and covariances between those regions and between soil sounding lines,the corresponding covariance matrix can be obtained.All formulae were derived from general equation for covariances between the two specified dissipation regions Viand Vj:
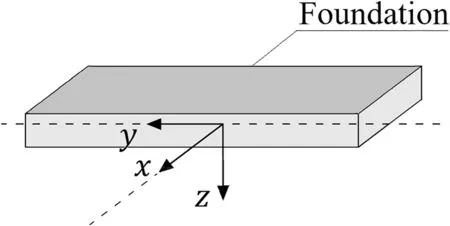
Fig.1.The assumed coordinate system location with respect to foundation.

where R is a covariance function.In this study,two covariance functions are considered,i.e.the Gaussian(Eq.(3))and Markovian(Eq.(4)).Due to the positivity of undrained shear strength(cu)and relatively simple mathematical apparatus,a lognormal stationary random field of cuis assumed.A lognormal distribution is commonly used to describe the distribution of the undrained shear strength in geotechnical applications (e.g.Fenton and Griffiths,2008;El Haj et al.,2019).The autocorrelation model is assumed to be separable in each direction.Note that Eq.(2)for i=j becomes formula for variance.

Based on the obtained covariance matrix,and by using Cholesky decomposition (Horn and Johnson,1985;Puła and Chwała,2015),generation of averaged undrained shear strengths in each dissipation region is possible (e.g.Fenton and Griffiths,2008;Puła and Chwała,2018).Next,for the obtained undrained shear strengths,the corresponding bearing capacity is calculated by using the probabilistic version of the failure mechanism (Appendix A).
By the aforementioned procedure,only one bearing capacity is obtained for the considered CPT locations.However,to make comparison between different CPT locations possibly in terms of bearing capacity standard deviations,it is necessary to perform a larger number of realizations to the specified CPT locations.A number of 100 realizations for estimation of bearing capacity standard deviation seems to be a reasonable choice that compromises between accuracy and numerical efficiency.A relatively low number of realizations to estimate the standard deviation is due to the weak dependence of optimal CPT locations on the number of realizations h (Appendix B).Therefore,in this study,100 bearing capacity calculations are used to estimate the corresponding standard deviation.By this estimation,an objective comparison between two CPT layouts is possible.The comparison is needed to indicate better CPT layouts,suggesting the layouts for which lower bearing capacity standard deviation is obtained.The analyses are performed in this study under the assumption of no trend in undrained shear strength.This assumption is justified by weak dependence of the failure mechanism size with or without consideration of the trend,and by relatively shallow failure mechanisms obtained in the study.The consideration of trend impact is planned for the future study.
3.Description of the approach used
The algorithm described by Chwała (2020a,b) contains the optimization procedure;however,as noted there,in the case of rectangular foundation and two soil soundings,the resulting optimal sounding locations are placed symmetrically with respect to the foundation center.The optimal soil sounding locations for which the minimum standard deviation of the bearing capacity occurs are located on the y-axis and are symmetrical with respect to the x-axis (Fig.1).
This observation allows the searching area to be decreased.Therefore,in the case considered,no optimization procedure is needed.As a result,bearing capacity standard deviations can be estimated for each pair of boreholes located symmetrically with respect to the x-axis(Figs.1 and 2).Due to the high efficiency of the algorithm used (see Appendix A),the resolution assumed in the study is 0.05 m along y-axis.The illustration of the considered scenario is shown in Fig.2.The parameter dBis the distance between the foundation center and the borehole location along the yaxis.
Before detailed information about the considered scenarios is provided,an example representation of results for one such analysis is given in Fig.3.This example illustrates the manner in which the results will be further presented.The scenarios considered in Fig.3 are for foundation length a=10 m,foundation width b=1 m,and horizontal and vertical fluctuation scales θh=4 m and θv=1 m,respectively.The resulting standard deviation of 100 bearing capacity simulations σBis shown as a function of dB.Because of the symmetry,only half of the y-axis is shown in Fig.3.
According to Fig.3 for borehole location at dB=6 m,due to the symmetry,the second borehole is located at dB=-6 m,the resulting bearing capacity standard deviation is approximately 1200 kN.As shown in Fig.3,the function of the bearing capacity standard deviation with respect to dBreaches its minimum near dB=3 m.Therefore,based on Fig.3,the optimal borehole location is determined.This optimal location is valid for the specified foundation shape and fluctuation scale values.To find more general relationships for optimal borehole locations in the case of different foundation shapes and fluctuation scale scenarios,it is necessary to analyze numerous combinations of those parameters,which is possible due to the high numerical efficiency of the proposed method.Notably,to obtain a plot as shown in Figs.3,24,000 estimations of the bearing capacity of the rectangular foundation need to be carried out.Note that if finite element approach is used for this task,by assuming average time needed for one 3D bearing capacity estimation to be about 0.5 h,for one processor core,total computation time of 500 d is needed.This hypothetic computation time is drastically longer than approximately 4 h needed for the algorithm used in this study.Note that for the purpose of this study,over 1000 different scenarios like this shown in Fig.3 have to be analyzed.
4.Numerical analyses

Fig.2.Top view of the rectangular shallow foundation and symmetrical location of the two boreholes.
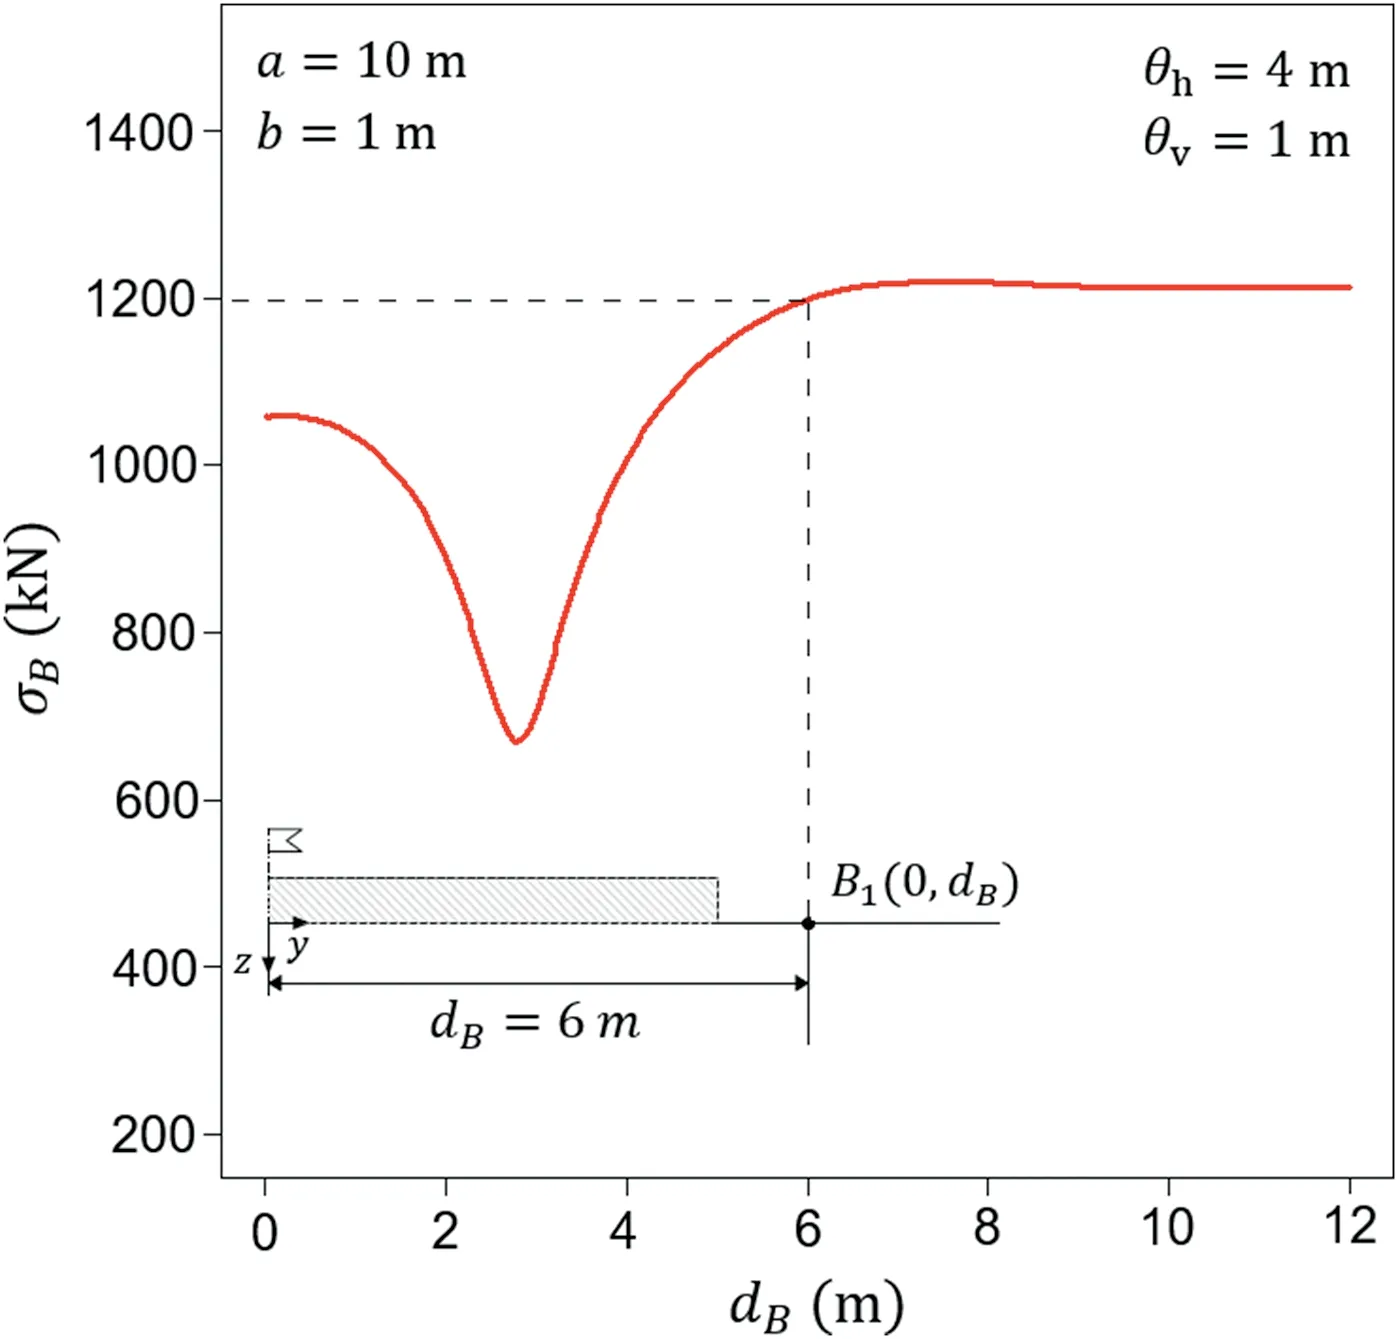
Fig.3.Illustrative example of the resulting bearing capacity standard deviation as a function of borehole distance from the foundation center dB.Results obtained for a rectangular foundation of 10 m × 1 m and an anisotropic correlation structure with θh=4 m and θv=1 m.Gaussian covariance function is assumed.
Multiple foundation lengths that are reasonable from a practical point of view are selected for the numerical analyses,i.e.a=2 m,4 m,6 m,8 m,10 m,12 m,14 m,16 m,and 20 m.For the probability distribution of the initial random field,a lognormal distribution(Fenton and Griffiths,2008)is assumed with μcu=100 kPa and σcu=50 kPa.The resulting variation coefficient is assumed according to Pieczy´nska-Kozłowska et al.(2017).However,in Chwała (2020a,b),it is shown that both μcuand σcuhave very limited impact on the optimal soil sounding locations.Therefore,the results obtained in this study can be applied to wide ranges of those parameters.Four vertical fluctuation scale values were examined,i.e.θv=0·125 m,0·25 m,0·625 m,and 1 m.These values of the vertical fluctuation scales are within a range that has been recently reported (e.g.Lloret-Cabot et al.,2014;Bombasaro and Kasper,2016;Pieczy´nska-Kozłowska et al.,2017;Puła et al.,2017;Salgado et al.,2019;Cami et al.,2020).For each vertical fluctuation scale for most of the considered scenarios,the following values of the horizontal fluctuation scale are analyzed:θh=1 m,2 m,3 m,4 m,5 m,6 m,7 m,8 m,9 m,10 m,12 m,14 m,15 m,16 m,and 20 m.The range of the assumed horizontal fluctuation scales is relatively wide,because the estimation of the horizontal fluctuation scale is much more difficult than that of the vertical fluctuation scale;this difference is mainly caused by the limited data available in the horizontal direction (Jaksa et al.,1999;Cami et al.,2020).Nevertheless,some recently proposed approaches are very promising for identifying horizontal fluctuation scales in the case of a limited number of CPT soundings (e.g.Ching et al.,2018).The chosen values of the horizontal fluctuation scale are equal to or greater than the vertical fluctuation scales (Cherubini,1997).All the analyses are performed following the approach presented in the previous section.However,the investigated distance varies from dB=0·05 m to the maximum value of dB=(a+θh)/2 m by increment of 0·05 m.As mentioned earlier,the above detailed scenarios were analyzed for Gaussian and Markovian covariance functions.Therefore,the total number of analyzed scenarios for different fluctuation scales and foundation lengths is about 1000.Consequently,approximately 25 million bearing capacity estimations of rectangular foundation are performed.This large number is possible due to the numerical efficiency of the proposed approach.All the scenarios include a foundation width of b=1 m and a coefficient of variation of the undrained shear strength of νcu=0·5.The coefficient of variation of the undrained shear strength is kept constant because νcuhas no influence on the optimal borehole locations(Chwała,2020a,b).The method detailed in Sections 2 and 3 is implemented in MATLAB software(MathWorks,2018),and the achieved mean computation time per 3D bearing capacity estimation equals 0.5 s.
5.Results
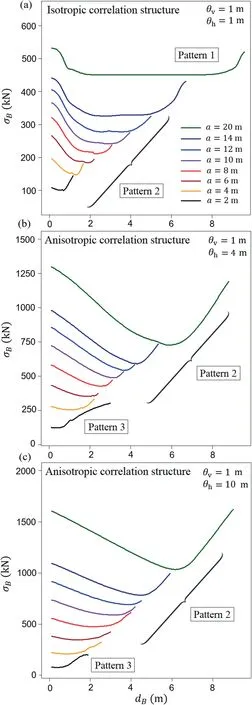
Generally,the shape of the function that describes σBwith respect to dBdepends on the relationships between the fluctuation scales and the foundation length.Therefore,the shape shown in Fig.3 is an example of only one possible output.However,the results indicate the existence of four main patterns in which σB(dB)behaves.To discuss these patterns,Fig.4 for Gaussian covariance function is given below.Each of these sub-figures is dedicated to different horizontal fluctuation scales,i.e.θh=1 m (Fig.4a),3 m(Fig.4b),and 10 m (Fig.4c).The vertical fluctuation scale is consistent among the three sub-figures and equals θv=1 m.According to Fig.4a,the first pattern of σB(dB)is observed for foundation lengths greater than a=8 m (Pattern 1).In these situations,the horizontal fluctuation scales are significantly smaller than the foundation length.Thus,for a relatively wide range of dB,the resulting bearing capacity standard deviation is almost constant.In this pattern,the minimum value occurs near the end of the foundation.This result can be explained by the nature of the failure mechanism,i.e.more energy is dissipated at the ends of the foundation.Therefore,the soil soundings located there have a more significant impact on the final standard deviation of the bearing capacity.With an increase in θh/a,the shape of σB(dB)becomes more oblong,and a minimum in the bearing capacity standard deviation can be clearly observed (Pattern 2).With a further increase in θh/a,the minimum σBshifts to a shallower position,and for θh/a>1,the lowest σBis observed for boreholes located near the foundation center (see Pattern 3 in Fig.4b or c).The last recognized pattern is observed for a horizontal fluctuation scale that is significantly larger than the foundation length.In that case,the minimum σBoccurs for dB>a/2.However,Patterns 3 and 4 are both characterized by a shallow shape of the σB(dB)function for the soil sounding locations in the vicinity of the foundation.Practically,the scenarios for θh/a<1 are the most important(if the soil under the foundation is not nearly homogenous).
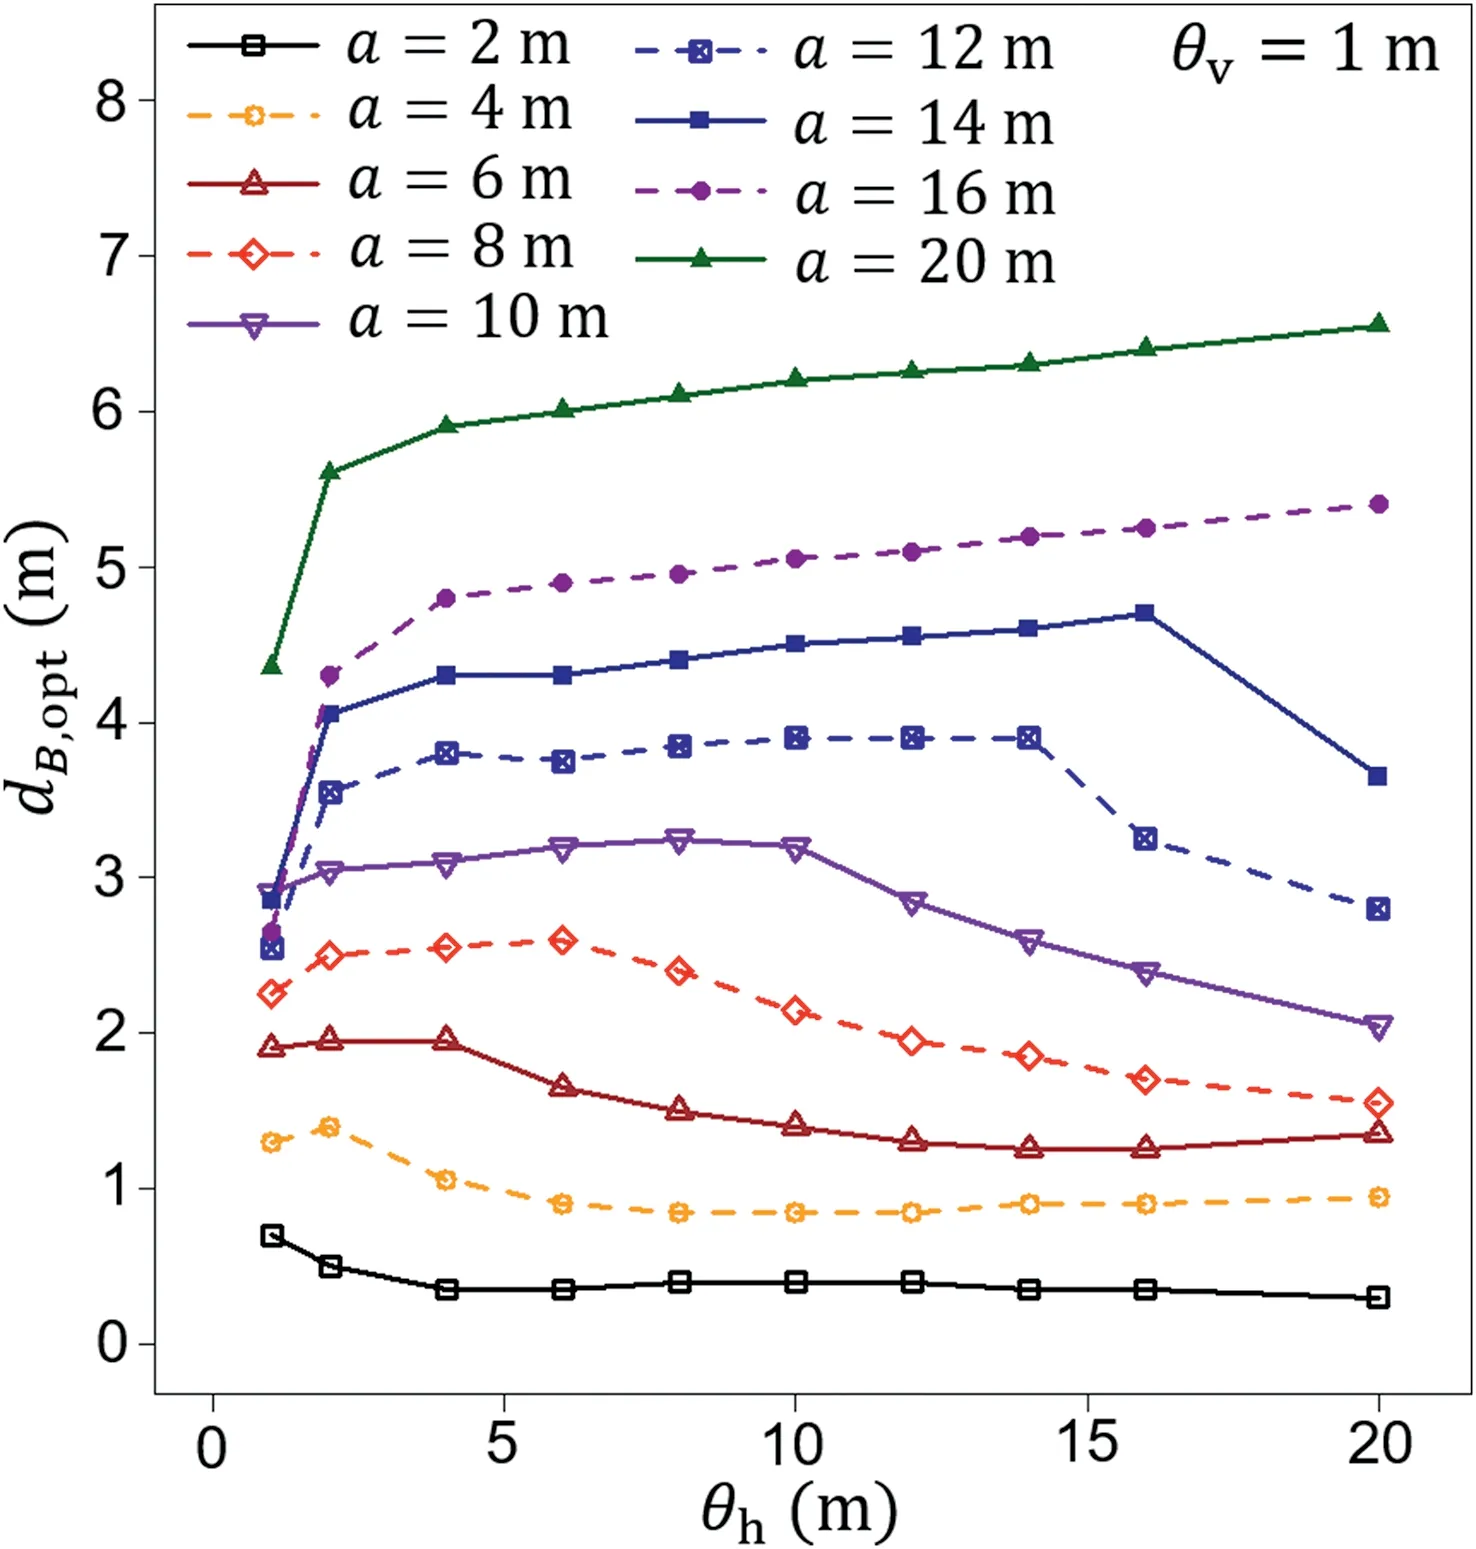
By collecting information about the optimal borehole location dB,opt,a plot that illustrates dB,optdependence on the horizontal fluctuation scale can be constructed.Such a plot is shown in Fig.5,where multiple foundation lengths were investigated for θv=1 m.Each point from Fig.5 is a result of a single curve that expresses σBas a function of dB.As an example,for the curve shown in Fig.4a for a foundation length of a=20 m,the optimal borehole distance is dB,opt=9·15 m;this result is plotted in Fig.5 as the first point for a=20 m.Note that in Fig.4,the results for only three horizontal scales are shown;however,15 horizontal fluctuation scales were analyzed to obtain the plot shown in Fig.5.
All the curves shown in Fig.5 exhibit similar behaviors;however,this trend changes slowly as the foundation length increases.Next,as an illustrative example,the curve obtained for a=20 m is disuccsed.For short horizontal fluctuation scales,the optimal borehole location dB,optshifts closer to the foundation center with an increase in the horizontal fluctuation scale.A minimum dB,optis obtained close to θh=6 m and starts to increase slowly with a further increase in θh.The dB,optreaches a maximum for θh=15 m and slowly decreases to approximately θh=20 m,after which a rapid decrease occurs.This rapid change is a result of a previously discussed change in pattern:Pattern 2 is changing into Pattern 3.In the case of a foundation length of a=20 m,the fourth pattern is not observed,due to the relatively long foundation in comparison with the horizontal fluctuation scale.As Fig.5 shows,Pattern 4 occurs for foundation lengths of only a=2 m and 4 m (the example for a=2 m is shown in Fig.4c,where the minimum σBoccurs at dB,opt=1 m).
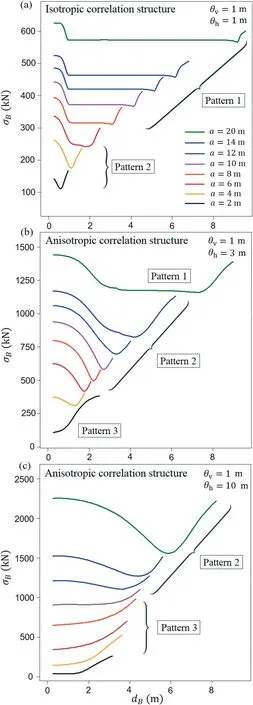
Fig.4.Bearing capacity standard deviation σB as a function of borehole distance dB and foundation length a for Gaussian covariance function.Results obtained for (a) an isotropic correlation structure with fluctuation scale θ=1 m,(b) an anisotropic correlation structure with θv=1 m and θh=3 m,and (c)an anisotropic correlation structure with θv=1 m and θh=10 m.
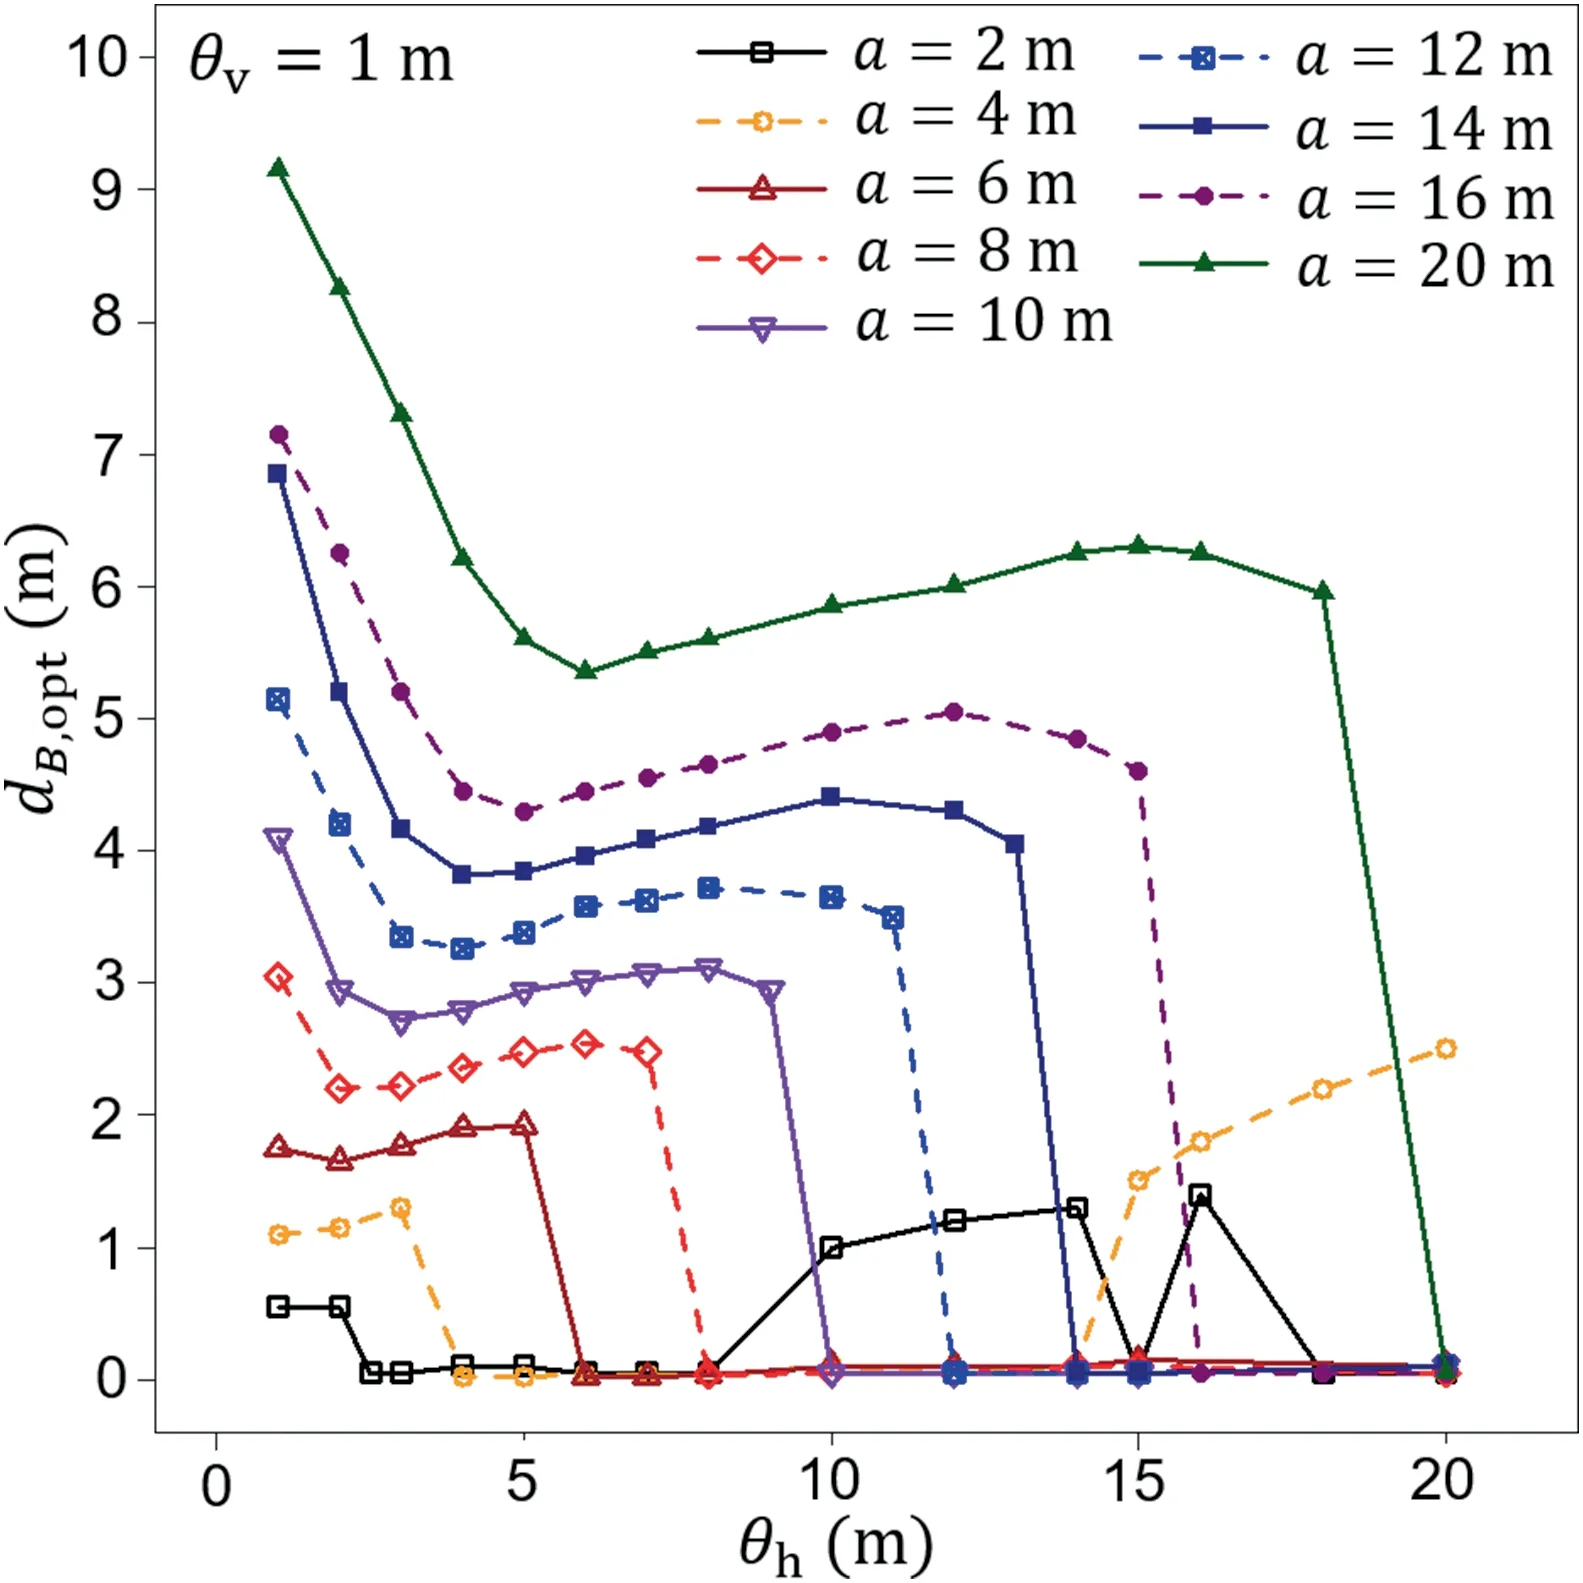
Fig.5.Optimal borehole locations as a function of horizontal fluctuation scale θh and foundation length a for Gaussian covariance function.
An interesting observation can be made if the results are expressed in dimensionless coordinates when both the horizontal fluctuation scale θhand the optimal borehole location dB,optare divided by the corresponding foundation length a.This observation plays a crucial role for the purpose of this study.As a result,the plot shown in Fig.6 is obtained from Fig.5.
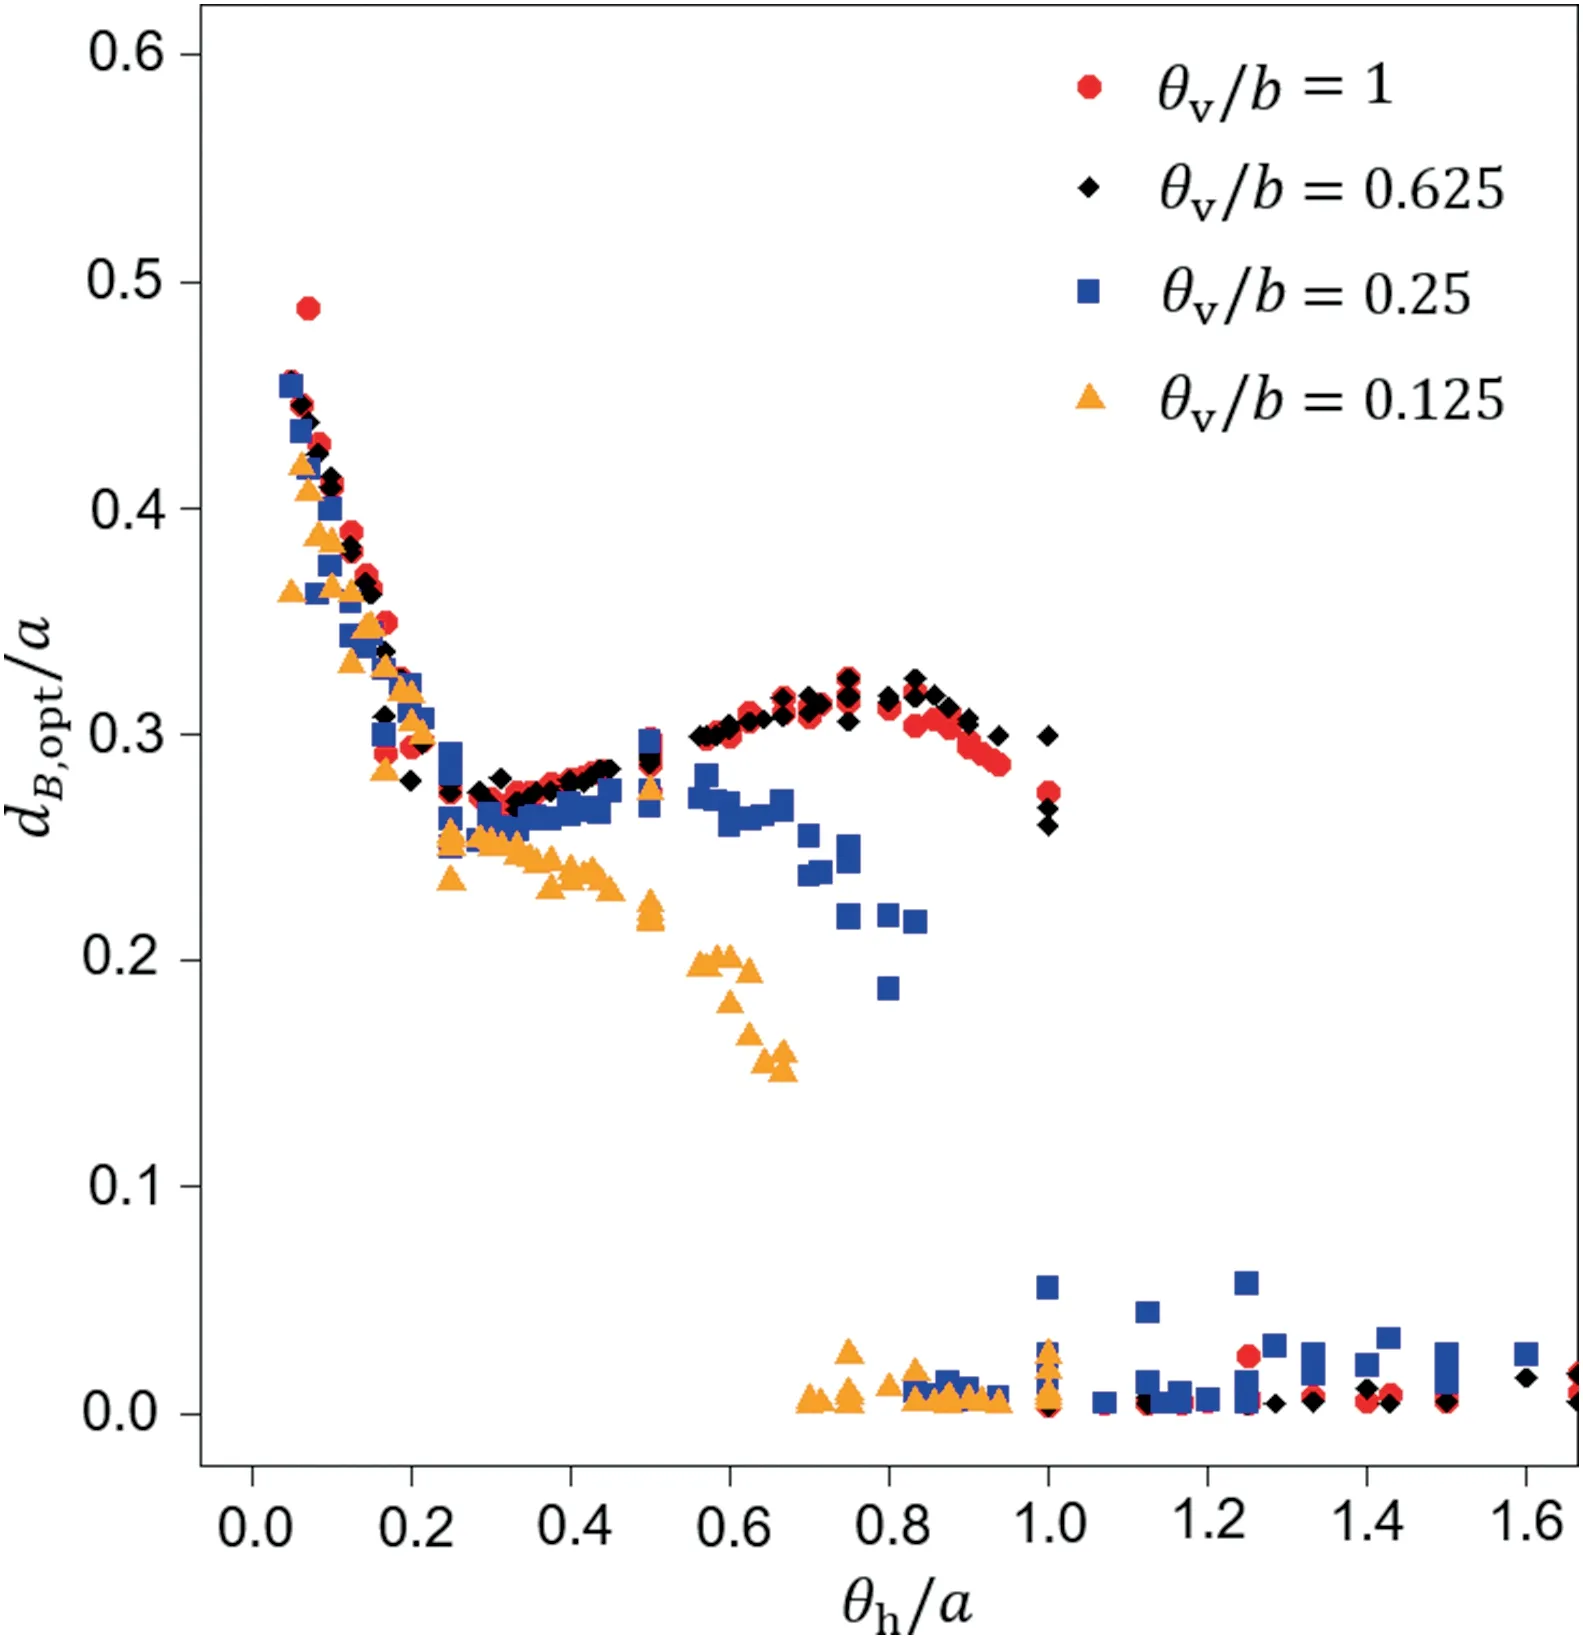
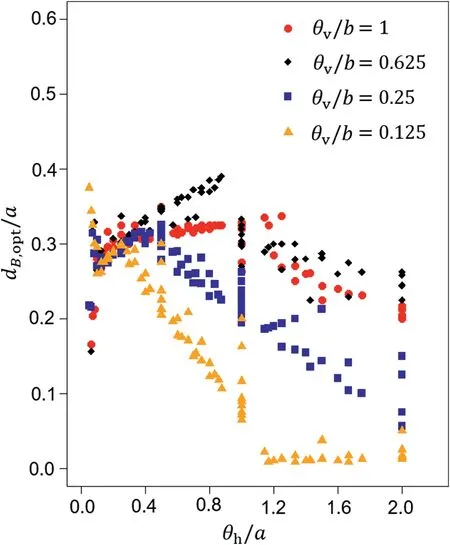
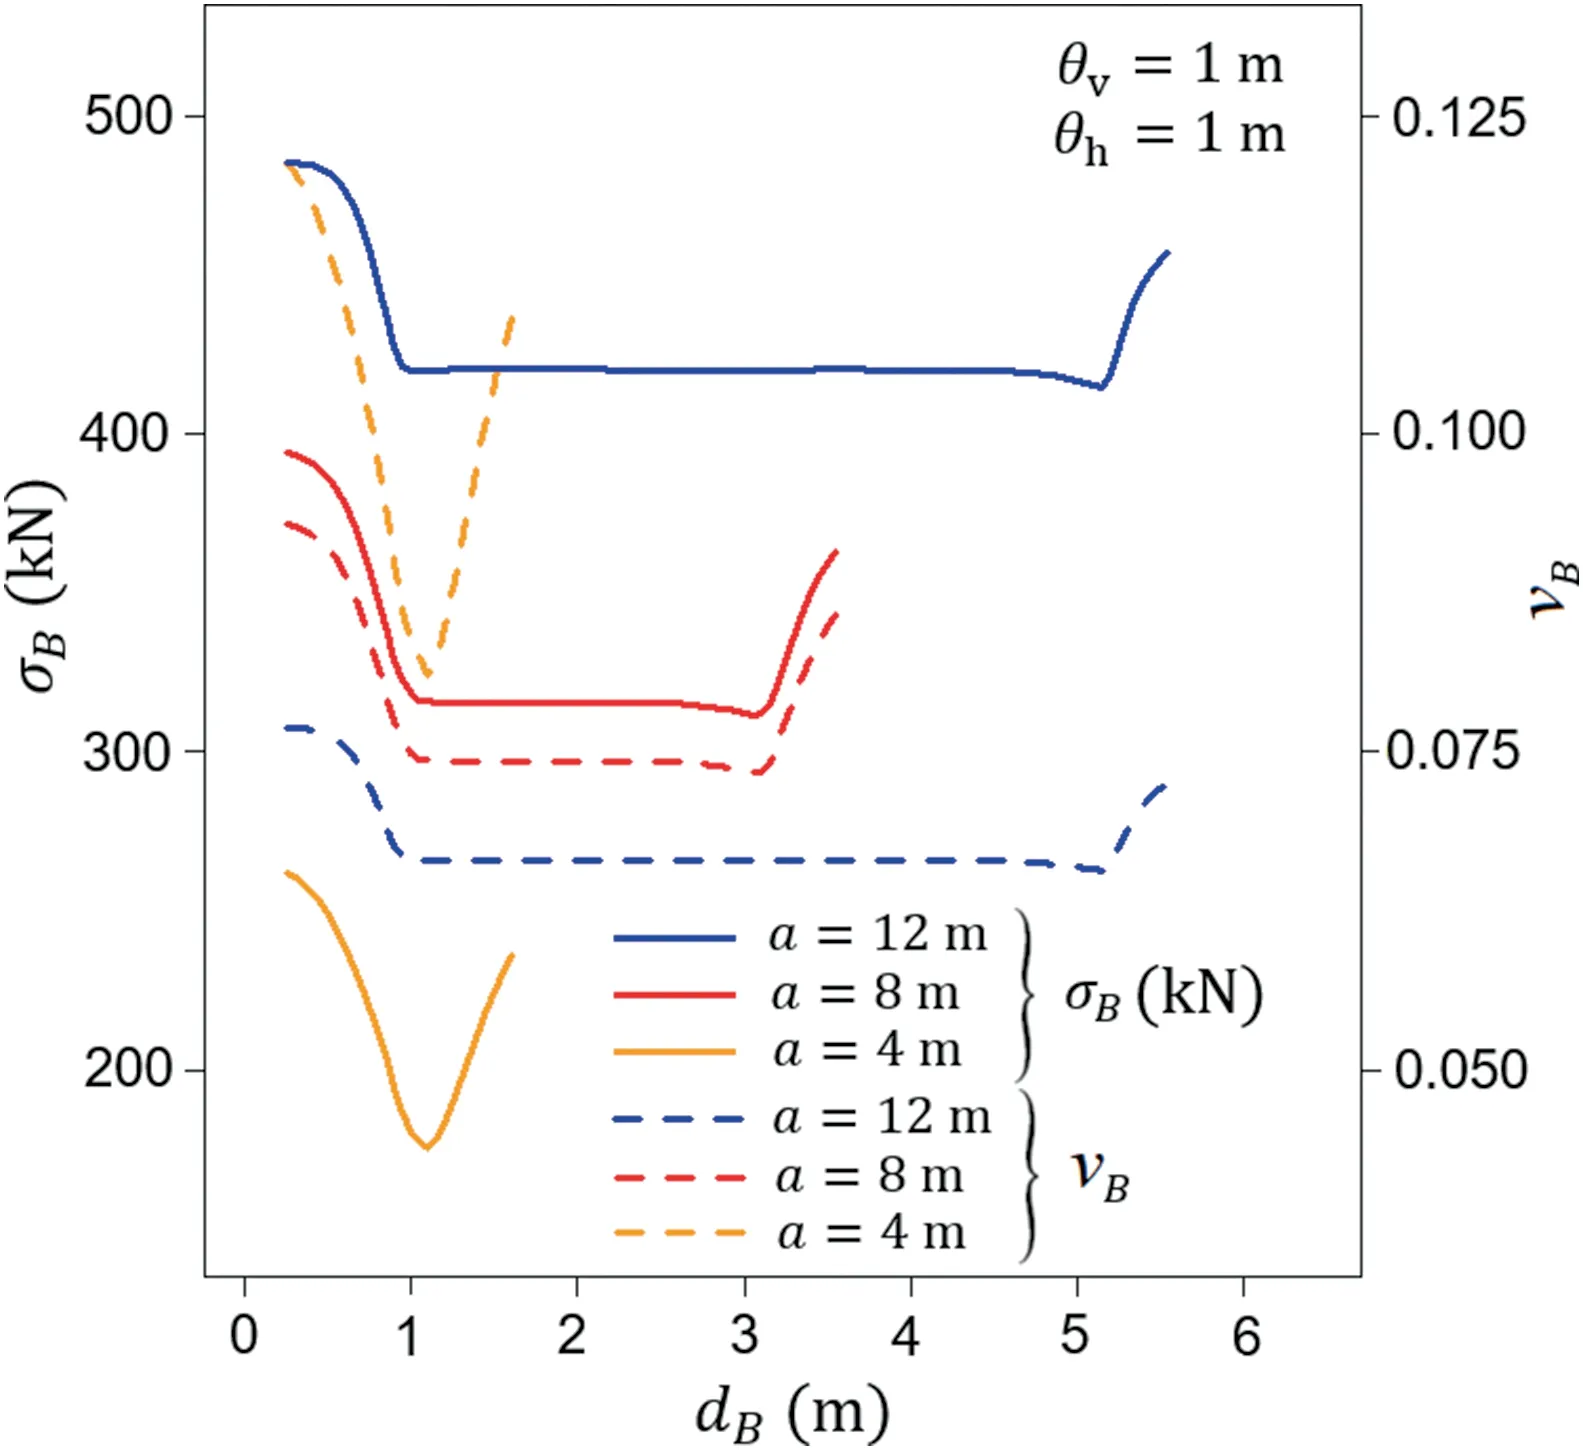
Interestingly,all the points from Fig.5 gathered along one curve in dimensionless coordinates,as shown in Fig.6.This observation indicates that the optimal borehole locations in the considered scenario can be predicted according to the dimensionless horizontal fluctuation scale θh/a.Moreover,the results have a practical meaning;for the most practical point of view(θh Fig.6.Results obtained from Fig.5 for Gaussian covariance function and shown in dimensionless form (optimal borehole location and horizontal fluctuation scale are both divided by foundation length). Fig.7 shows that,with a decrease in the vertical fluctuation scale,the shape of the curve that describes the optimal borehole location changes,i.e.the local maximum that is visible for θv/b=1 and 0·625 becomes shallower for θv/b=0·25 and disappears for θv/b=0·125.Moreover,the transition from Pattern 2 to Pattern 3 is observed for a smaller θh/a.The information on the obtained patterns is given in Table 1.As mentioned,Patterns 1 and 2 are the most important patterns for practical applications. Fig.7.Optimal borehole locations in dimensionless coordinates obtained for four vertical fluctuation scales for Gaussian covariance function. Interestingly,all the results plotted in the dimensionless coordinate system(Fig.7)collapse onto one curve for a specified ratio of the vertical fluctuation scale and the foundation width.Moreover,the ratios of θv/b=1 and 0·625 show a very narrow dependence on a wide range of horizontal fluctuation scales.This result is useful for further practical application of these findings,i.e.placing boreholes at a distance of 0.3a from the foundation center,which is very close to the optimal distance.However,if θv/b decreases,the curve that describes the optimal borehole location monotonically decreases with respect to an increasing θh/a(see Fig.7 for θv/b=0·125).Therefore,for a relatively short vertical fluctuation scale with respect to foundation width,θv/b∈[0·1,0·3],the optimal choice is to locate soil soundings at a distance of 0.2a-0.25a.Moreover,four patterns that describe the optimal borehole location as a function of θhare identified(see Table 1).According to Fig.7,for θh/a<0·3,the optimal borehole location is independent of the vertical fluctuation scale,and dB,opt/a decreases linearly with an increase in horizontal fluctuation scale θh/a.Based on a linear regression,the following formula is obtained with coefficient of determination R2=0·87: The results shown in Figs.4-7 are obtained for Gaussian covariance function (Eq.(3)).Therefore,the general conclusions described above cannot be regarded as true for other covariance functions.To verify this,the same scenarios to those described in Figs.4-7 are analyzed for Markovian covariance function(Eq.(4)).Analogously to Figs.4 and 8 shows the patterns for optimal soil sounding locations in the case of Markovian covariance function.Each of these sub-figures is dedicated to different horizontal fluctuation scales,i.e.θh=1 m (Fig.8a),4 m (Fig.8b) and 10 m(Fig.8c).The vertical fluctuation scale is consistent among the three sub-figures and equals θv=1 m.According to Fig.8a,the first pattern of σB(dB)is not similar as that in Fig.4a.As a result,most of the curves obtained for isotropic correlation structure can be considered as Pattern 2.Similar trend is observed for θh=4 m(Fig.8b)and 10 m except for relatively short foundations(with a=4 m and 2 m). By collecting information about the optimal borehole location dB,opt,analogously to Fig.5,dB,optdependence on the horizontal fluctuation scale for Markovian covariance function is plotted in Fig.9,where multiple foundation lengths are investigated for θv=1 m.The results obtained in Fig.9 differ from those obtained in Fig.5.However,after careful comparison,it can be seen that for the wide range of horizontal fluctuation scales,the obtained dB,optare very similar for the two considered covariance functions.Generally,the differences are visible for two fluctuation scale ranges:the first for short horizontal fluctuation scales (isotropic covariancestructure) and the second for strong anisotropy in covariance structure.The first is mostly visible for relatively long foundations(a ≥10 m),where for Gaussian covariance function,the function of dB,opt(θh)has decreasing tendency,but for Markovian one,the tendency is increasing.However,despite the clear differences in dB,opt,the obtained differences in bearing capacity standard deviations are small (see Pattern 1 in Figs.4 and 8).For the second fluctuation scale range in which the differences are significant,the downward trend in dB,optfor Markovian covariance function is slow in comparison with rapid decrease for Gaussian covariance function (see Figs.5 and 9).However,the locations where the slowly increasing trend is changed to the decreasing one are very close for both covariance functions. Table 1The observed ranges of θh/b for the four patterns of bearing capacity standard deviation behavior.Note that the limits of the ranges are rough approximations. In Fig.10,the results are expressed in dimensionless coordinates when both the horizontal fluctuation scale θhand the optimal borehole location dB,optare divided by the corresponding foundation length a.Similarly to the Gaussian covariance function in the case of Markovian one,the obtained results tend to be gathered near one curve;however,due to the aforementioned differences,the obtained shape is different from those shown in Fig.6. The results shown in Fig.10 are determined for θv/b=1.To verify the obtained results for the Markovian covariance function,the identical problems for different vertical fluctuation scales are analyzed.The following values are investigated:θv/b=1,0·625,0·25,and 0·125.As shown in Fig.11,for ratios θv/b=1 and 0·625,the obtained curves are close.However,for lower θv/b ratios,the dimensionless optimal borehole location dB,opt/a decreases.The differences are significant for θh/b from 0.4 to 1 and almost negligible for θh/b<0·3 expect for the small values of θh/a. Despite different values in the obtained bearing capacity standard deviations between Gaussian and Markovian covariance functions,the resulting optimal borehole locations coincide for both approaches.However,in random estimations of bearing capacity,a bearing capacity variation coefficient is often used and could be even more meaningful.In the considered scenarios for both Gaussian and Markovian covariance functions,higher bearing capacity mean values are obtained for soil soundings located closer to the foundation;however,this difference is not significant enough to affect the change of the optimal soil sounding location with respect to coefficient of variation for bearing capacity.As a result,both minima overlap.As an illustrative example,the results for three foundation lengths for isotropic Gaussian covariance function are shown in Fig.12. For the vertical fluctuation scale range θv/b∈[0·5,1],the placement of soil soundings at a distance of 0.3a from the center of the foundation seems to be a reasonable choice.Through this approach,it is possible to eliminate the influence of the horizontal fluctuation scale (which is a problematic parameter in practical applications).As shown in Figs.7 and 11,the largest deviations from the value of 0.3a are observed for θh/a>1 and θh/a<0·15 for a Gaussian covariance function.However,for both cases,very flat minima of σBare obtained.Therefore,the choice of borehole locations at 0.3a from the centre of the foundation is justified. An efficient and novel approach for determining optimal borehole locations proposed by Chwała (2020a,b) is used in this study.The purpose of its application was to assess the possibility of indicating general guidelines for optimal soil sounding locations in the case of two soundings and rectangular footings.As shown in the previous section,the optimal soil sounding locations in dimensionless coordinates(θh/a and dB,opt/a) follow specific curves,and therefore can be provided for a given vertical fluctuation scale.Moreover,for the vertical fluctuation scale range θv/b∈[0·5,1],the placement of soil soundings at a distance of 0.3a from the center of the foundation allows(with a slight difference in resulting bearing capacity standard deviation) to eliminate the influence of the horizontal fluctuation scale and choice of the covariance function.The possibility of proposing such general guidelines is extremely valuable from the practical point of view.However,this is mostly due to the future studies concerning more complex foundation arrangements.Based on the numerical analyses performed in this study,the following conclusions can be drawn: Fig.8.Bearing capacity standard deviation σB as a function of borehole distance dB and foundation length a for Markovian covariance function.Results obtained for (a) an isotropic correlation structure with fluctuation scale θ=1 m,(b) an anisotropic correlation structure with θv=1 m and θh=4 m,and (c) an anisotropic correlation structure with θv=1 m and θh=10 m. Fig.9.Optimal borehole locations as a function of horizontal fluctuation scale θh and foundation length a for Markovian covariance function. (1) Three general patterns for σB(dB)can be distinguished for both Gaussian and Markovian covariance functions.The shapes of σB(dB)are similar for both considered covariance functions. (2) It is found that for the results expressed in dimensionless coordinates when both the horizontal fluctuation scale θhand the optimal borehole location dB,optare divided by the corresponding foundation length a,the resulting points gather along one curve.This observation indicates that the optimal borehole locations in the considered scenario can be predicted according to the dimensionless horizontal fluctuation scale θh/a.This behavior is observed for Gaussian and Markovian covariance functions.However,greater order is observed in the case of Gaussian covariance function. (3) The curves shown in Figs.7 and 11 depend on the θv/b ratio.However,locating soil soundings at a distance of 0.3a from the center of the foundation allows to eliminate the influence of the vertical fluctuation scale and choice of the covariance function.It is worth mentioning that the obtained results indicate very little effect of autocovariance model selection on optimal borehole location (e.g.Ching and Phoon,2019;Ching et al.,2019). (4) The obtained results are related to theoretical findings and indicate optimal borehole locations in the general absence of any information about the soil conditions.However,in reality,site-specific influences can significantly impact the optimal borehole locations.Nevertheless,the general guidelines provided in the study allow for rational selection of borehole locations for the first probing sites.The obtained results are promising enough for extending this concept to more practical applications in the future(e.g.larger numbers of boreholes or complex foundation arrangements). Fig.10.The results obtained from Fig.9 for Markovian covariance function and shown in dimensionless form (optimal borehole location and horizontal fluctuation scale are both divided by foundation length). Fig.11.Optimal borehole locations in dimensionless coordinates obtained for four vertical fluctuation scales for Markovian covariance function. (5) The results are promising for further practical applications to improve the manner in which boreholes are located on construction sites by using theoretical findings.Due to its efficiency (bearing capacity estimation of a rectangular foundation takes approximately 0.5 s on a standard notebook),the approach can be used for more than two boreholes and for complex foundation arrangements in future applications.The author hopes that comparable results obtained with random finite element method(RFEM)or random finite limit analysis(RFLA)will be available in the near future.Such a comparison would be very interesting. Fig.12.Comparison of minima overlapping for standard deviation and coefficient of variation of bearing capacity for Gaussian covariance function. The author declares that he has no known competing financial interests or personal relationships that could have appeared to influence the work reported in this paper. List of symbols a Foundation length b Foundation width xBi,yBiCoordinates of the ith soil sounding location μcuExpected value of the undrained shear strength θx,θy,θzFluctuation scales along the x-, y- and z-directions,respectively θh=θx= θyHorizontal fluctuation scale θv=θzVertical fluctuation scale h Number of bearing capacity calculations used to estimate standard deviation σBEstimated bearing capacity standard deviation for h simulations dBSoil sounding distance from the center of a rectangular foundation measured along the longer dimension dB,optOptimal location of the soil sounding (dBfor which σBis minimized) Supplementary data to this article can be found online at https://doi.org/10.1016/j.jrmge.2021.01.007.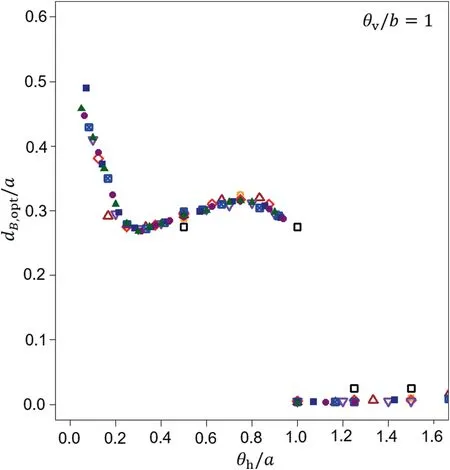


6.Conclusions
Declaration of competing interest
Appendix A.Supplementary data
 Journal of Rock Mechanics and Geotechnical Engineering2021年3期
- Journal of Rock Mechanics and Geotechnical Engineering的其它文章
- Uncertainties of thermal boundaries and soil properties on permafrost table of frozen ground in Qinghai-Tibet Plateau
- Effect of natural and synthetic fibers reinforcement on California bearing ratio and tensile strength of clay
- Engineering and microstructure properties of contaminated marine sediments solidified by high content of incinerated sewage sludge ash
- Effects of oil contamination and bioremediation on geotechnical properties of highly plastic clayey soil
- Modification of nanoparticles for the strength enhancing of cementstabilized dredged sludge
- Rock-like behavior of biocemented sand treated under non-sterile environment and various treatment conditions
