How believable are published laboratory data? A deeper look into system-compliance and elastic modulus
Aly Abdelaziz,Giovanni Grasselli
Department of Civil and Mineral Engineering,University of Toronto,35 St.George Street,Toronto,Ontario,M5S 1A4,Canada
Keywords:System-compliance Elastic modulus Stress-strain Compressive strength of rock
ABSTRACT Elastic modulus (E) interpretation is debatable with limited literature detailing the impact of systemcompliance.To address this impact,a comprehensive testing schedule using an aluminium 6061 (Al)sample is carried out on several systems under various test setups.Al is chosen as it is extruded and adheres to well defined shape tolerances and elastic properties.A robust method,using the Savitzky-Golay filter,is introduced to identify significant slope changes in the stress-strain curve.Since the load in the test system is well defined,the recorded deformation is corrected to the expected value of Al resulting in a system-compliance factor.The results across the testing systems and test setups showed significant variance,with the recorded E always lower than the anticipated EAl.The number of components within the system over which the deformation is measured had the most significant impact,lowering the expected E by up to 50%.Additionally,the system-compliance factor is inconsistent across different systems and setups.Thus,it is evidently proved that each setup must be separately evaluated for its system-compliance and that no single value exists across systems and setups.The findings are then projected onto a series of uniaxial compressive strength(UCS)tests carried out on Stanstead granite(SS GR)samples.The corrected Et50 and Eavg values for system-compliance of the samples are within±1%for each system as opposed to being ±50% pre-correction.The findings conclude that it is deemed necessary and of utmost importance that the deformation be corrected to accommodate the systemcompliance to obtain reliable results.
1.Introduction
The interpretation of laboratory tests carried out on rocks and the influence of testing apparatus on the elastic response of rocks has been a topic of debate amongst engineers for decades.The mechanical characteristics for isotropic and anisotropic rocks that are of paramount interest are uniaxial compressive strength(UCS),confined compressive (triaxial) strength,tensile strength,elastic modulus(E),and Poisson’s ratio(ν).The UCS is usually determined by the peak load required to cause failure of the sample.However,the analysis of E is ambiguous and open to various interpretations.E is calculated by evaluating the slope of the stress-strain curve obtained during loading of an instrumented compression test,with the most commonly accepted testing methods of the International Society for Rock Mechanics and Rock Engineering (ISRM)(Bieniawski and Bernede,1979) and American Society of Testing and Materials (ASTM) (ASTM D7012-14e1,2014).These methods recommend that the tangent Young’s modulus(Et),average Young’s modulus (Eavg),and/or the secant Young’s modulus (Es) should be reported as they are the most common in engineering practice.A typical evaluation of the various elastic moduli for a Stanstead granite(SS GR)sample,uncorrected for system-compliance,at 50%of the maximum stress is depicted in Fig.1.
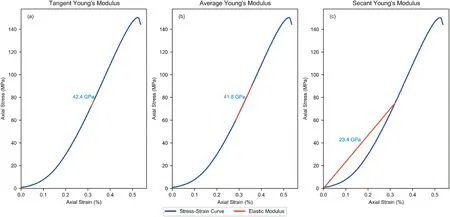
Fig.1.Stress-strain curves(uncorrected for machine compliance)of a UCS test on a SS GR sample showing the difference between the(a)tangent Young’s modulus(Et),(b)average Young’s modulus (Eavg),and (c) secant Young’s modulus (Es).The red overlay indicates the portion over which the elastic modulus was calculated.
It is important to note that Esmay not be representative of rocks as it is highly influenced by the initial nonlinear portion of the stress-strain curve,which is not descriptive of the response of the rock over its linear elastic range,whereas,Etand Eavgwhen measured over the same linear range,usually provide comparable results.A similar observation was reported by Małkowski and Ostrowski (2017) and Małkowski et al.(2018) who carried out an in-depth study on the variations and impacts associated with the methodology used to derive the Young’s moduli.The strain was recorded using linear variable differential transformers(LVDTs)and their findings indicated that based on the method of interpretation,Eavgand Esdiffered by 36%-56%and Eavgand Et(20%-80%)differed by 6%-15%.Their work concluded that the Young’s modulus,as an elastic parameter,should only be applicable over the elastic portion of the stress-strain curve and that Es,inherent to the method of its assessment,includes the initial phase of rock deformation common to crack closure and pore collapse.Hsieh et al.(2014) also carried out assessment of Esby testing samples under cyclic loading and using a series of strain gauges,placed at the mid-height of the sample,to measure the axial deformation.They concluded that the“compaction”introduced into the sample causes an increase in the secant modulus and that the elastic portions of the stress-strain curve may be ill representative of the real rock behaviour.In this article,emphasis is given to the commonly accepted testing standards(Bieniawski and Bernede,1979;ASTM D7012-14e1,2014)and assessment of Eavgand Etas they represent the elastic response of the tested rock.
From a rock mechanics and geotechnical engineering perspective,E is a fundamental parameter in foundation element settlement calculations as well as in estimating the stress distribution in underground mine pillars and underground openings,such as tunnels.Additionally,in numerical modelling,it is an essential and integral part of the model parameterisation.Finite element method(FEM) simulations require elastic parameters to analyse deformation of a body subjected to various loads/strains.In the discrete element method(DEM)(Cundall and Strack,1979),E is a descriptor of the material property that has considerable effects on the postcollision path of particles (Chen et al.,2017).In the hybrid finitediscrete element method (FDEM) (Mahabadi et al.,2012),the elastic properties of the mesh elements,which describe the material property,affect the deformability of the system prior to fracturing.
Experimentally,the two components of the stress-strain curve in compression required to calculate E are obtained through the axial displacement(axial deformation)and the corresponding axial load (axial force) occurring in the system.The load application in the testing frame is achieved by an actuator that moves a platen,transferring the load through the system(i.e.sample,pedestal,and buffers/spacers,if any,being used).Commonly,the applied load is measured using either a proving ring or the more widely available load cell resting between the platen,sample,and the system.Other testing configurations also allow for the use of pressure transducers adjacent to the loading piston,converting the applied pressure in the system to load.Since the system is in equilibrium,it is assumed that the internal forces are constant throughout with no significant losses.In other words,the load in the system is well defined and known.
To measure axial deformation,both the ASTM and ISRM recommend the use of either electrical resistance strain gauges or LVDTs.At least two deformation devices should be used,equally spaced along the circumference,and close to the mid-height of the sample.The use of strain gauges,although highly accurate,requires expertise as well as precision installation.However,even with meticulous installation,the strain gauges only measure localised strain and adhesion problems occur when samples have excessive moisture or the sample has a loose surface (Bieniawski and Bernede,1979;Burland,1989;Kim et al.,1994;Montero et al.,2011).Additionally,the strain gauge measurements are biased to the length over which they are installed (gauge length) and the results are skewed if the fracture initiates or occurs near the gauge length (Závacký andtefaák,2019).Hence,they are more applicable in the case of small strains or in the case that localised strain is of importance.An alternative industry practice to measure axial deformation is to place an LVDT on a reference beam with the tip against the moving platen,while others use the actual advance of the actuator (cross-head movement) of the constant rate of extension (CRE) machine.These alternative practices are not recommended as the displacement is not actually measured across the tested sample,but rather the deformation of the entire system.However,the latter is investigated in this work to validate its adequacy.
In the past 50 years or so,research that addresses the factors affecting laboratory rock strength testing focused mainly on the sample slenderness,size,and stringent sample tolerance (e.g.Hoskins and Horino,1968;Hawkes and Mellor,1970;Brown and Cook,1971;Tsur-Lavie and Denekamp,1982;Pells and Ferry,1983;Martin and Stimpson,1994;tambuk Cvitanovi´c et al.,2015;Liang et al.,2016).However,research that addresses the overall performance of laboratory testing systems is seldom with very limited literature pertaining to the importance of systemcompliance and its impact on the recorded strain during testing.For example,Tatsuoka et al.(1994) carried out a series of drained triaxial tests on mudstone and reported a difference of about 10 times between the locally (strain gauges) and externally (LVDT)measured axial strains.Kim et al.(1994)acknowledged the impact and importance of system-compliance when testing softer rock because of the interface of the loading piston and sample cap.To limit this impact during monotonic tests,the system was modified,maintaining a rigid connection among the load cell,loading piston,and sample cap.However,there was no quantitative assessment on the impact of the used setup.More recently,Herrmann et al.(2018)stated that the recorded displacement,and ultimately strain,were corrected for system-compliance by about±6%resulting in Es(0-50%)varying by ±13% and ±20% for uniaxial and triaxial conditions,respectively.However,there was no mention of the details of the overall setup or the procedure for correcting for systemcompliance.In soil mechanics,the issue of the systemcompliance is far more significant and has been extensively discussed (e.g.Obert et al.,1946;Hudson et al.,1972;Burland,1989;Kim et al.,1994;Cuccovillo and Coop,1997;Kuhinek et al.,2011;Herrmann et al.,2018).The significance comes as the measured strains are small to an extent where true strain in soils is masked by system-compliance errors resulting in a poor definition of the stress-strain behaviour and soil stiffnesses far lower than those inferred from field behaviour(Burland,1989;Cuccovillo and Coop,1997).This pointed researchers towards evaluating/comparing strain measurement devices and proposing new,more accurate,and more precise equipment to measure strain (a comprehensive review is found in Scholey et al.(1995));however,there was no attempt to quantitatively delineate and evaluate the measurements.
The above alludes to the fact that interaction among the various components in the testing system and the contrast in their deformation,to accommodate the load transfer,leads to higher deformation readings than expected.Since its release in 2004,superseding ASTM D2938-95 (1995),D7012-14e1 (2014)only started vaguely addressing the topic of apparatus deformation interfering with the results of rock tests in the 2014 version editorial change 1 (Note 12).The interference could be attributed to spacers,non-flatness of contact surfaces,excessive drainage on the sample surface,addition of drainage layers,system alignment (i.e.alignment of sample in relevance to the test frame),stiffness between the joints and interfaces,as well as excessive compression of the loose disturbed layers at the sample ends formed during trimming (occasionally termed as bedding error)(Obert et al.,1946;Burland,1989;Kim et al.,1994;Kuhinek et al.,2011;Herrmann et al.,2018).In addition,the complexity of the test setup would be dependent on the test frame and device used to measure the deformation as well as gauge length.Even with a presumably perfect system and sample,the tolerances of the machine parts and platens can impact the strain,especially strain at the macroscopic level(Korinets and Alehossein,2002).It is apparent that the controversy lies over the use of external(e.g.LVDT) or more localised,commonly referred to as internal measurement (e.g.strain gauges) systems for the monitoring of strain during testing.
Interpretations of the stress-strain curve are also seen in the determination of the brittleness index.Coates and Parsons(1966)and Hucka and Das (1974) evaluated the area under the stressstrain curve to interpret brittleness.Rybacki et al.(2016) reported that the estimated error in brittleness caused by systemcompliance was less than 4% on conventional triaxial equipment and less than 20% when using the Paterson apparatus (Paterson,1970).Holt et al.(2011) attributed the difference in brittleness parameters to the inter-laboratory results,although the loading machines used were servo-controlled CRE hydraulic load frames,neglecting the possibility that this inter-laboratory discrepancy could be attributed to ignoring system-compliance effects.
The work presented herein was driven by the“consistent inconsistency”in the laboratory results carried out on samples obtained from the same core drilled out of a SS GR block.The samples,where possible,were prepared in compliance with ASTM D4543-08 (2008) and tested (ASTM D7012-14e1,2014) in two laboratories for quality control purposes.Across the laboratories,the UCS values were consistent;however,the reported interlaboratory elastic modulus showed major discrepancy and inconsistency.In this paper,we highlight that,although strain measurements are different for different test setups,when corrected for system-compliance,the strain over the linear-elastic region up to failure is within comparable ranges.Hence,we do not address the efficiency of the strain measuring methods/devices and/or end effects and sample dimension tolerances,but rather emphasise that the delineation and interpretation of the results,irrespective of the test setups and strain measuring methods/devices used,may be the cause of the discrepancy in inter-laboratory test results.Provided that the samples are prepared in compliance with ASTM D4543-08(2008),we show that the absence of system-compliance correction leads to severe underestimation of E.The paper describes a systemcompliance evaluation methodology that can be adopted for any test setup.The results are then presented,and a robust analysis procedure is introduced to evaluate several test setups using dummy aluminum samples.The quality of the experiments is ascertained through a series of repeatability and reproducibility tests.This procedure is then adopted to correct the results of the SS GR.Conclusions are then presented detailing the importance of system-compliance and the implications it has on the estimation of E of the tested material.
2.Methods
To maintain repeatability and ensure that the measured values are true,the used material should be homogeneous,free from defects,comply with very tight shape tolerances,and have very well defined mechanical properties.For this,we choose high-precision tight-tolerance 6061 multipurpose extruded aluminum rod (Al 6061) heat-treated to a T6 temper,referred to as Al sample hereafter.The extensive use of this alloy,especially in the aviation industry,inherently requires it to adhere to stringent specifications and tolerances.The rods are extruded such that they are held to strict straightness tolerances while complying with ASTM B211/B211M-19 (2019).The material is typically known to have a density of 2.7 kg/cm3at 20°C,a Young’s modulus (EAl6061) in compression of 69.7 GPa,and a yield strength (at 0.2% offset) of 240 MPa(ASM International,1990).
The impact of system-compliance is presented through a comprehensive testing scheme.A 2-inch(1 inch=2.54 cm)Al rod was tested in compression using different frames (systems),test setups (i.e.spacers),spherical seated platens,and deformation measurement methods (Fig.2).The sample,spherical seat,and spacers were centred as accurately as possible to one another and to the loading frame.Although the reference Al is fitted with strain gauges to measure local strain,the data were not evaluated.The results of the strain gauges placed on rock samples are known to be biased towards microscopic features within the sample and only measure microstrain along their length (Závacký andtefaák,2019).The interest here is towards the strain at the engineering scale,characterised by the strain at a macroscopic level.Hence,the methods below detail the system-compliance to appropriately determine the macroscopic strain.The Al sample tested adhere to the desirable length to diameter ratio of between 2:1 and 2.5:1(ASTM D7012-14e1,2014).The variations within each test setup are elaborated in their respective sections (Fig.2).In all setups,load was applied up to about half the yield strength of the Al sample(i.e.about 100-140 MPa).
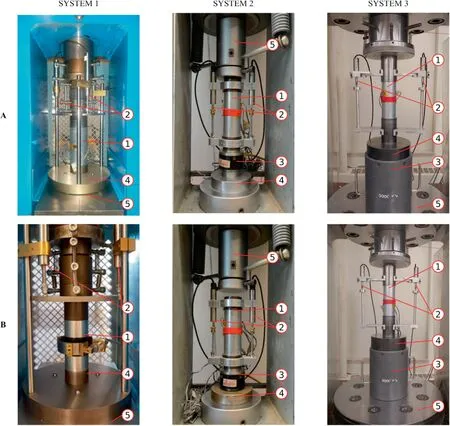
Fig.2.The various systems used typically comprising of Al 6061 sample(1),LVDTs(2),load cell(3),spacer(4),and moving actuator(5)applying deformation.In System 1,load is captured through a pressure transducer;and in System 3,displacement is also captured through the actuator advancement.
2.1.System 1
The system consists of a 150 t (1.3 MN) Forney loading frame equipped with a pressure-compensated manual control valve to maintain an axial rate of extension of approximately 0.15 mm/min(Fig.2 -System 1).Load is measured using an OMEGA pressure transducer,while deformation measurements are recorded using an external system (EX) comprising of three individual OMEGA LVDTs.Each LVDT is connected to its respective digital acquisition channel having an acquisition rate of 3 Hz.The Al sample tested was 47.41 mm in diameter and 95.27 mm in length.The testing platens consisted of a spherical seated top platen and a fixed base bottom platen.System-compliance was checked for unconfined compression using two different test configurations.Different pedestal and bottom spacer combinations were used to conduct tests on this system(Fig.2 -Systems 1A and 1B).
2.2.System 2
A stiff loading frame equipped with a hydraulic pump is used to advance the loading piston at an extension rate.The pump is controlled using a manual control valve.A Transducer Techniques CLC-100K load cell capable of measuring up to 450 kN,mounted below the sample and platen,measures the axial force.Axial deformation is measured using two LVDTs,manufactured by LD Sensors Ltd.The three sensors are connected to a digital acquisition system (ICP DAS I-7016).A similar platen setup to System 1 was used.The Al sample used was different and had dimensions of 50 mm in diameter and 120 mm in length.In this section,tests were carried out using different pedestal and spacer combinations(Fig.2 -Systems 2A and 2B).The data obtained from the data acquisition box(DAQ)are known to have a delay causing the same value to be queried over an interval of approximately 0.8 s,as such step-like data are obtained from the readout.Curve smoothing is applied to the data by dividing the displacement into a linear onedimensional array and returning the values of the load.This is followed by applying a third degree polynomial Savitzky-Golay filter (Savitzky and Golay,1964;Savitzky,1989).Hence,when viewed independently,the axial displacement appears to be perfectly linear.
2.3.System 3
This system involves the use of a rigid servo hydraulic MTS 815 load frame.Load is captured through the use of a 3000 kN MTS force transducer (load cell).The frame assembly houses a single-ended actuator with an internal LVDT that provides control and measurement of actuator displacement (ACT).Axial displacement is also recorded externally using two OMEGA LVDTs(Fig.2-Systems 3Aand 3B).The acquisition rate of the DAQ is 10 Hz.A similar platen setup to System 1 and the same Al sample to System 2 were adopted.In this section,tests were carried out under unconfined conditions using different pedestal and spacer combinations(Fig.2-Systems 3A and 3B).In addition,comparisons are made between the global(GL)and external(EX)measurement recordings(i.e.the deformation recorded by the frame’s internal actuator LVDT and the externally mounted LVDTs).The actuator advances in a true servo-controlled CRE mode at a rate of 1 μm/s;hence,when viewed independently,the axial displacement recorded by the internal actuator LVDT is linear.
3.Analysis
The raw load and displacement are plotted independently,in the time domain,to understand the response of the tested Al sample.The displacement is presented as the average of the LVDTs used in the system.The recorded data are processed as a digital signal in order to derive the points on the curve that exhibit a distinct change in slope.The data are plotted,and the second derivative is obtained.Data smoothing is then applied using a second degree Savitzky-Golay filter (Savitzky and Golay,1964;Savitzky,1989),which increases data precision by eliminating multiple peaks while preserving the trend in the data.Half the magnitude of the global maximum of the resulting filtered curve is used as a proxy to identify local maxima/minima using a pre-defined window length(WL).The beginning and end of each crest/trough,over the pre-defined WL,are obtained as the intersection of the filtered signal with the proxy line.The mid-point of that section is defined as the local maxima/minima corresponding to the location on the curve where there is a distinct change of slope.These mid-points are overlain on their respective load and displacement curves as dots.To determine the impact of the WL,a sensitivity analysis is independently conducted for the raw load and displacement.The WL where the number of points is identified as a change in slope plateaus with no significant impact on the attained E is selected.
Adopting this procedure allows the identification of three distinct sections in the stress-strain curve.The first section(S1)is a straight portion where the sample does not experience any significant increase in load and this is considered the approach of the actuator contacting the Al sample,analogous to the seating allowed by ASTM D7012-14e1 (2014) Clause 9.The second section (S2) is characterised by an instantaneous nonlinear increase in load which is a result of the initial contact between the platen and the sample and/or closure of pre-existing fractures (Wawersik and Fairhurst,1970;Cook et al.,1984).The third portion (S3) is considered the linear response of the tested Al sample.
Two approaches are considered for the evaluation of the elastic modulus from the stress-strain curve.In the first approach,the slope is evaluated through a linear regression trendline fitted across the entire stress-strain curve recorded.In the second approach,the segments within S3 that exhibit a change in slope are identified.The slope of each segment is calculated considering the first and last values of the stress and strain within that segment.The slopes of the various segments are averaged giving rise to the average slope in S3.It is worth noting that sections S1 and S2 have no impact in the second approach.
The two approaches can be corrected either by compensating the individual values for displacement as a function of the applied load,as vaguely discussed in ASTM D7012-14e1(2014)(Method 1-Eq.(1)),or alternatively,the slope can be considered for the correction (Method 2 -Eq.(2)).Method 1 is very valuable when evaluating small strain and is not applicable for strains higher than those measured for the dummy sample (Al in this case).On the contrary,Method 2 is not adequate for small strain but can be applied to any linear range evaluated.The latter will be discussed as the macroscopic strain is that of interest.To evaluate the robustness of the procedure in accommodating any test setup as well as test condition,the results of each system are presented individually and compared against the typical Al 6061 response,and summarised in
Table 1.Methods 1 and 2 are applied as follows,respectively:
(1) To correct for the effect of system-compliance (SCfactor),which is a function of the applied force (F),the expected displacement of Al 6061 (ΔlAl6061) is subtracted from the displacement recorded during the test(ΔlAlsample):

(2) The system-compliance factor (SCfactor) can also be a ratio between the slope of the trendline (Etrendline) or average slope in S3 and the elastic modulus of Al 6061 (EAl6061)which is equal to 69.7 GPa:

3.1.System 1
In the sensitivity analysis for System 1A,the number of points identified as a change of slope is depicted by the red and orange lines for the independently analysed load and displacement,respectively(Fig.3).Both lines seem to plateau at WL above 47.The points identified as a change in slope are projected onto the stressstrain curve.Through a visual examination,wherever these projected points distinctly show the three sections in the stress-strain domain,the average E in S3 is calculated along with the standard deviation.The blue and green bars indicate the average E in S3 when load and displacement are used to identify the changes in slope,respectively (Fig.3).An absence of a bar indicates that the projected points were unable to distinctly show the three sections.
Using the load as a proxy for the change in slope,between WLs of 47 and 95,the average E in S3 is in the range of 42-44 GPa with astandard deviation ranging between ±2 GPa and ±3 GPa.For WL higher than 95,the average E in S3 is in the range of 42-43 GPa with a standard deviation ranging between ±3 GPa and ±4 GPa.Using displacement as a proxy,between WLs of 47 and 95,the average E in S3 is 40 GPa with a standard deviation of±6 GPa.For WL higher than 95,the average E in S3 is 44 GPa with a standard deviation ranging between ±3 GPa and ±4 GPa.
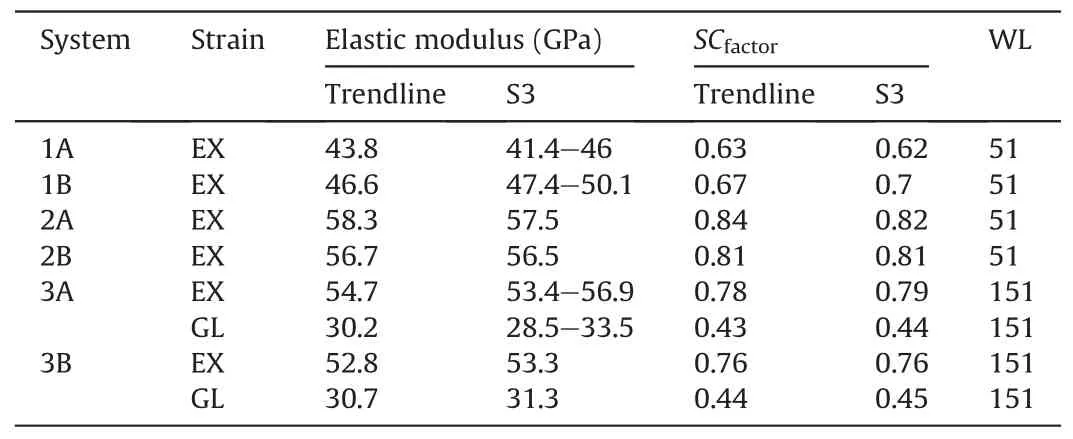
Table 1Result summary of each system.
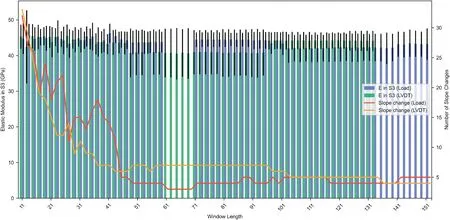
Fig.3.Sensitivity analysis of window length for System 1A.The red and orange lines indicate the number of points identified as a change in slope in the raw curves of the load and LVDT displacement,respectively.The average E in S3 is presented as the blue and green bars evaluated from the raw curves of the load and LVDT displacement,respectively.The black error bars are the standard deviation of E in S3.Absence of a bar indicates that a distinct S3 section in the raw curves was not identified by the Savitzky-Golay filter.
For System 1A,a WL of 51 was adopted using the raw load as a proxy.The points identified as a change in the slope of the raw load curve(Fig.4)are projected onto the stress-strain curve.The slope of the line between those points is then evaluated in the stress-strain domain(Fig.5-blue solid line).For a WL of 51,the slopes within the S3 portion of the curve were 44.1 ± 2.5 GPa.A linear regression trendline fitted to the data exhibited a slope of 43.8 GPa with an R2value of 0.99 (Fig.5 -blue dashed line).Although there is a slight variation in the results,the proximity of the average slope and the trendline in conjunction with the high R2value indicates that the material response is elastic.The stress-strain curve of the tested Al sample is then compared(Fig.5-orange line)and corrected(Fig.5-green line) to that of commonly known physico-mechanical properties of Al 6061,explicitly EAl6061equal to 69.7 GPa.
Since the same data acquisition unit was used for System 1B,a WL of 51 was adopted.The curves of the load and displacement were analysed individually and exhibited sections S1,S2,and S3 which are indicative of the approach,nonlinear deformation,and actual linear axial deformation,respectively(Fig.6).For the WL of 51,the slopes within the S3 portion of the curve were 48.8±2 GPa(Fig.7 -blue solid line).A linear regression trendline fitted to the data exhibited a slope of 46.6 GPa with an R2value of 0.99(Fig.7-blue dashed line).
Since the variations of Etrendlineand the average E value recorded over S3 are similar,Method 2 of assessing system-compliance factor(SCfactor) is adopted.
3.2.System 2
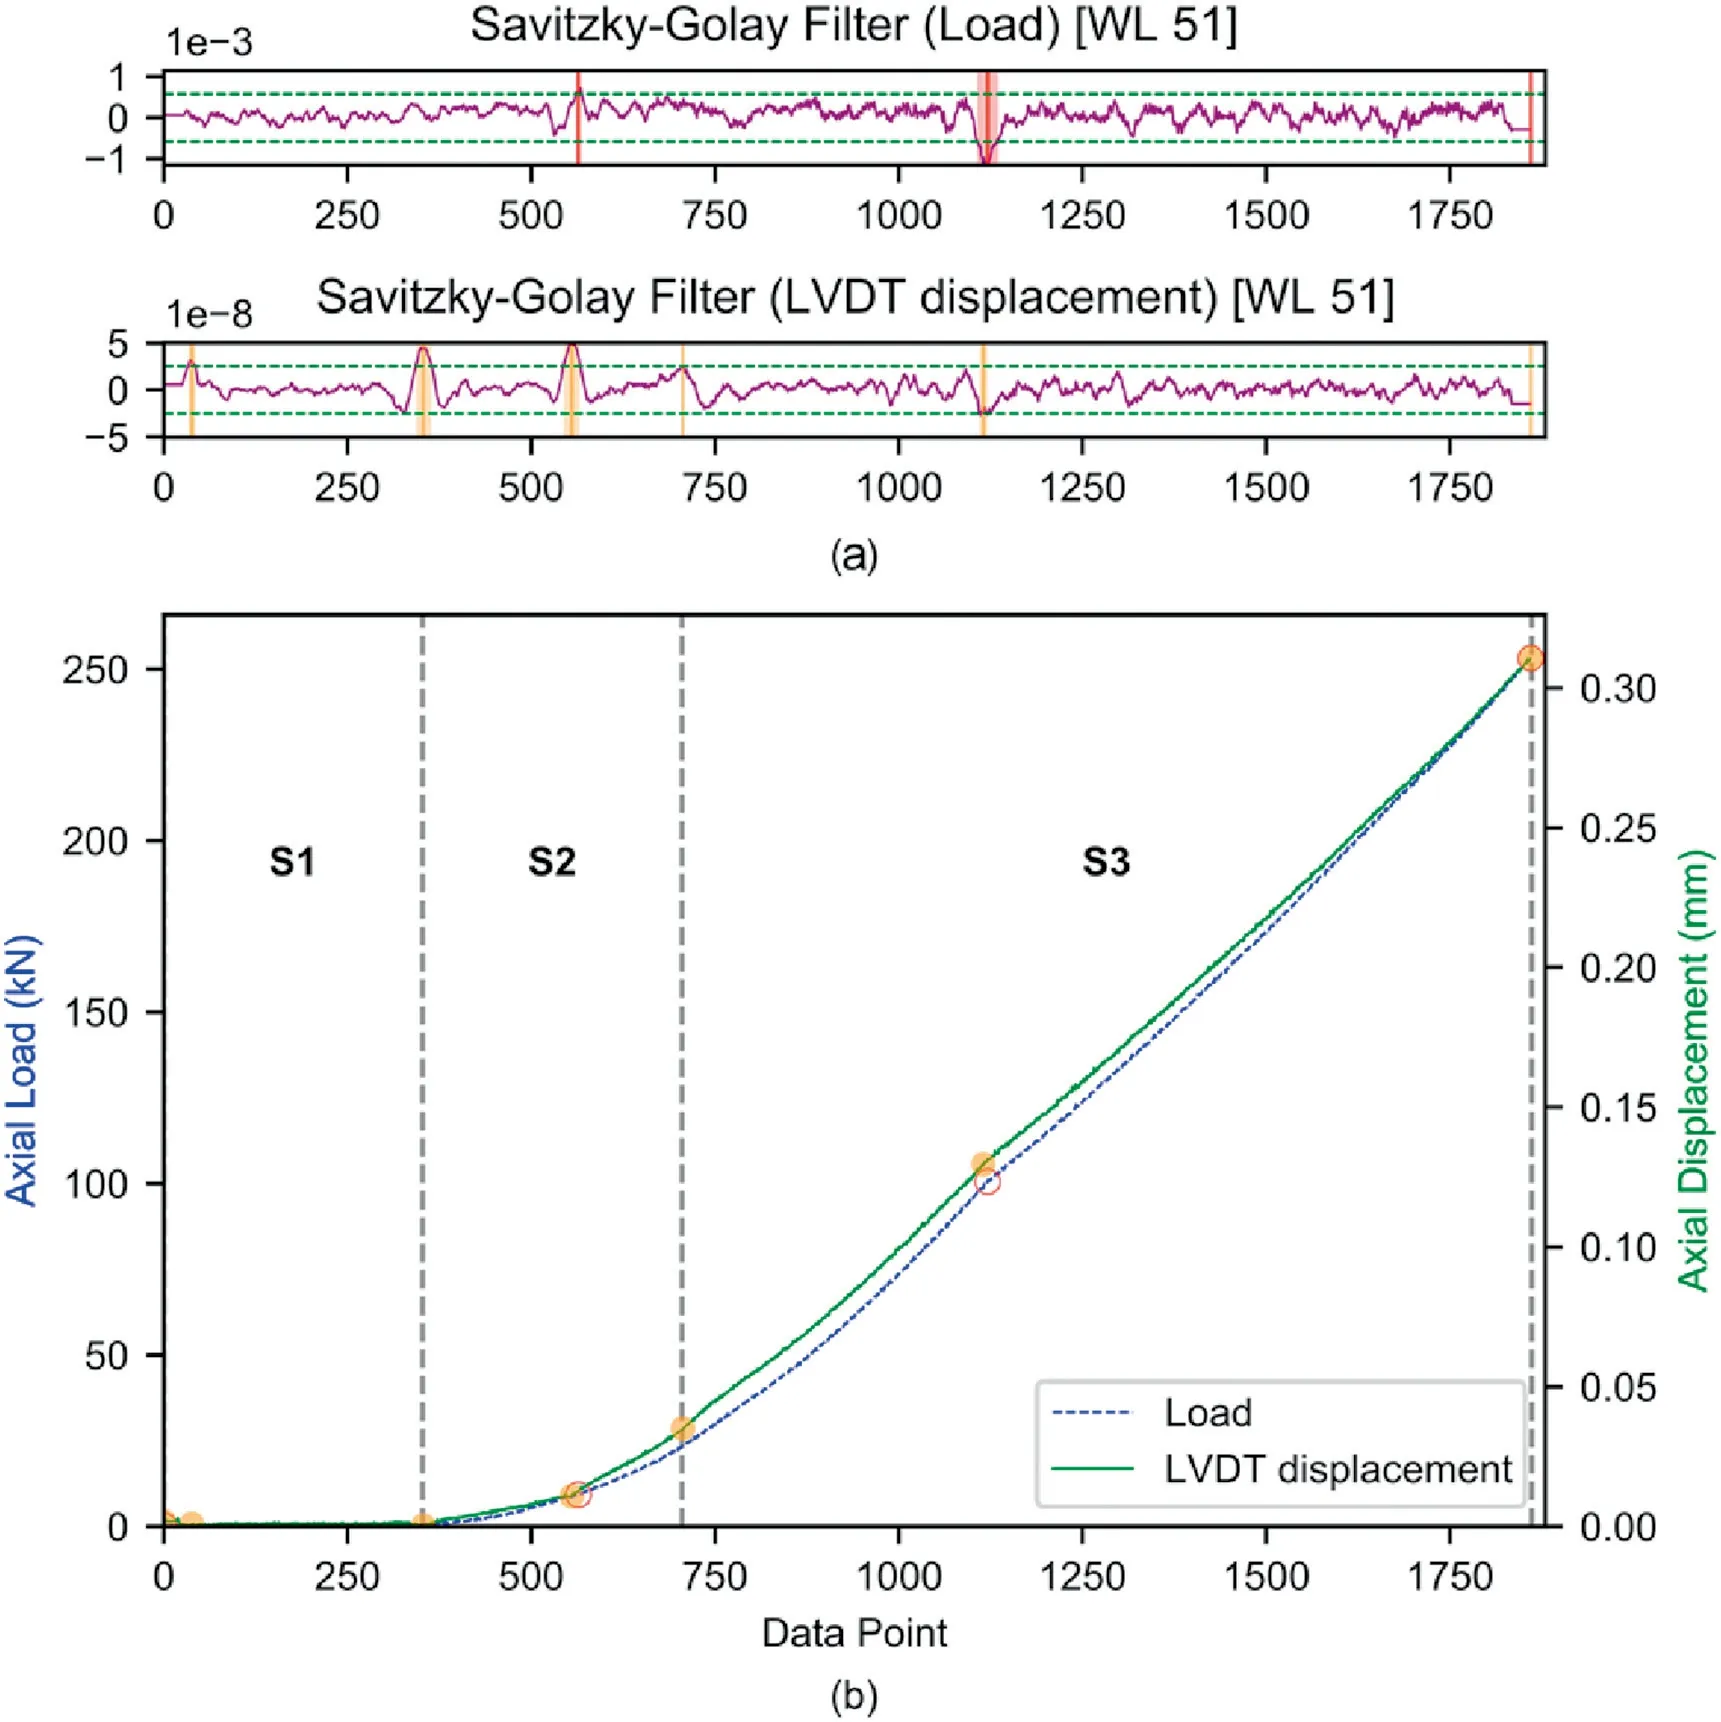
Fig.4.System 1A:(a)Savitzky-Golay filter.The horizontal green dashed lines indicate the proxy lines while the vertical solid lines indicate the mid-point of the local maxima/minima.The shaded areas are the extents of the filter applied for the specific interval.(b) The raw load and displacement curves showing the various sections and the projection (circles) of the mid-point of the local maxima/minima which correspond to a significant change in the slope of the curves.
The sensitivity analysis for System 2A showed a significant drop in the number of points identified as a change of slope plateauing above WL of 31 for both load and displacement (Fig.8 -red and yellow lines).Above WL of 31,using the load as a proxy for the change in slope,the average E in S3 is in the range of 57.5-58 GPa with no standard deviation (Fig.8 -blue bars);while for the displacement proxy,the average E in S3 is in the range of 57.4-57.5 GPa with a standard deviation ranging between±2.5 GPa and±2.8 GPa (Fig.8 -green bars).
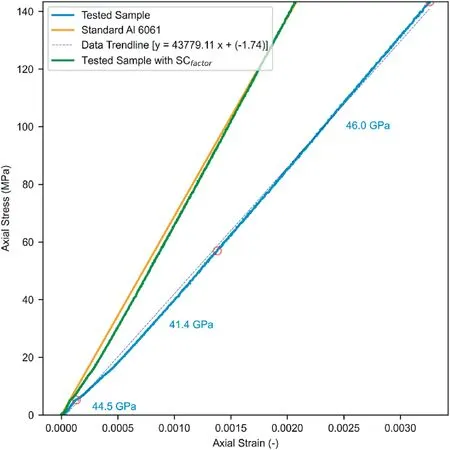
Fig.5.Stress-strain curves of System 1A.The solid blue line indicates the tests’ raw stress-strain curve and the orange line shows the expected stress-strain data of Al.The raw stress-strain curve is then corrected using the trendline (dashed blue line)and transformed to Ecorrected for system-compliance (green solid line).
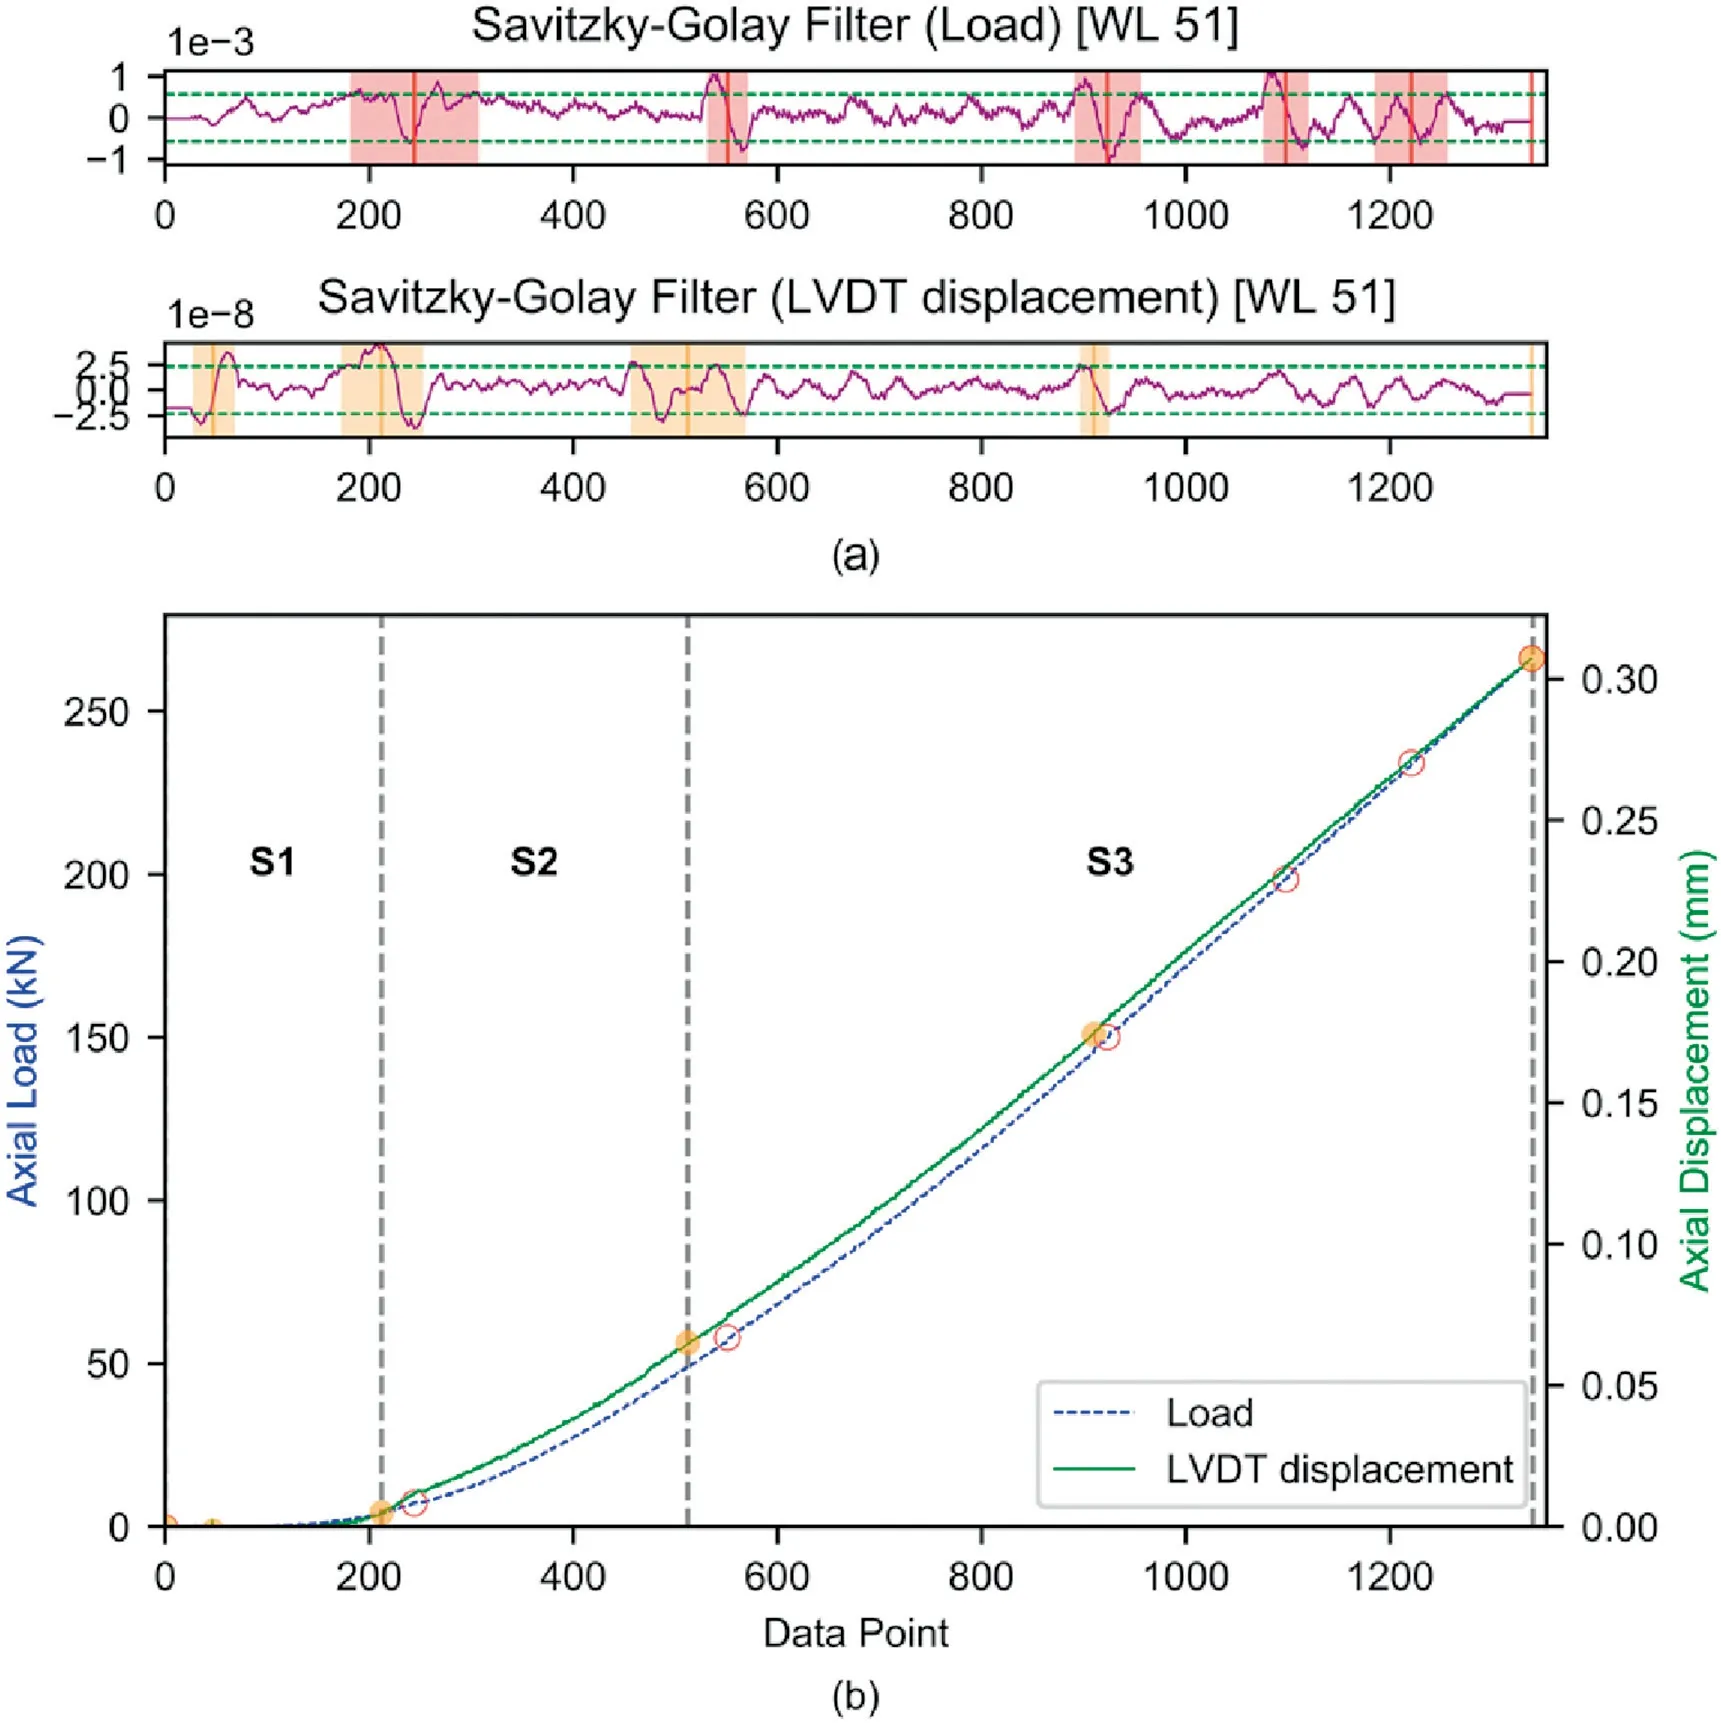
Fig.6.System 1B:(a)Savitzky-Golay filter.The horizontal green dashed lines indicate the proxy lines while the vertical solid lines indicate the mid-point of the local maxima/minima.The shaded areas are the extents of the filter applied for the specific interval.(b)The raw load and deformation curves showing the various sections and the projection(circles)of the mid-point of the local maxima/minima which correspond to a significant change in the slope of the curves.
Since there is no significant impact of the WL above 31,a WL of 51 was adopted for consistency.Similar analysis approaches were adopted for Systems 2A and 2B (Figs.9 and 10).In both setups,although there were distinct S1 and S2 sections (insets in Figs.9 and 10),it was not as prolonged and prominent as System 1.For the WL of 51,the slope of the smoothed curve within S3 was 57.4 GPa and 56.5 GPa for Systems 2A and 2B,respectively(Fig.11-black solid line and Fig.12 -black solid line).A linear regression trendline fitted to the data exhibited a slope of 57.5 GPa and 56.7 GPa with R2values of 0.99 and 0.99 for Systems 2A and 2B,respectively (Fig.11 -blue dashed line and Fig.12 -blue dashed line).Method 2 is also adopted for SCfactor.
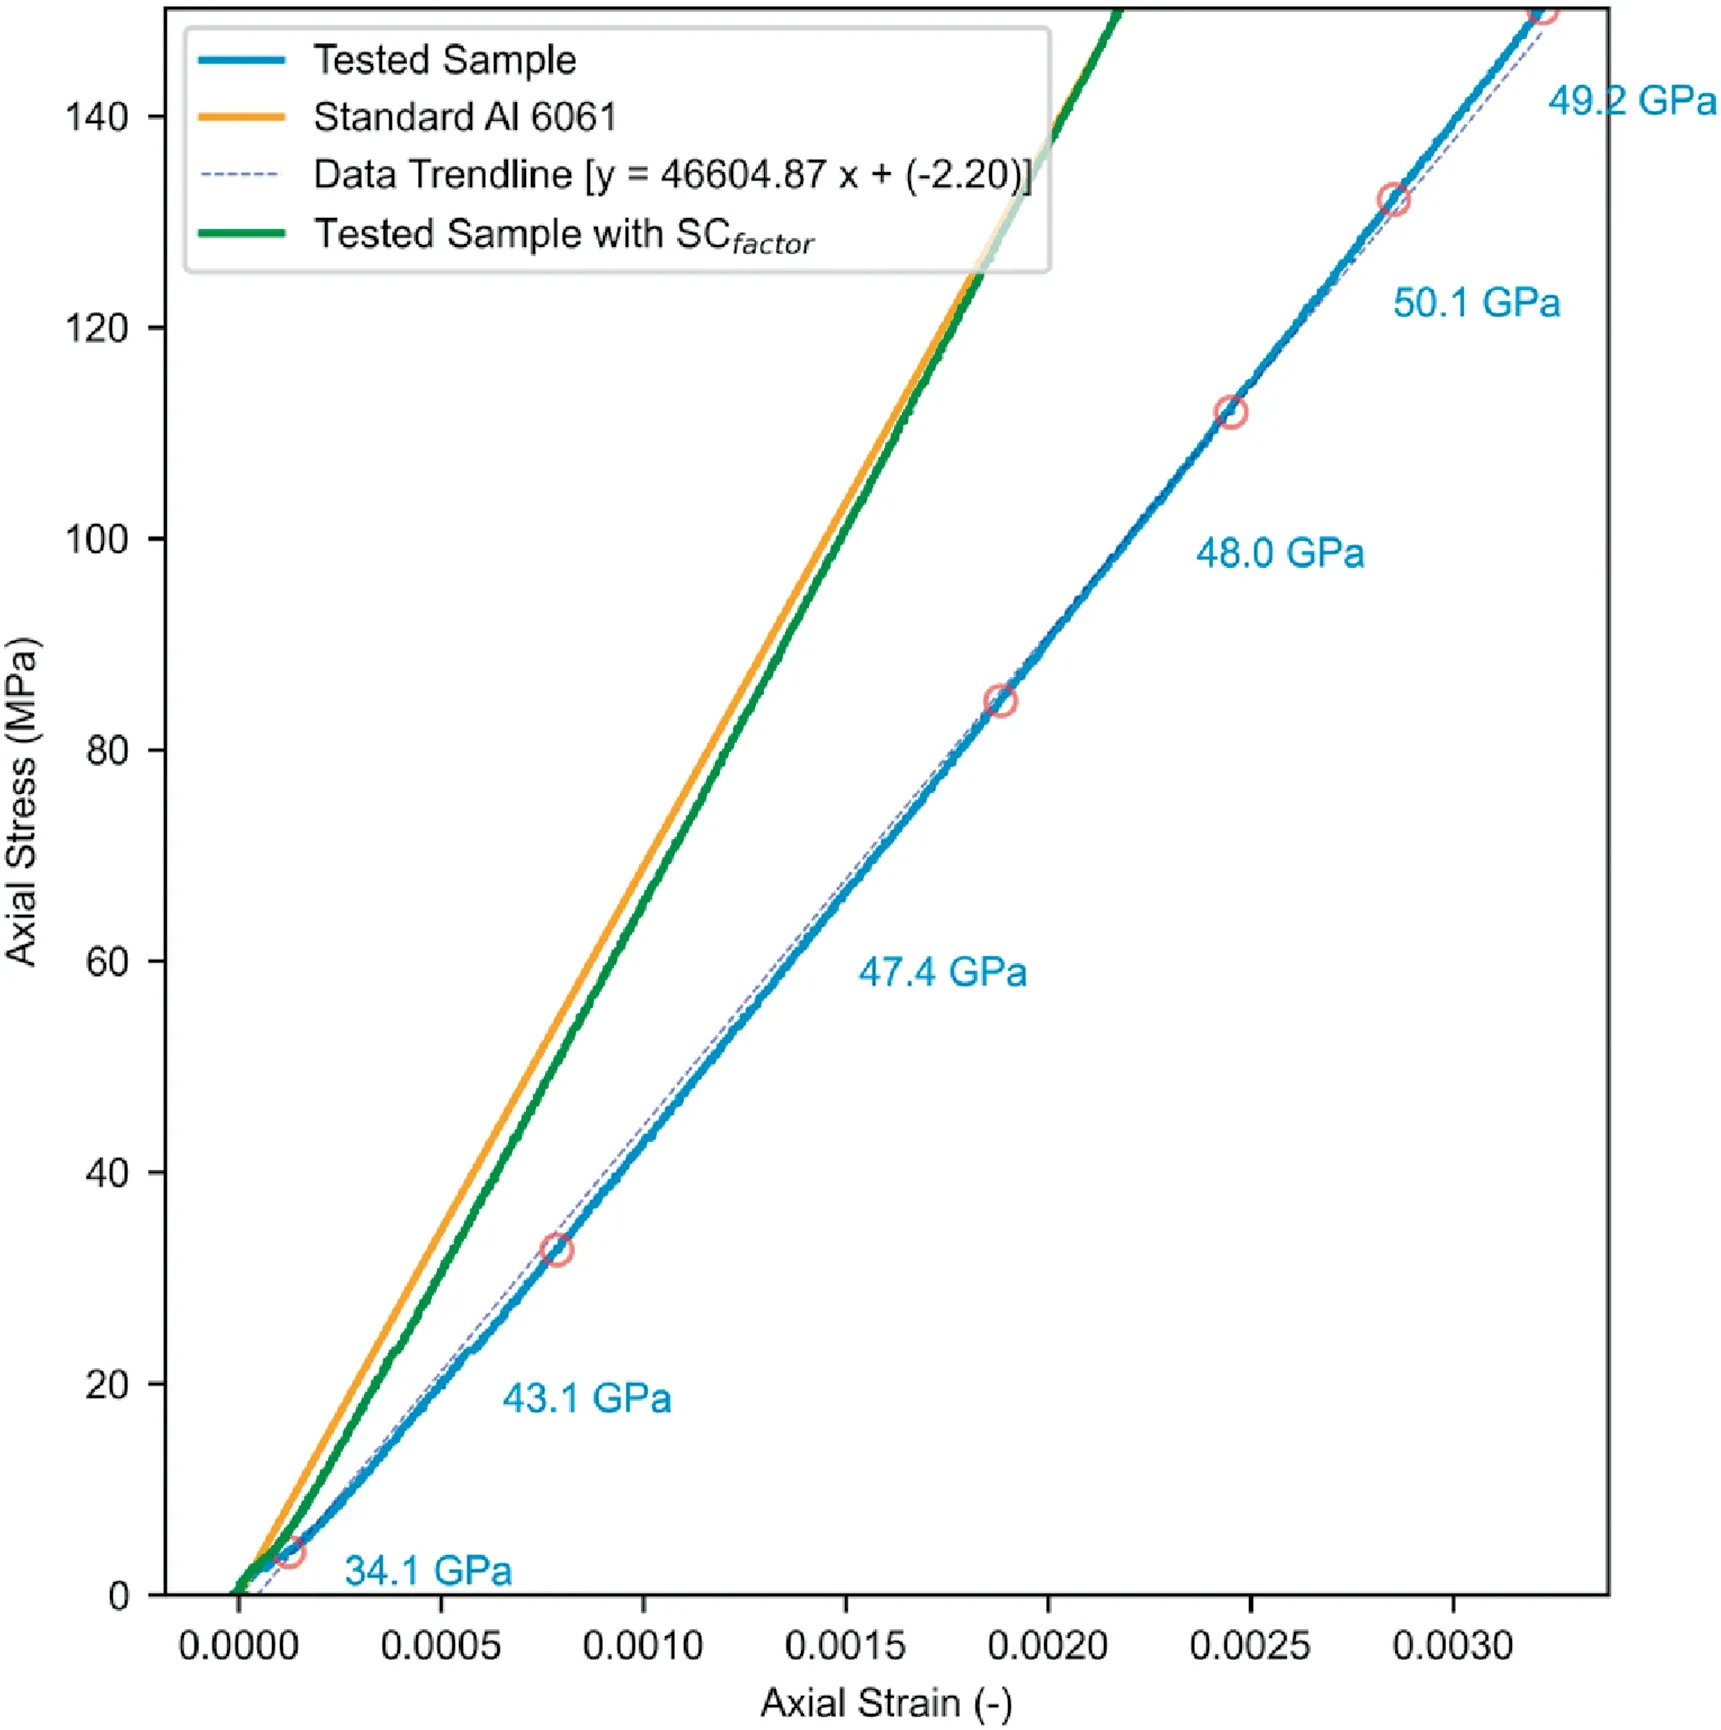
Fig.7.Stress-strain curves of System 1B.The solid blue line indicates the tests’ raw stress-strain curve and the orange line shows the expected stress-strain data of Al.The raw stress-strain curve is then corrected using the trendline (dashed blue line)and transformed to Ecorrected for system-compliance (green solid line).
3.3.System 3
In the sensitivity analysis for System 3A,the number of points identified as a change of slope started to plateau above WL of 143 for load,LVDT displacement,and actuator displacement(Fig.13-red,orange and black lines,respectively).Using load as a proxy for the change in slope,the average E in S3,above WL of 133,is in the range of 53.5-55 GPa with a standard deviation ranging between ±2.3 GPa and ±2.7 GPa (Fig.13 -blue bars).Using displacement as a proxy,the average E in S3 is in the range of 53.8-55.8 GPa with a standard deviation ranging between±1.4 GPa and±2.6 GPa(Fig.13-green bars).Since this system is equipped with a servo-controlled actuator,it is also used as a proxy.Using the actuator displacement as a proxy,the average E in S3 is in the range of 31.7-32.3 GPa with a standard deviation ranging between ±1.1 GPa and ±1.7 GPa (Fig.13 -purple bars).
Based on the sensitivity analysis,a WL of 151 was adopted.The same WL was used to analyse the GL(dotted green lines in Figs.14 and 15) and EX (solid green lines in Figs.14 and 15) deformation recording systems.A similar analysis approach is adopted where the curves of the load and displacement were analysed individually and exhibited sections S1,S2,and S3.However,S1 and S2 are shortened and less prominent as compared to System 1 but are more distinguishable than System 2.A distinct difference is seen between SCfactorof the GL and EX systems.For the GL system,the slopes within the S3 portion of the curve ranged in 28.5-33.5 GPa for Systems 3A (Fig.16 -black solid line) and was 31.3 GPa for System 3B (Fig.17 -black dashed line).The linear regression trendline fitted to the data exhibited a slope of 30.2 GPa and 30.7 GPa with an R2value of 0.99 for both Systems 3A and 3B(black dashed lines in Figs.16 and 17).On the other hand,E over the S3 portion recorded by the EX system ranged in 53.4-56.9 GPa for System 3A and in 53.4-53.3 GPa for System 3B(blue solid lines in Figs.16 and 17).The linear regression trendline fitted to the data exhibited a slope of 54.7 and 52.8 GPa with R2values of 0.99 and 0.99 for Systems 3A and 3B,respectively (blue dashed lines in Figs.16 and 17).
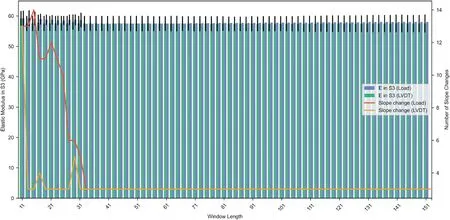
Fig.8.Sensitivity analysis of window length for System 2A.The red and orange lines indicate the number of points identified as a change in slope in the raw curves of the load and LVDT,respectively.The average E in S3 is presented as the blue and green bars evaluated from the raw curves of the load and LVDT,respectively.The black error bars are the standard deviation of E in S3.
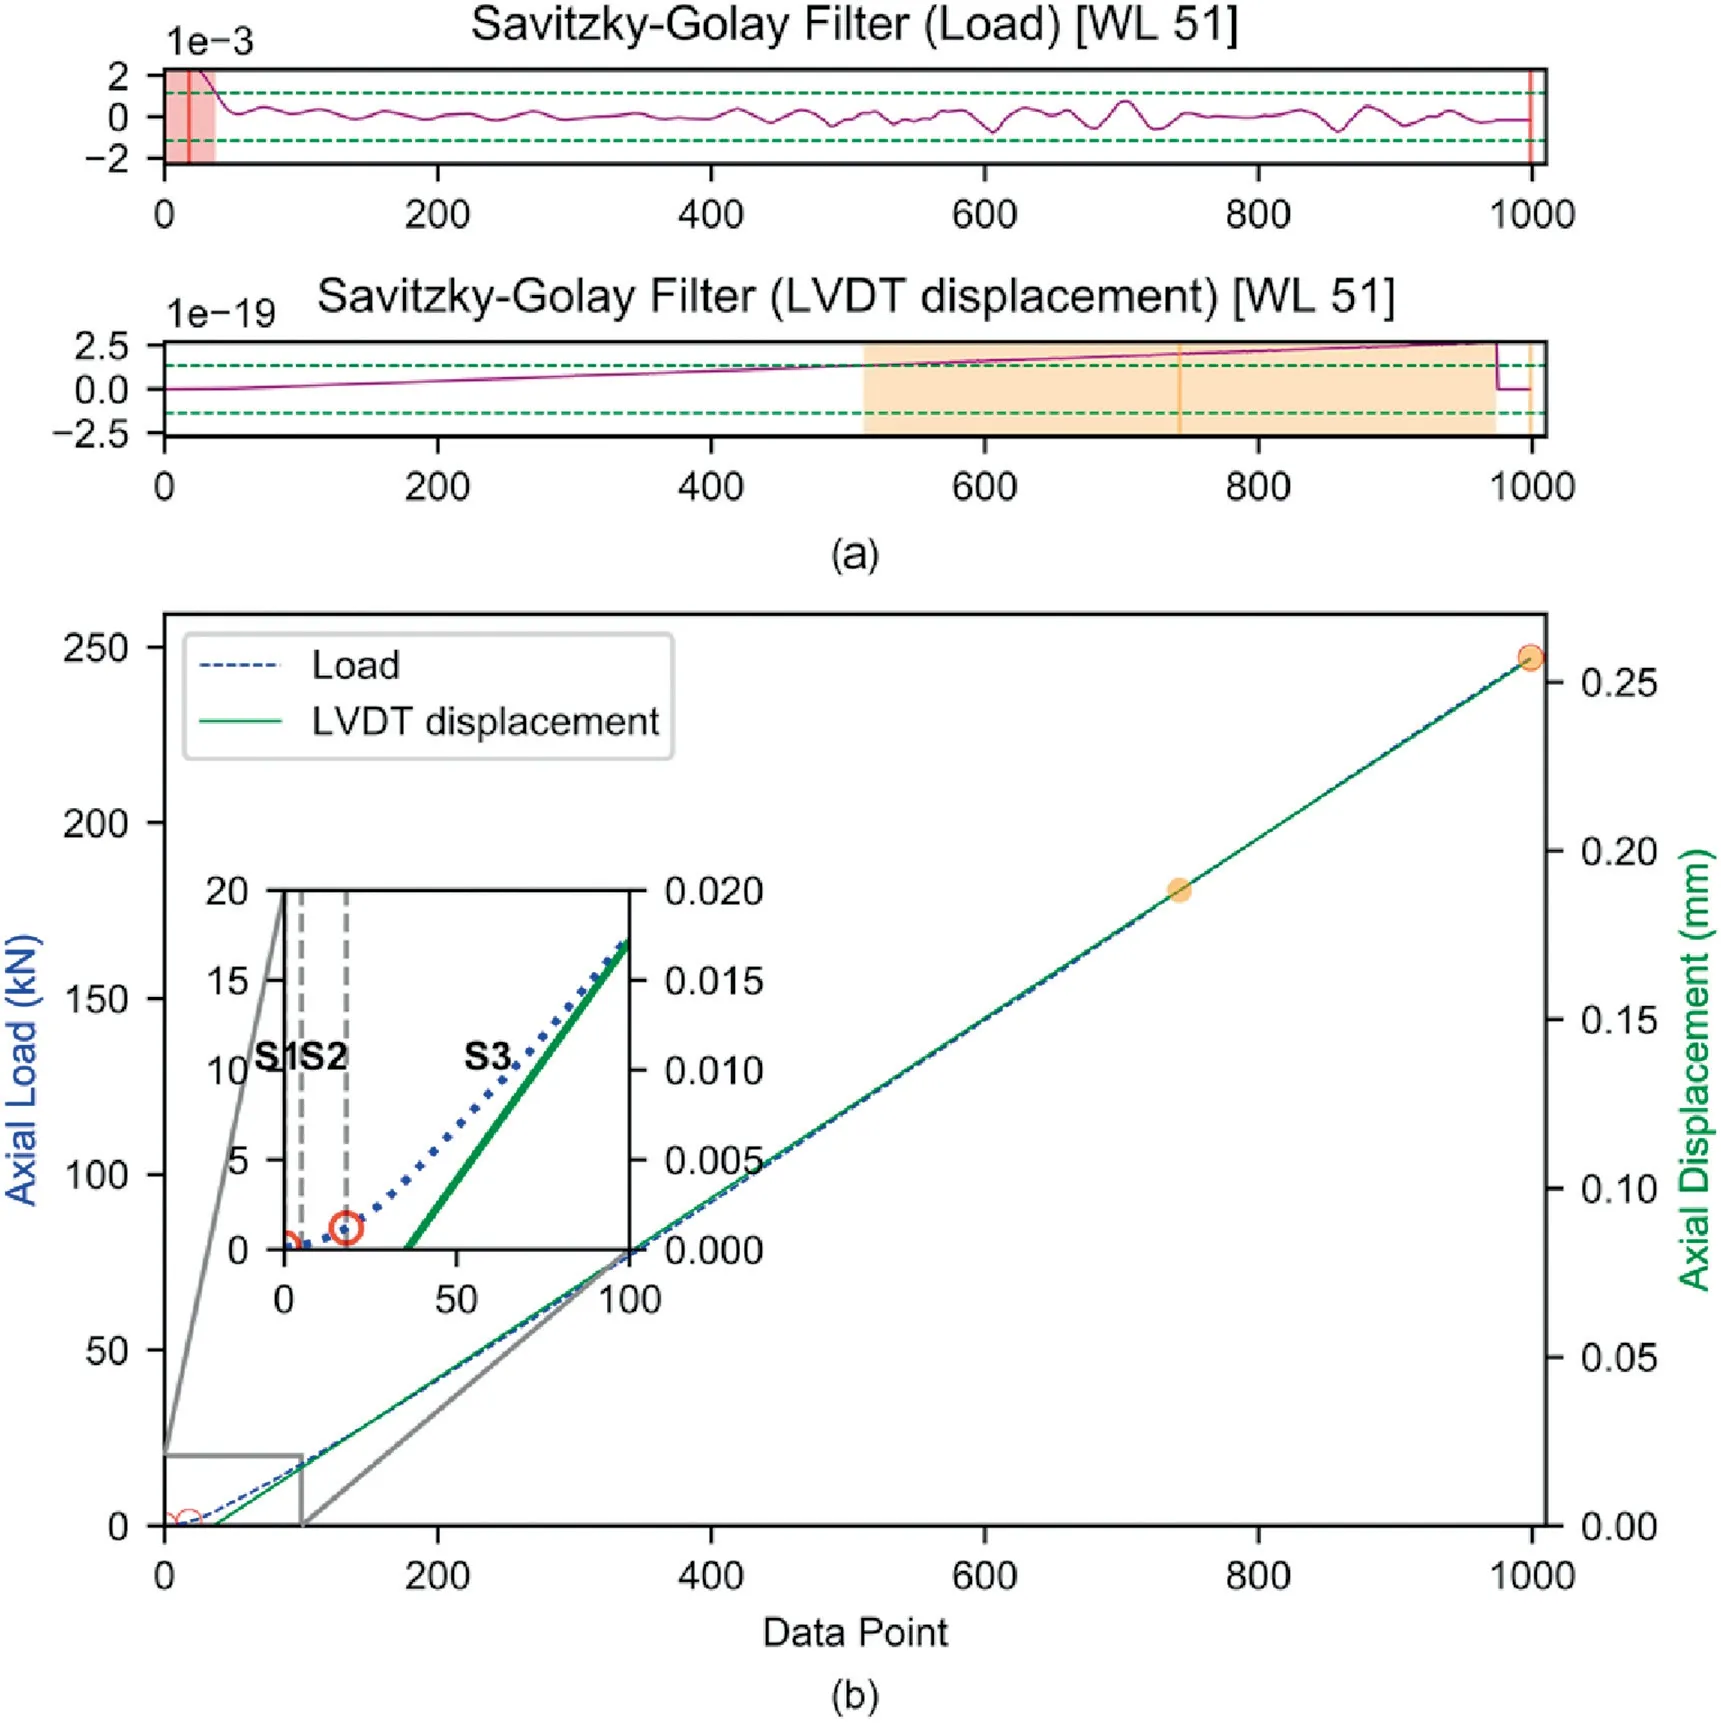
Fig.9.System 2A:(a)Savitzky-Golay filter.The horizontal green dashed lines indicate the proxy lines while the vertical solid lines indicate the mid-point of the local maxima/minima.The shaded areas are the extents of the filter applied for the specific interval.(b)The raw load and deformation curves showing the various sections and the projection(circles)of the mid-point of the local maxima/minima which correspond to a significant change in the slope of the curves.The insets highlight the various sections.
Since the variations of Etrendlineand the average E value recorded over S3 are alike,and similar to Systems 1 and 2,Method 2 for assessing SCfactoris adopted.
3.4.Verification
To ensure that the test procedure and the analysis process were adequate,a series of verification tests was carried out.The aim of these verification tests was (1) to ensure that the same Al sample under identical conditions would produce repeatable results ensuring the adequacy of the Al sample (repeatability),and (2) to ensure that the values were valid for the setup irrespective of the operator(reproducibility).
System 2A (Section 3.2) was chosen for the repeatability test.The same operator carried out three consecutive tests on the same setup,only checking for the overall machine alignment between the second and third tests.The tests were carried out and analysed in a similar manner to System 2A (Section 3.2).Following the repeatability tests,three additional operators tested the same Al sample to check for reproducibility.The test was carried out in a similar manner as System 2A and analysed in exactly the same way.The variation in the S3 slope (Table 2),as compared to the actual test,could be caused by slight misalignment of the sample during the test.This,however,does not significantly impact the SCfactorvalue (Table 2).
4.Discussion
In all the above cases,the results clearly indicate that the reported E was lower than expected;thus,it is evident that the deformation recorded during the test overestimates the actual deformation in the sample.In fact,the comparison between System 3 GL and EX measurements highlights the fact that if the GL displacement is used for the strain calculation,this would result in an approximately 50%lower E.This demonstrates that the number of components in the system over which the strain is measured can significantly impact the results.
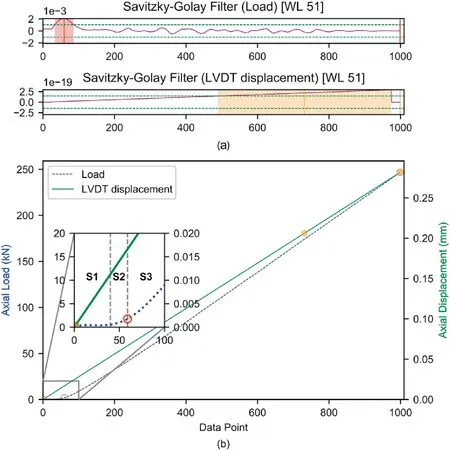
Fig.10.System 2B:(a) Savitzky-Golay filter.The horizontal green dashed lines indicate the proxy lines while the vertical solid lines indicate the mid-point of the local maxima/minima.The shaded areas are the extents of the filter applied for the specific interval.(b)The raw load and deformation curves showing the various sections and the projection (circles) of the local maxima/minima which correspond to a significant change in the slope of the curves.The insets highlight the various sections.
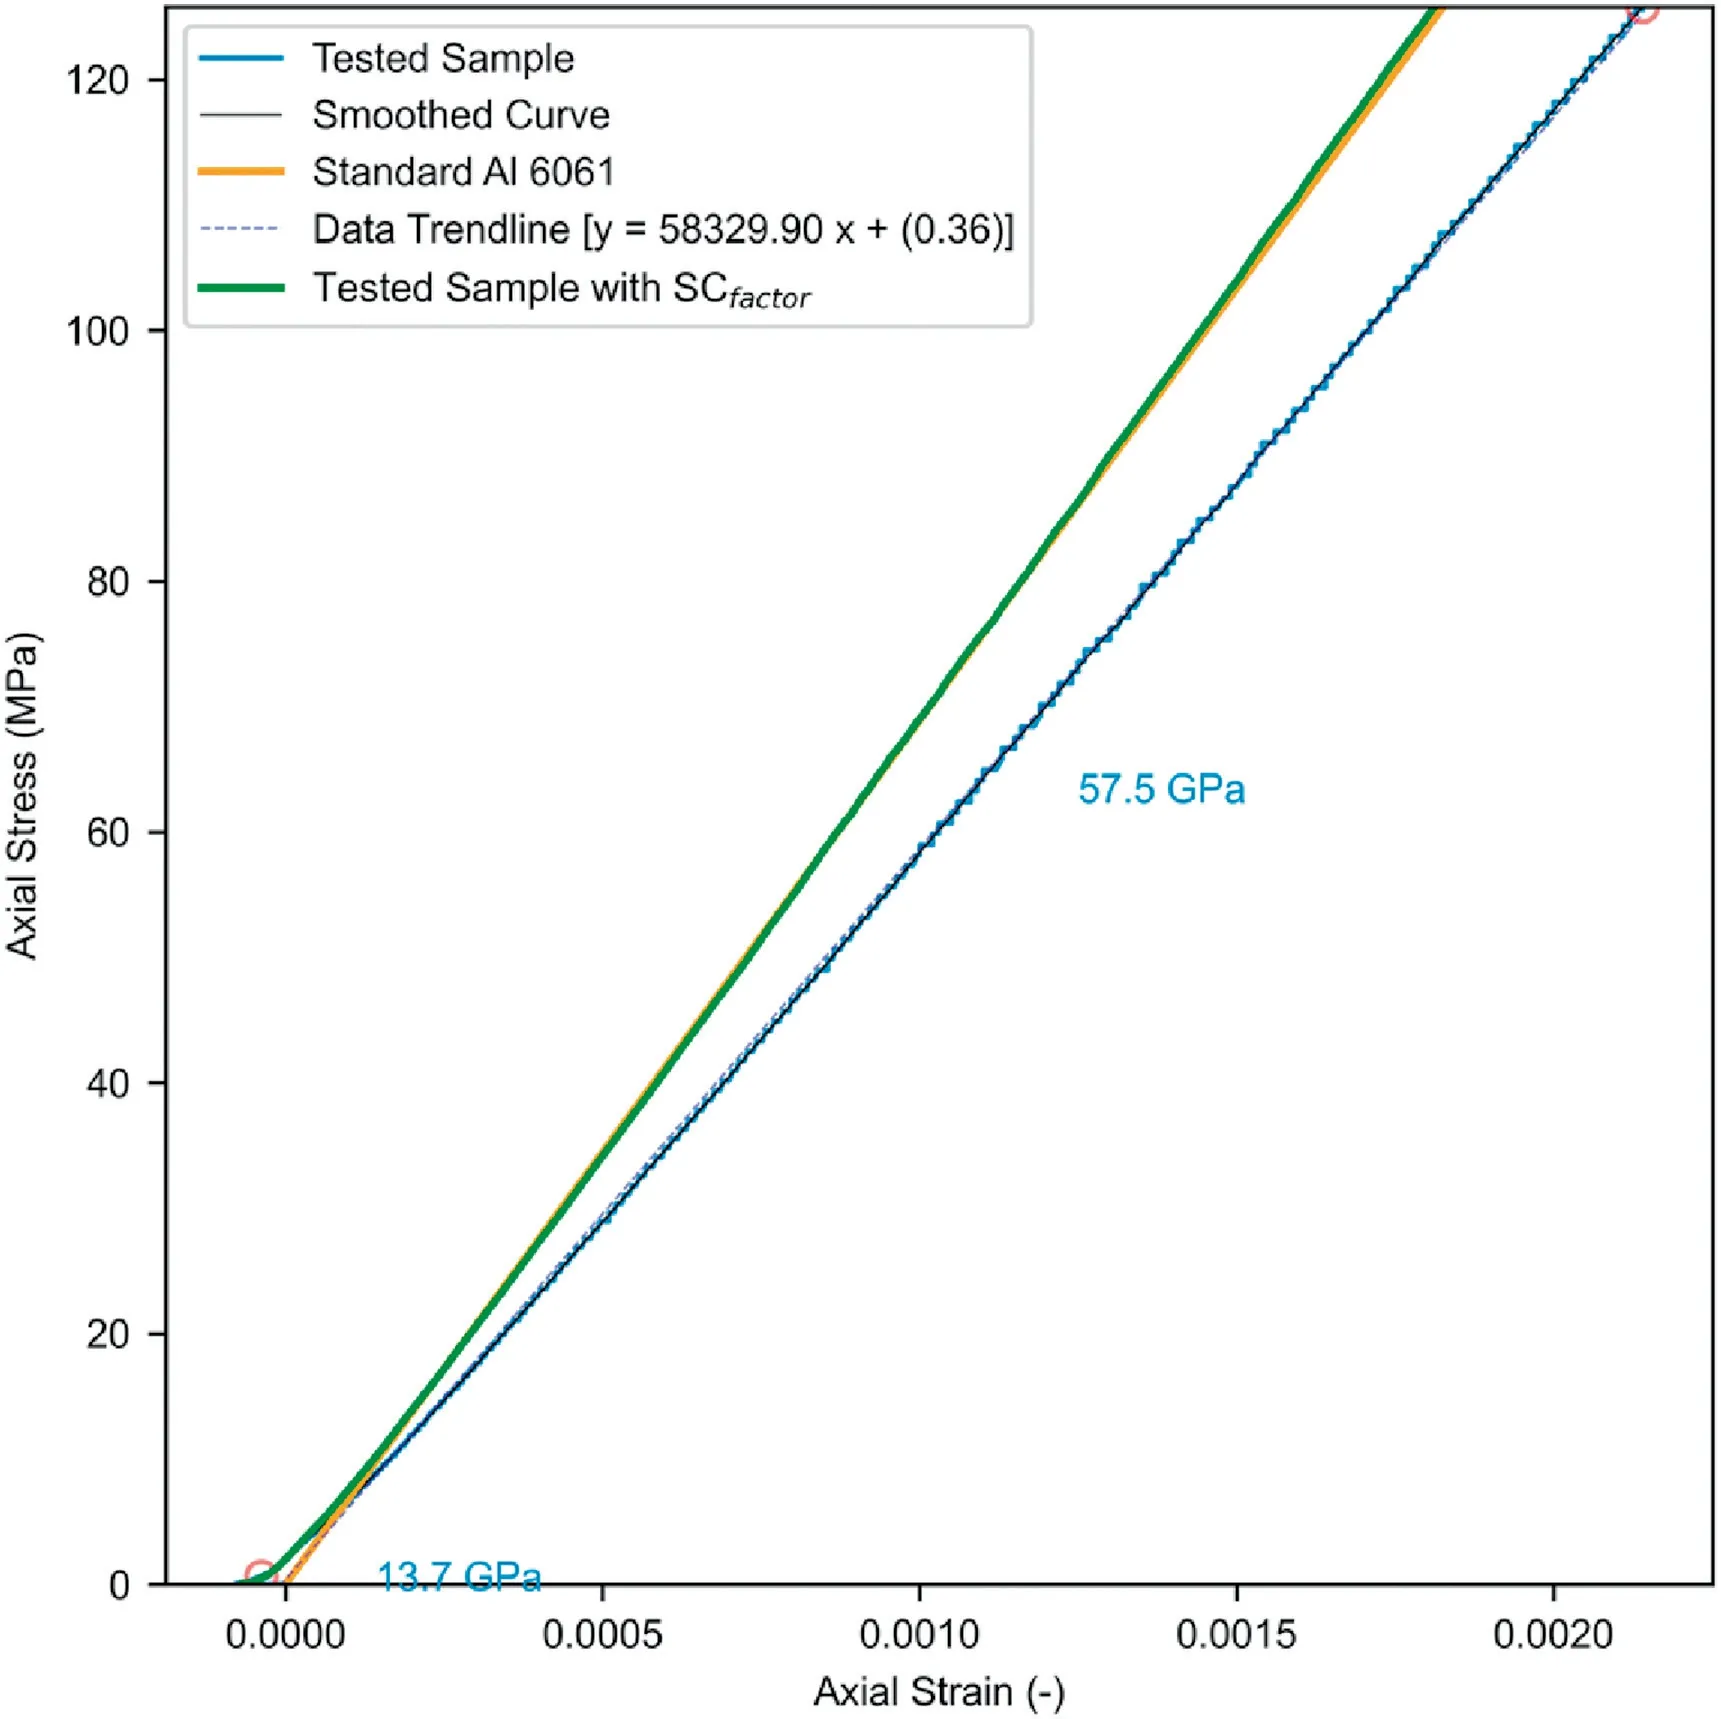
Fig.11.Stress-strain curves of System 2A.The solid blue line indicates the tests’ raw stress-strain curve while the black solid line shows the smoothed raw data.The orange line shows the expected stress-strain data of Al.The raw stress-strain curve is then corrected using the trendline (dashed blue line) and transformed Ecorrected for system-compliance (green solid line).
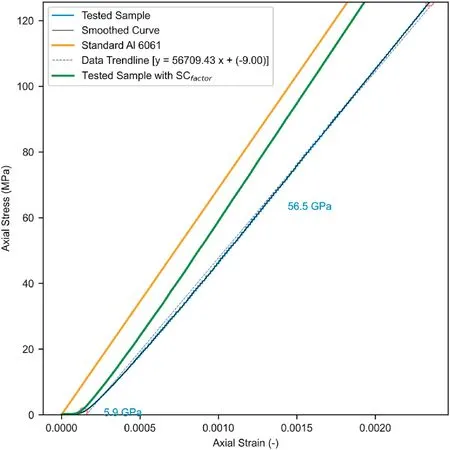
Fig.12.Stress-strain curve of System 2B.The solid blue line indicates the tests’ raw stress-strain curve while the black solid line shows the smoothed raw data.The orange line shows the expected stress-strain data of Al.The raw stress-strain curve is then corrected using the trendline (dashed blue line) and transformed Ecorrected for system-compliance (green solid line).
The results of the sensitivity analysis of the WL showed dependency on the data acquisition rate.System 1 had the slowest acquisition rate and the results did not vary significantly above WL of 31.In System 2,the number of points where the slope changes plateaued at WL of 47.In fact,the results of using the load or displacement as a proxy are almost identical,which may be an artifact of the smoothening of the data.In System 3,this plateau was noticed at WL of 143 as a result of the increased readout frequency,about 2.5 times that of System 1 and 10 times that of System 2.
The use of different spacers of similar material and height,provided that the overall setup is still identical,slightly influenced the results.This is portrayed in the comparative results between Systems 2A and 2B,where SCfactorranges in 0.81-0.84.A similar trend was observed in the comparative results between Systems 3A and 3B.In this case,SCfactorof the GL measurements ranges in 0.43-0.44 while that of the EX ranges in 0.76-0.79.This can impact Ecorrectedfor system-compliance by about ±2%.In Systems 1A and 1B,the same frame was used with different combinations of pedestals and spacers.In System 1A,the system-compliance factor was 0.63 while that of System 1B was 0.67.This can impact Ecorrectedby about ±7%.This shows the strong dependency of the systemcompliance factor on the used testing setup.
In Systems 2 and 3,the same Al sample was used to evaluate the system-compliance.For EX,System 2 showed a SCfactorvalue of 0.81-0.84 while System 3 showed a SCfactorvalue of 0.76-0.79.This can impact Ecorrectedby about±8-9%.Hence,SCfactoris inconsistent across the different setups,which is indicative of the independence of the tested rod and dependence on the system and test setup.Thus,it is evident that each system and setup must be separately evaluated for its SCfactorand that no single value can be used across all systems and setups.
On another note,the distinction of S2 in the stress-strain curve,i.e.nonlinear portion,is unexpected as Al is extruded to strict specifications and tolerances.This nonlinear response is commonly attributed to a stage in the stress-strain curve of rocks,commonly known as Stage 1,which corresponds to closure of pre-existing cracks,flaws,and voids (Cook et al.,1984).Since Al is extruded to strict tolerances,Korinets and Alehossein(2002)related the initial nonlinear response in Stage 1 to the interface-imperfections between the test sample and the loading platens.Thus,we can speculate that for rock samples,the initial nonlinearity generally recorded in the tests is likely caused by a compound effect of crack closure and interface-imperfections.
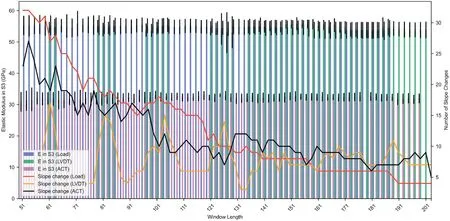
Fig.13.Sensitivity analysis of window length for System 3A.The red,orange,and black lines indicate the number of points identified as a change in slope in the raw curves of the load,LVDT and actuator displacement,respectively.The average E in S3 is presented as the blue,green and purple bars evaluated from the raw curves of the load,LVDT and actuator displacement,respectively.The black error bars are the standard deviation of E in S3.Absence of a bar indicates that a distinct S3 section in the raw curves was not identified by the Savitzky-Golay filter.
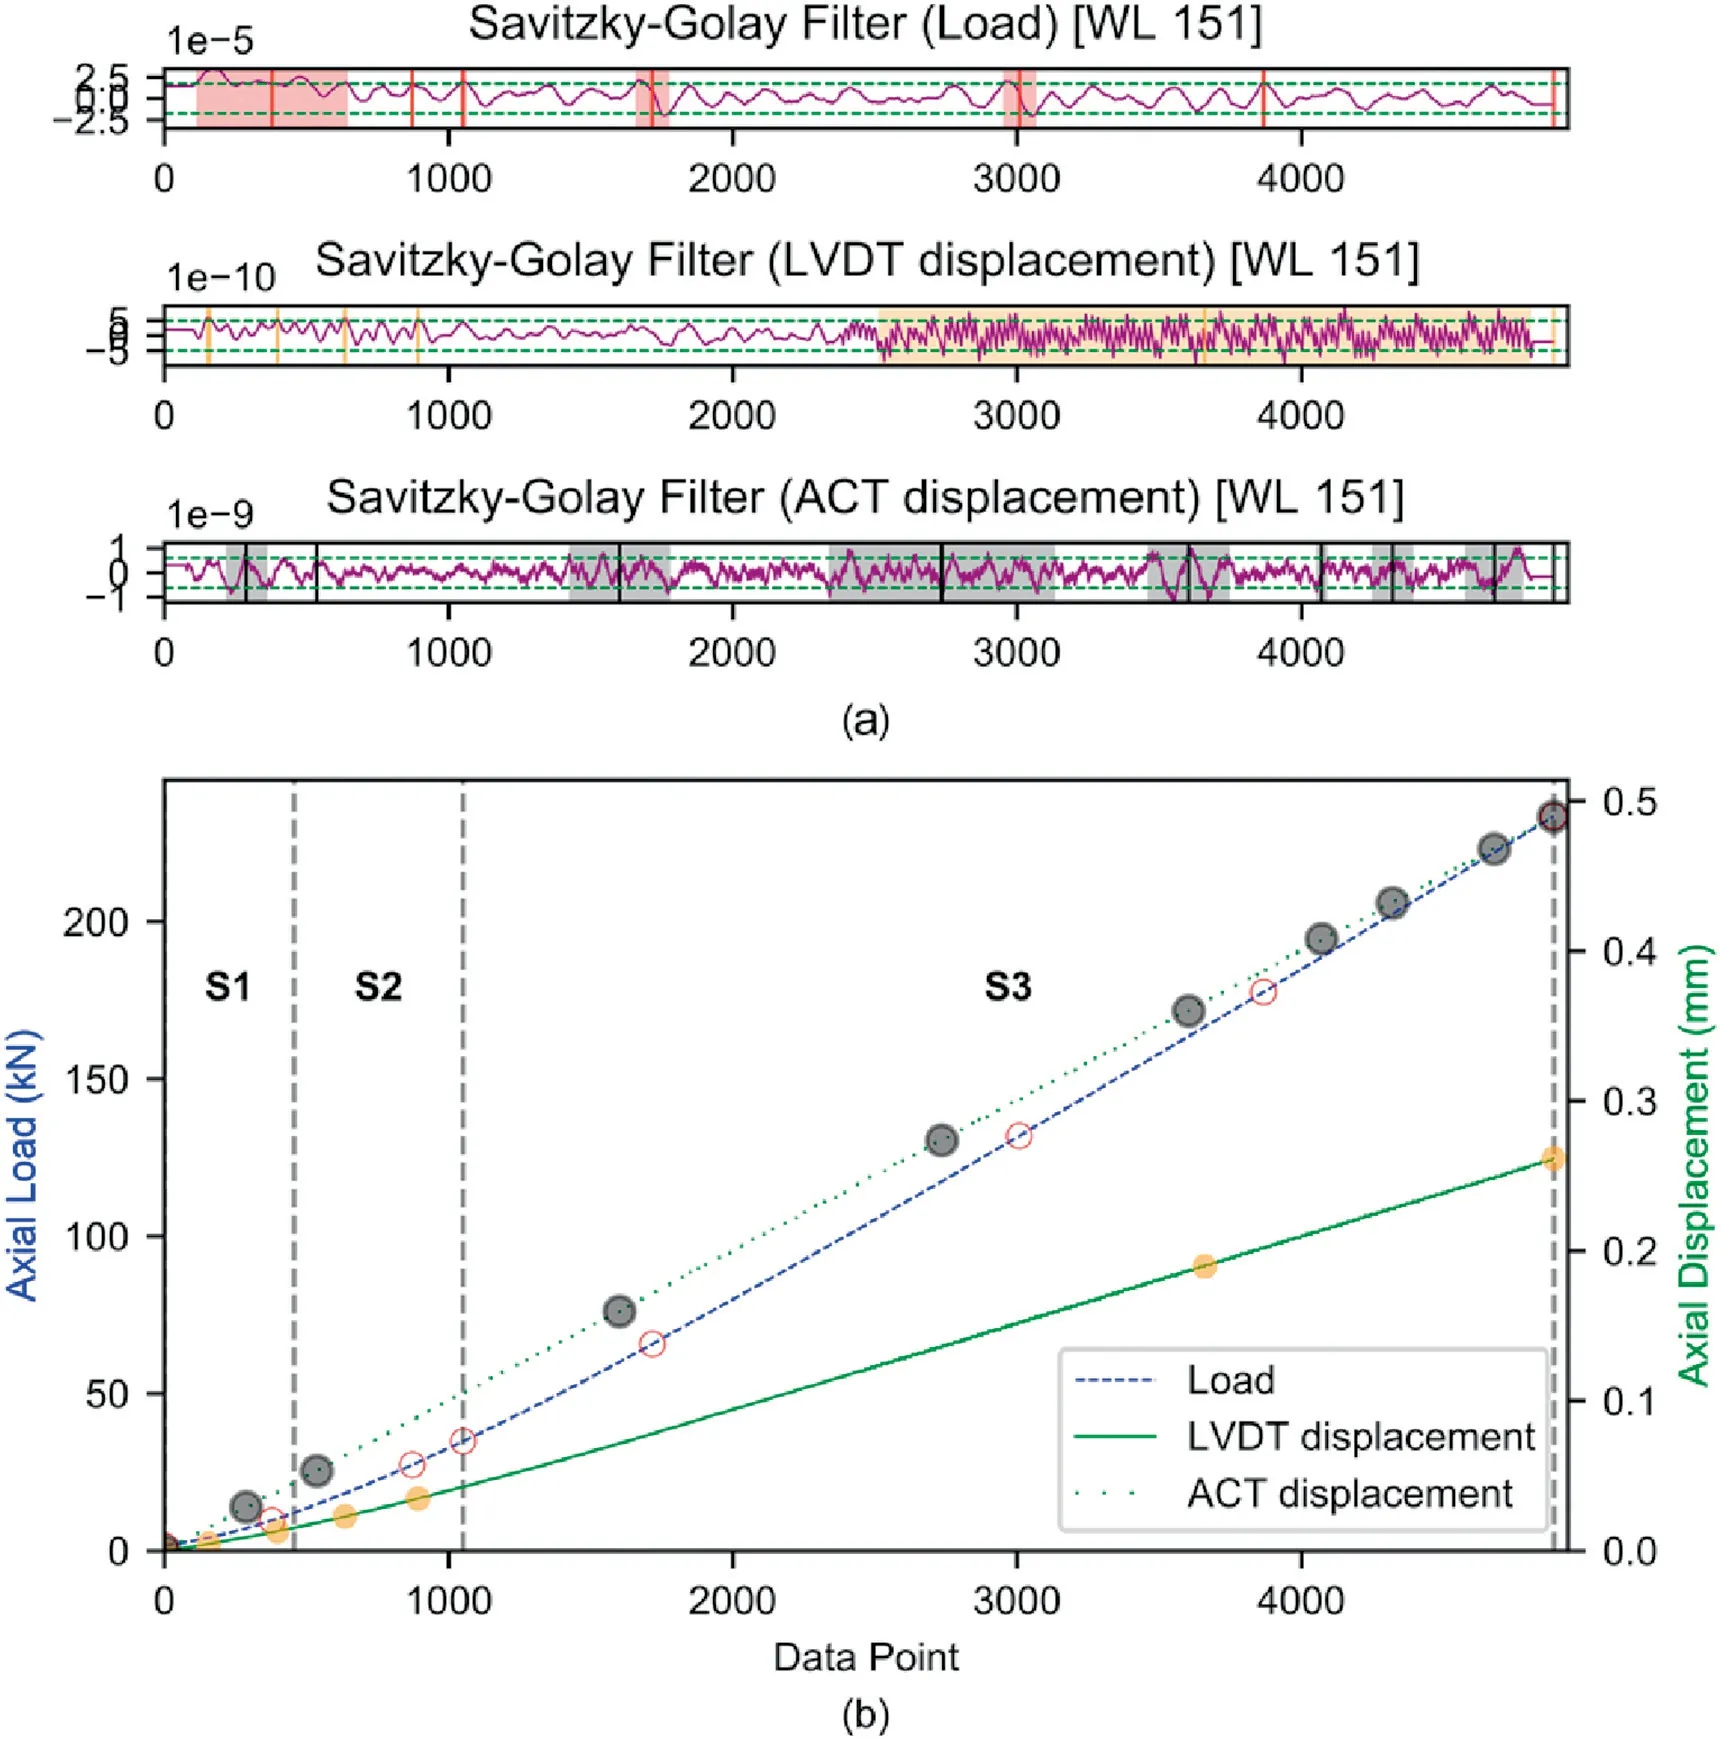
Fig.14.System 3A:(a) Savitzky-Golay filter.The horizontal green dashed lines indicate the proxy lines while the vertical solid lines indicate the mid-point of the local maxima/minima.The shaded areas are the extents of the filter applied for the specific interval.(b)The raw load and deformation curves showing the various sections and the projection(circles)of the mid-point of the local maxima/minima which correspond to a significant change in the slope of the curves.The deformation of the actuator(ACT)is linear as the machine is CRE.
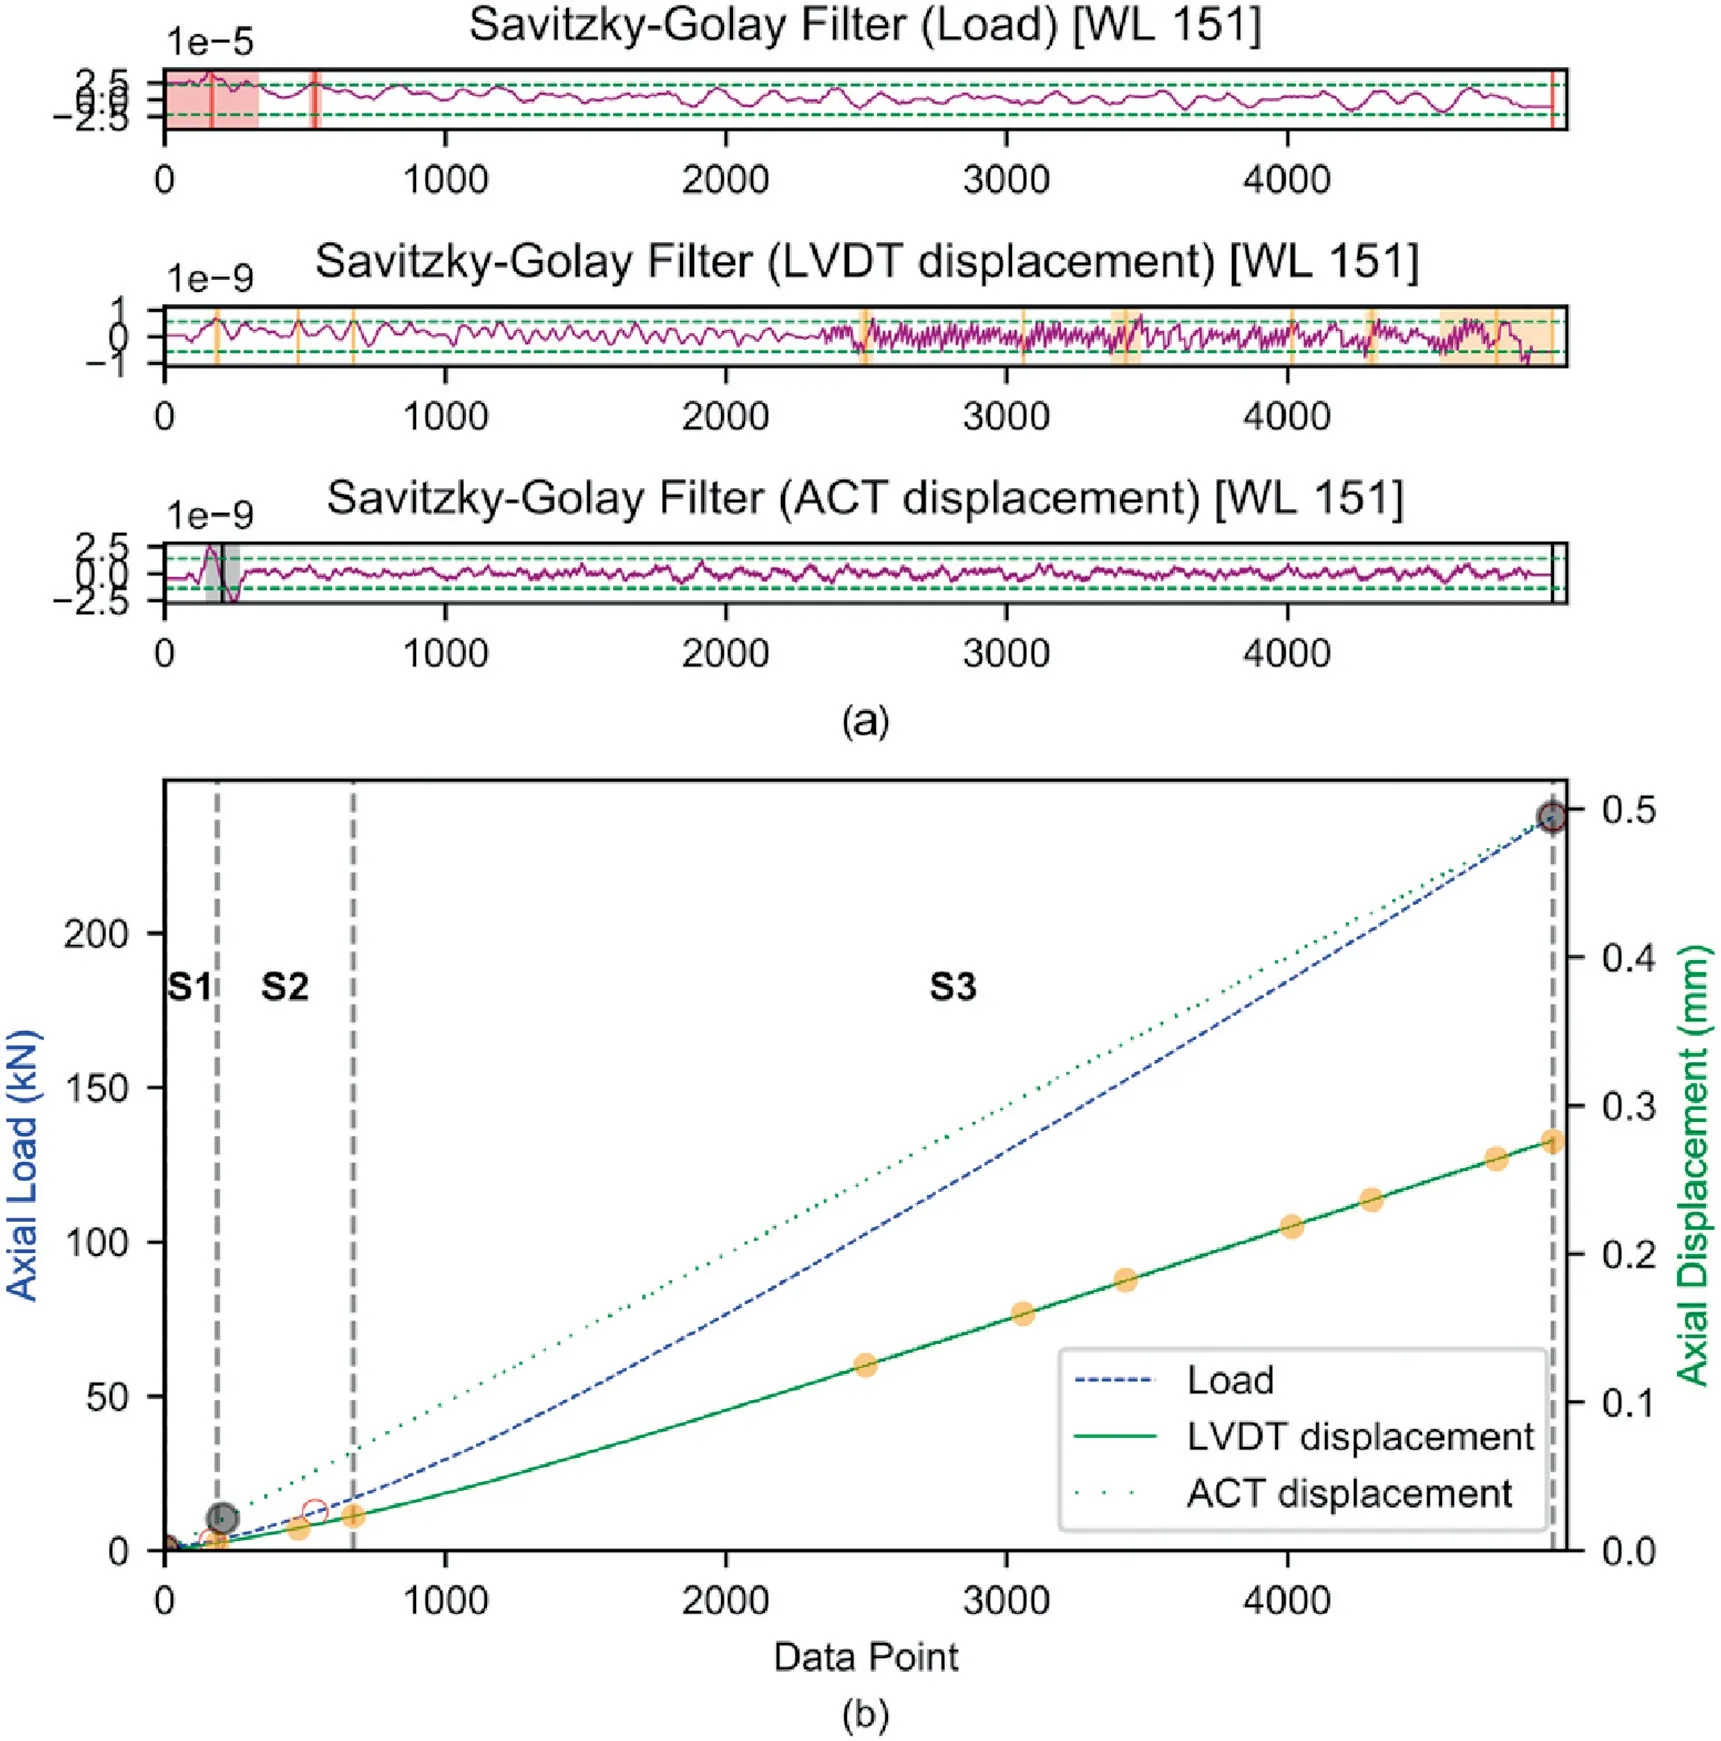
Fig.15.System 3B:(a) Savitzky-Golay filter.The horizontal green dashed lines indicate the proxy lines while the vertical solid lines indicate the local maxima/minima.The shaded areas are the extents of the filter applied for the specific interval.(b) The raw load and deformation curves showing the various sections and the projection(circles) of the local maxima/minima which correspond to a significant change in the slope of the curves.The deformation of the actuator (ACT) is linear as the machine is CRE.
Additionally,it is noted that in Systems 2 and 3,the EX measurements where the LVDTs are attached to the top and bottom platens and stretch across the length of the samples,yield better results than that in System 1.In System 1,the LVDTs are attached to extension rods fixed to the bottom platen extending over the top platen,with the LVDTs measuring the movement of the top platen with respect to the bottom platen.The lower SCfactorvalue can be due to the bending of the extension rods holding the LVDTs as they are still part of the spacer.
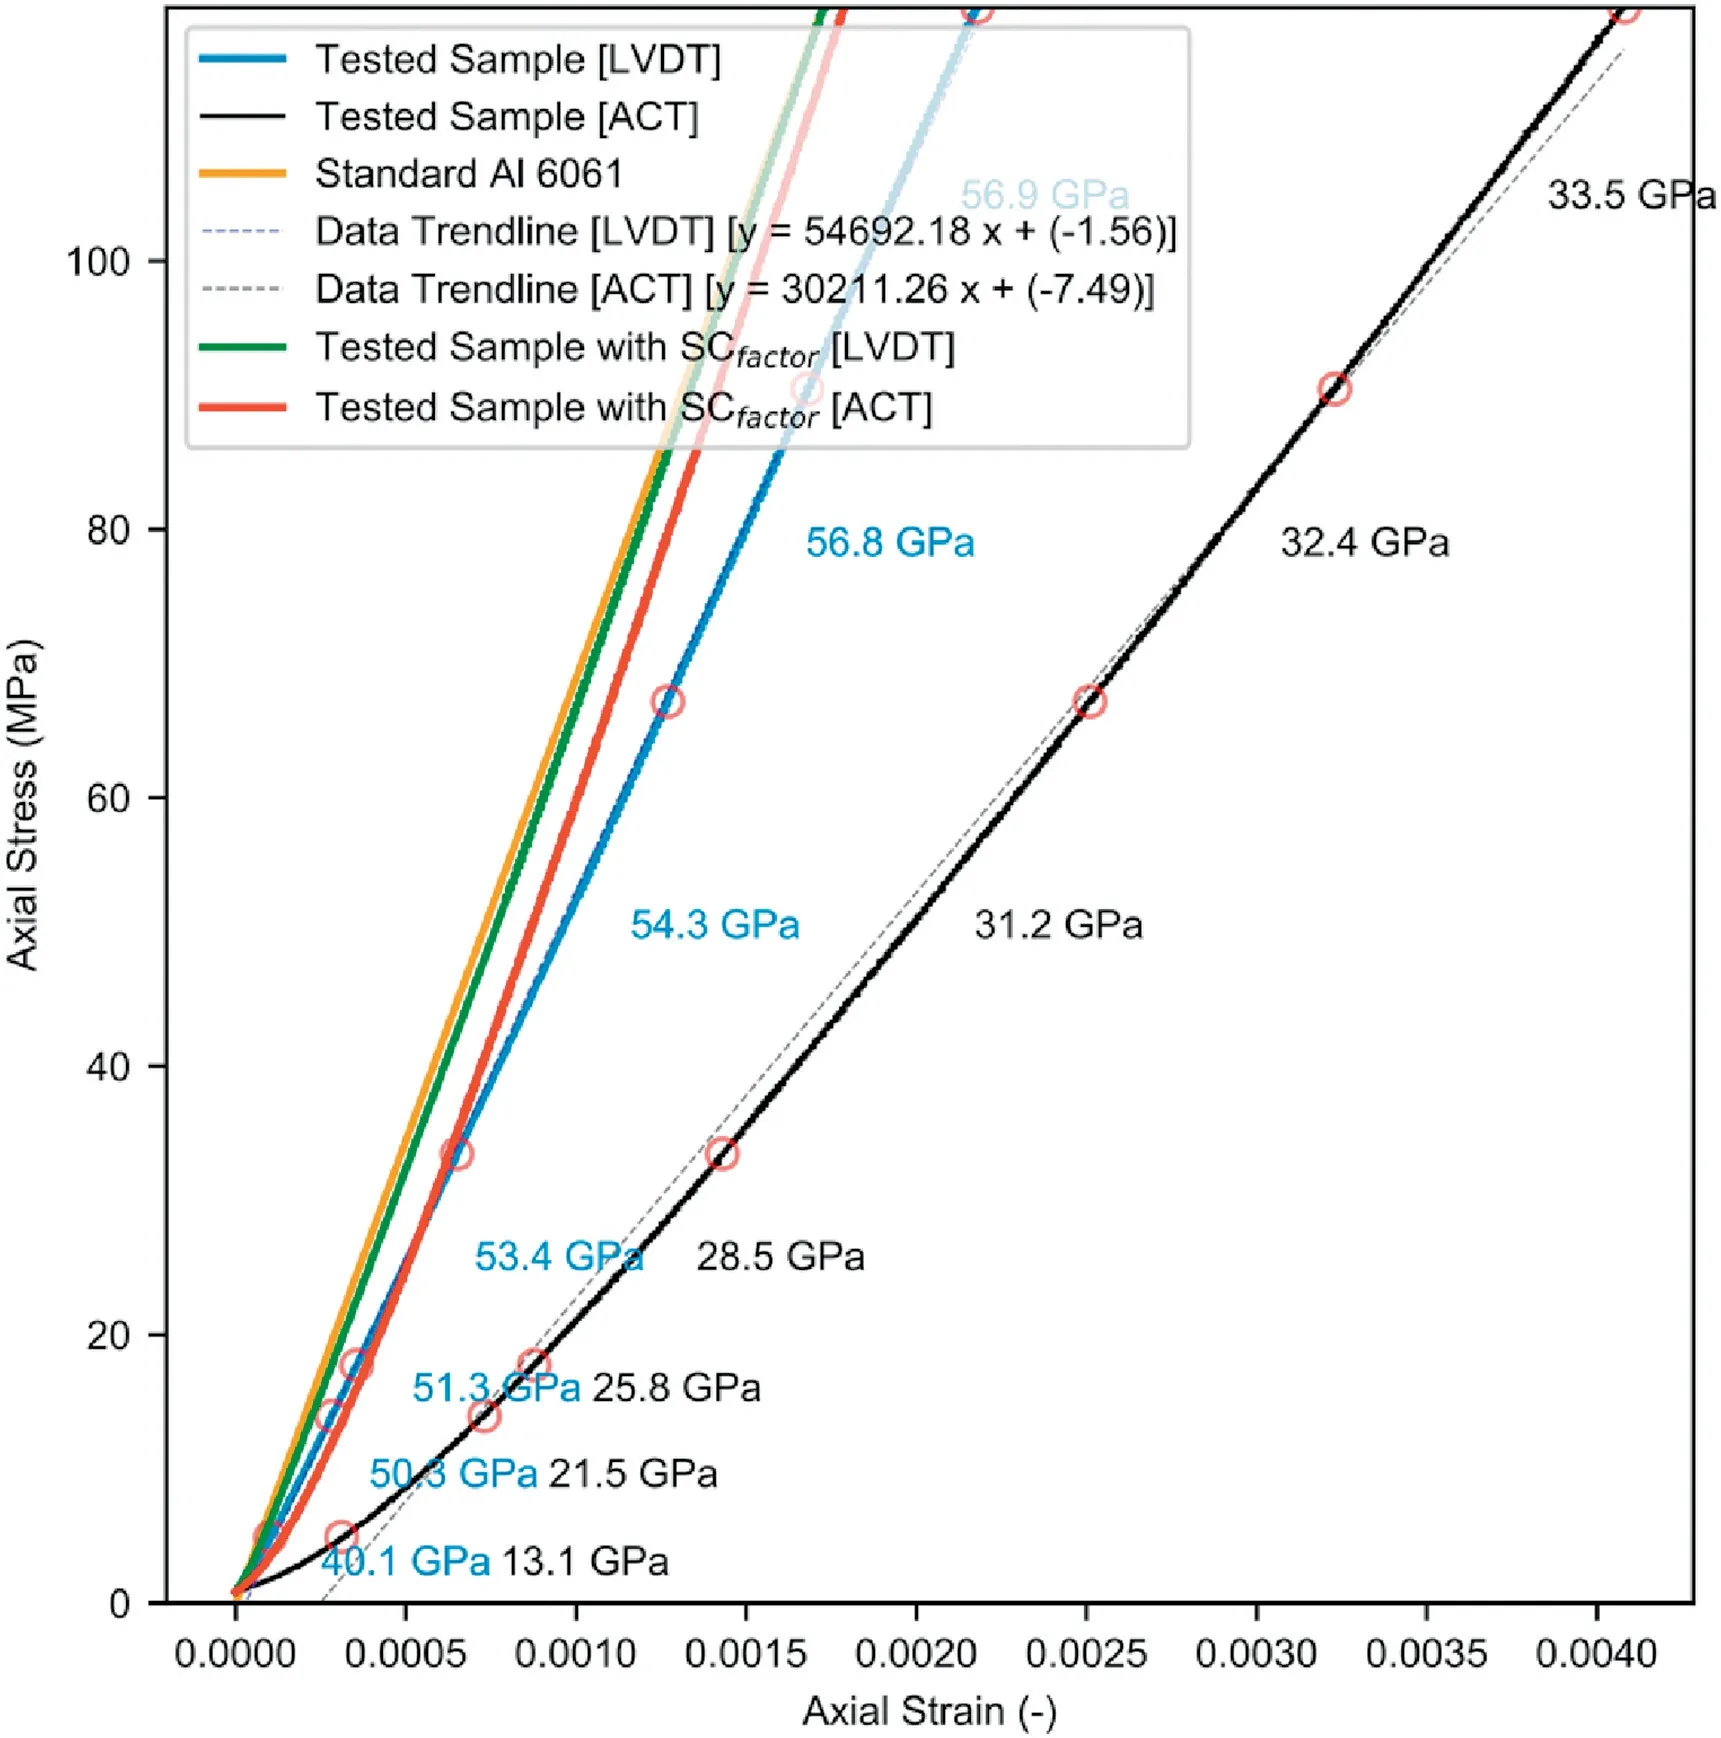
Fig.16.Stress-strain curves of System 3A.The solid black and blue lines (corresponding to the GL and EX strain systems) indicate the tests’ raw stress-strain curve and the orange line shows the expected stress-strain data of Al.The raw stress-strain curve is then corrected using the trendline(dashed black and blue lines,corresponding to the GL and EX strain systems)and transformed to Ecorrected for system-compliance as the solid red and green lines for the GL and EX systems,respectively.
5.Application
SS GR is found in Southern Quebec,Canada.Typically,SS GR is a warm grey igneous rock from the Devonian age with medium grain size and constitutes of orthoclase,plagioclase (albite),quartz,biotite,and a little hornblende (Denis,1927).The block used for this application was white,pale,and grey to dark grey and black,fine-to coarse-grained,and dominant in quartz,feldspar,and biotite(Nasseri and Mohanty,2008).Mechanical responses of SS GR are summarised in Table 3.
In this application,a total of three UCS tests were carried out on samples cut consecutively from the same core.The 1.5-inch diameter core was extracted from a block of SS GR using an Ikeda radial drill equipped with a diamond core barrel.The samples were cut to size using a thin blade saw.The cylindrical end faces of the samples to be tested were ground flat using a computer numerical control(CNC)surface grinder,Meister V3 manufactured by Techno Wasino Co.,Ltd.Sample preparation was performed utilising cooling/circulating fluids.The entire sample preparation process was carried out by a single operator and all three samples were cut from the same core to reduce bias.The first (SS GR1) and the third (SS GR3)samples were tested on System 3A,while the second sample(SS GR2) was tested on System 1A.The individual results,uncorrected for system-compliance,are presented in the Appendix.
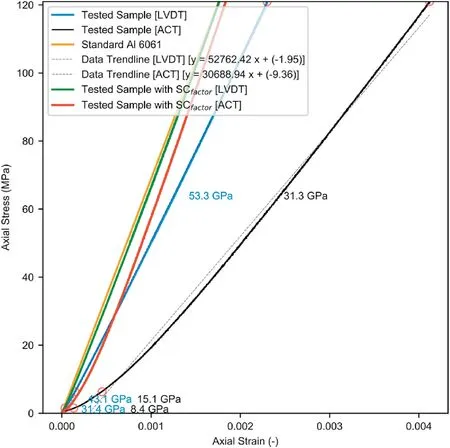
Fig.17.Stress-strain curves of System 3B.The solid black and blue lines (corresponding to the GL and EX strain systems) indicate the tests’ raw stress-strain curve and the orange line shows the expected stress-strain data of Al.The raw stress-strain curve is then corrected using the trendline(dashed black and blue lines,corresponding to the GL and EX strain systems)and transformed to Ecorrected for system-compliance as the solid red and green lines for the GL and EX systems,respectively.
Evaluation of the elastic modulus is known to vary across laboratories.Thus,to maintain consistent inter-laboratory evaluation,Eavgis carried out for the range between 40%and 60%of the UCS.In the case of Et50,the procedure should account for the noise as well as the different output frequencies of the various test setups.The procedure adopted herein constitutes of finding the stress at 50%(σ50%) of the peak strength of the tested sample.Et50is then evaluated using the stress and strain values at the ends of the range σ50%±2.4 MPa.This range was chosen as it provided consistent values across setups,eliminating the dependency of the output frequency.An evaluation of the ranges used to calculate Et50and their comparison with Eavgis presented in the Appendix.
The raw results reveal similar UCS values,ranging between 140-150 MPa,which are within the range reported in Table 3 for SS GR.Et50was evaluated using the previously described methodology.The results show consistency amongst samples tested on the same setup and interpreted using the same deformation measurement device (Fig.18).However,when interpreted between different deformation measurement devices or inter-laboratory,the results of Et50vary significantly.Comparing inter-laboratory EX measurements,the results indicate that the Et50values for the samples(Fig.18 -orange bar) tested on System 3A were 42.4 GPa and 42 GPa for SS GR1-EX and SS GR3-EX,respectively,while the sample tested on System 1A had an Et50value of about 35.6 GPa.The Et50results show consistency amongst samples tested on thesame setup,however,they differ by about 16% between setups.Additionally,on the same setup (i.e.System 3A),the Et50results using the GL measurement are almost 40%lower than that of the EX measurement.This can be termed as“consistent inconsistency”in the interpretation and analysis of inter-laboratory raw data.Eavgfollows the same trend in terms of the“consistent inconsistency”(Fig.18-light red bar)and the results are within±1 GPa from Et50for the same sample and setup.
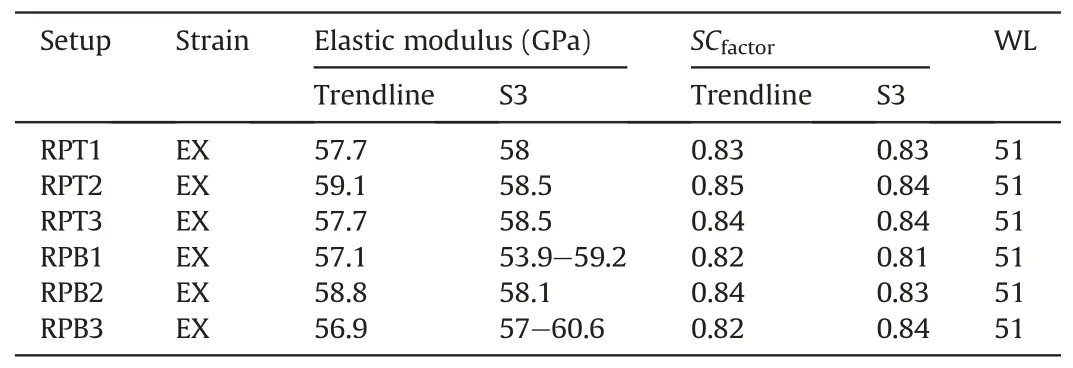
Table 2Quality control tests of System 2A.
The SCfactoraims to eliminate this inconsistency between interlaboratory test results.Hence,SCfactoris applied to each tested sample based on the setup and the deformation measurement device used.Using this approach,for the EX measurements and by adopting the values attained above(Table 1),the Et50results for SS GR1-EX,SS GR2-EX,and SS GR3-EX were corrected,resulting in 54.4 GPa,53.1 GPa,and 53.8 GPa,respectively.An increase of about 22% was obtained for System 3B and 33% for System 1A (Fig.18 -green bar).Similarly,correcting for the GL measurements,the Et50values for SS GR1-GL and SS GR3-GL were corrected to 59.2 GPa and 60 GPa,respectively.An increase of about 56% was observed for System 3A.Similar patterns in terms of increase were noticed between Eavg(Fig.18 -light red bar) and Eavgcorrected(Fig.18 -light blue bar).

Table 3SS GR mechanical properties.
The resulting Et50correctedand Eavgcorrectedresults show consistency.The variation in the inter-laboratory results using EX strain measurements reduced significantly from 16% to a mere 1%.Even better improvement is seen in the comparison between the EX and GL measurements for System 3A where the inconsistency,which was almost 40%,decreased to an astonishing value of 9%.Although this is a substantial decrease,the difference of 9% is considered significant as the displacement is not actually measured across the tested sample but across the various interfaces in the setup/system.Additionally,this process also accounts for the underestimation of Et50and Eavg,which is an anomaly inherent of the testing setup/system used.Based on this,it is evident that SCfactoris of utter importance.Regardless of the deformation measurement device used or the setup,if interpreted appropriately,Et50and Eavgcan be independent of machine and laboratory interference.
6.Conclusions
The consistent inconsistencies within inter-laboratory results of an SS GR sample triggered an in-depth interpretation of the raw testing data.The work focused on the shortcomings in evaluation of Eavgand Et,depicted in significant underestimation of the elastic modulus,and proposed a quantitative methodology to correct for it.The methodology was presented in the form of a system-compliance factor,demonstrating its utter importance,and portraying that it is system and test setup dependent.Consideration of system-compliance is also unequivocally important especially when dealing with inter-laboratory inconsistencies,as even for infinite stiffness (zero systemcompliance machines),correction is needed and expected to be higher if the actuator displacement (GL measurement) is used.The Savitzky-Golay filter provides a robust quantitative and objective method in identifying the changes in slope of the tested Al sample,used as reference material,which are then used to obtain system-compliance correction factors.
The system-compliance factors,for the testing system investigated in this article,ranged from 22% to 56% depending on the system and test setup,concluding that the reported strain is almost always certainly overestimated.Our results clearly identified that the frame system used,and the overall setup assemblage are deemed to be the most impactful on SCfactor.The use of spacers with similar physico-mechanical properties does impact SCfactor.This impact is more significant in the GL measurement when compared to EX measurement.These findings are methodologically extended to correct a series of UCS tests carried out on SS GR diminishing the inter-laboratory variation in the calculated Et50and Eavgfrom 50%to a mere 9%after correction.Although the Et50and Eavgresults were almost identical,Et50results were extremely sensitive to the range over which they were evaluated.
The article indubitably depicts the fact that the Young’s modulus is not just another fundamental elastic parameter used in the design.The analysis method of Eavgand Etcan have potential impacts leading to misjudgment as well as incompetent and uninformed decisions.The findings presented herein indicated that the reported Young’s modulus results,typically common in international testing standards,are underestimated and in some cases misrepresentative of the elastic rock behaviour.The quantitative nature of the work presented,apart from providing a realistic value of the elastic modulus,also limits the inter-laboratory bias in the reported elastic modulus.
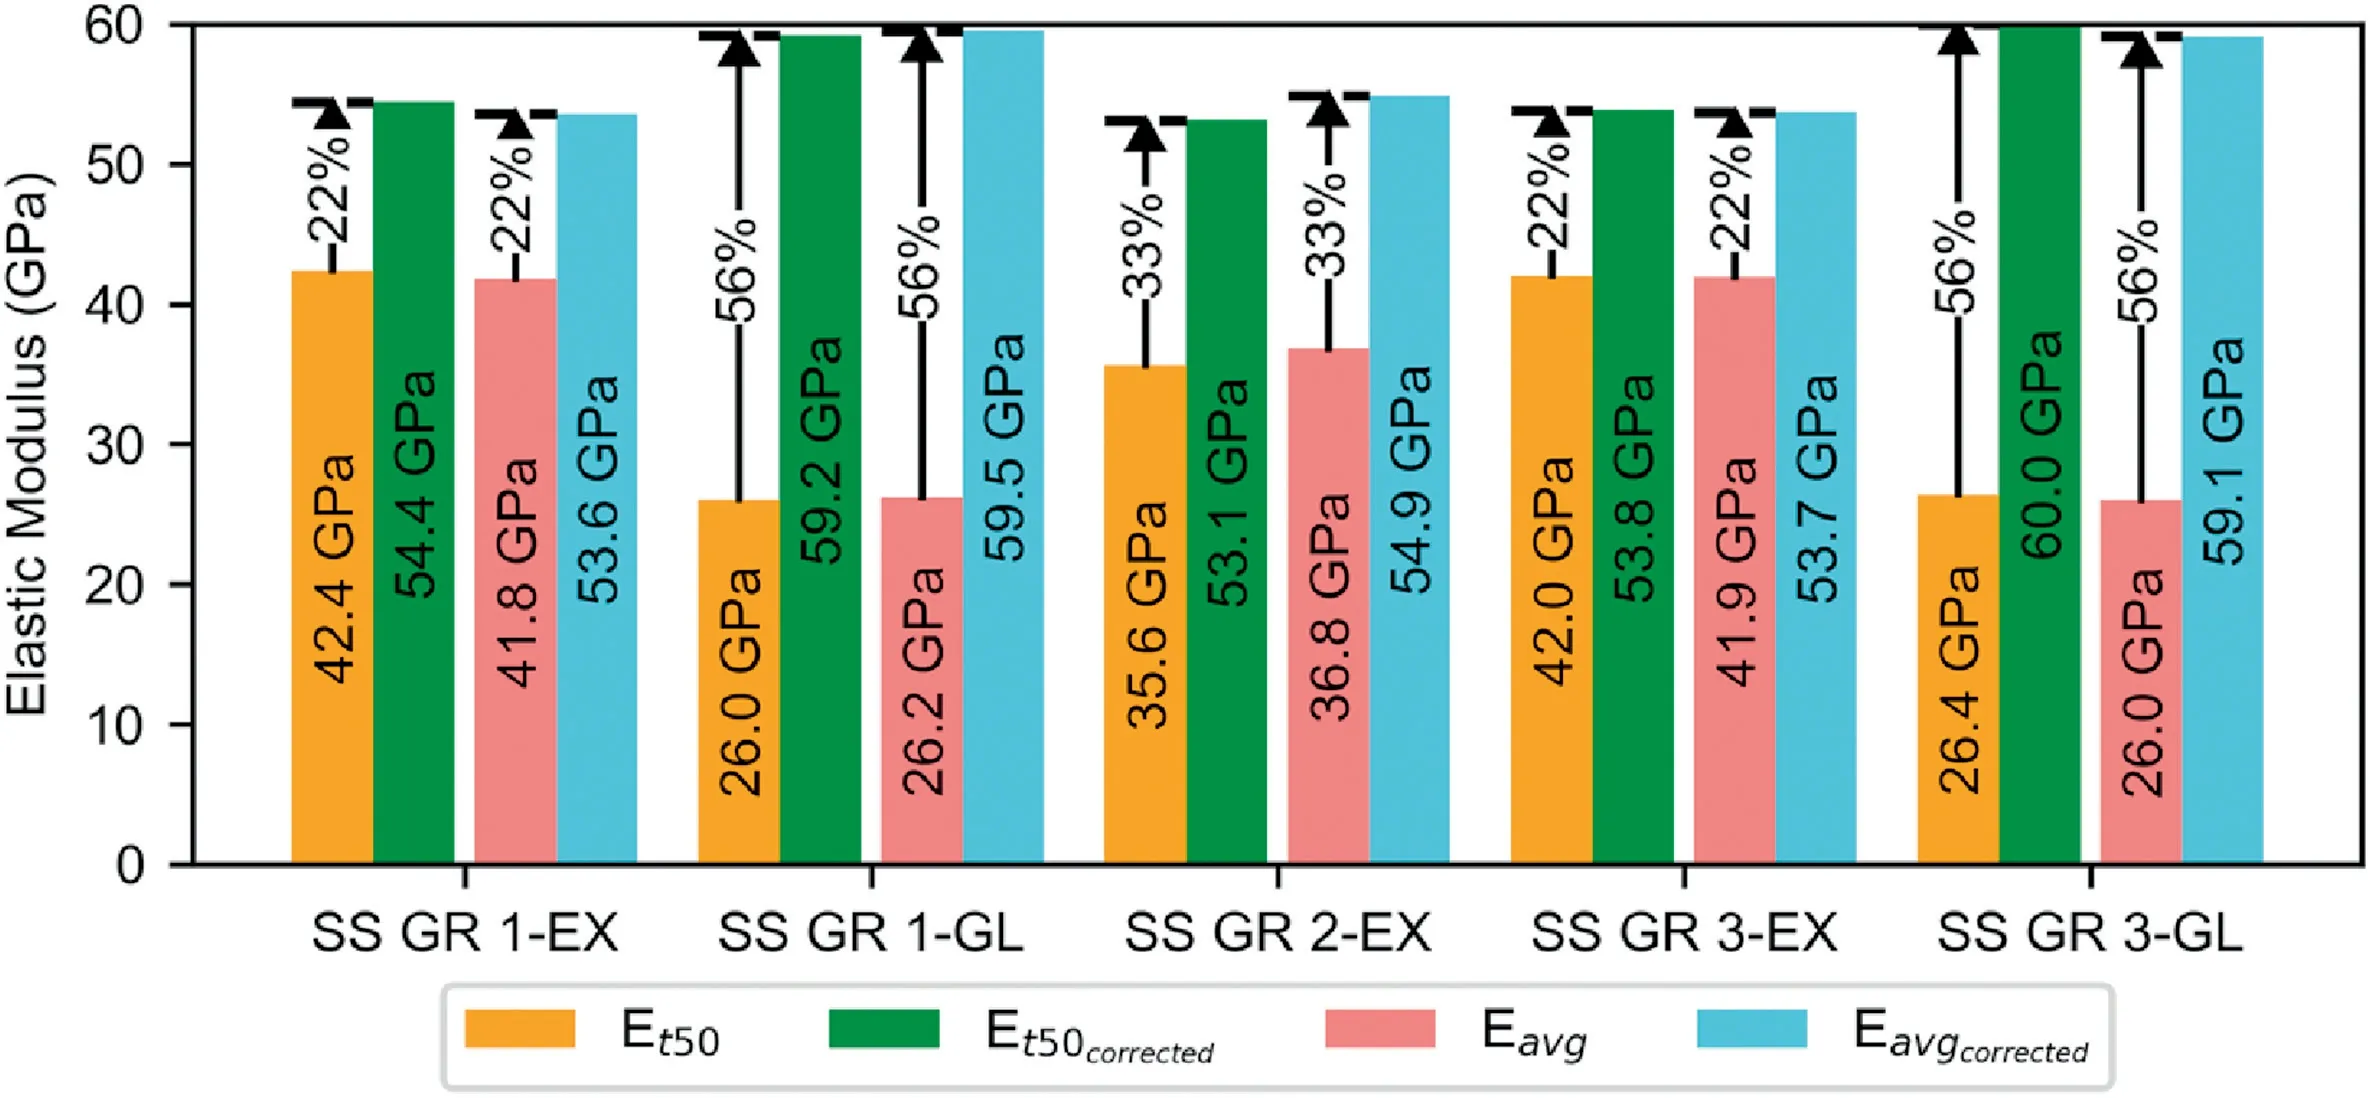
Fig.18.Comparison between Et50 of the SS GR samples before (orange) and after applying SCfactor (green) as well as Eavg before (light red) and after applying SCfactor (light blue).Samples were from the same core.SS GR1 and SS GR3 were tested on System 3A while SS GR2 was tested on System 1A.
Declaration of competing interest
The authors declare that they have no known competing financial interests or personal relationships that could have appeared to influence the work reported in this paper.
Acknowledgments
This work has been supported through the Natural Sciences and Engineering Research Council of Canada (NSERC) PGS D3-518886,NSERC Discovery Grants 341275,and NSERC/Energi Simulation Industrial Research Chair program.The authors would like to thank Dr.Bryan Tatone and Mr.Johnson Ha for their assistance during testing and constructive feedback.The authors would also like to thank the anonymous reviewers for their constructive comments and suggestions.
Appendix A.Supplementary data
Supplementary data to this article can be found online at https://doi.org/10.1016/j.jrmge.2020.10.003.
 Journal of Rock Mechanics and Geotechnical Engineering2021年3期
- Journal of Rock Mechanics and Geotechnical Engineering的其它文章
- Uncertainties of thermal boundaries and soil properties on permafrost table of frozen ground in Qinghai-Tibet Plateau
- Effect of natural and synthetic fibers reinforcement on California bearing ratio and tensile strength of clay
- Engineering and microstructure properties of contaminated marine sediments solidified by high content of incinerated sewage sludge ash
- Effects of oil contamination and bioremediation on geotechnical properties of highly plastic clayey soil
- Modification of nanoparticles for the strength enhancing of cementstabilized dredged sludge
- Rock-like behavior of biocemented sand treated under non-sterile environment and various treatment conditions
