Channel Measurement and Path Loss Modeling from 220 GHz to 330 GHz for 6G Wireless Communications
Pan Tang,Jianhua Zhang,*,Haoyu Tian,Zhaowei Chang,Jun Men,Yuxiang Zhang,Lei Tian,Liang Xia,Qixing Wang,Jingsuo He
1 State Key Lab of Networking and Switching Technology,Beijing University of Posts and Telecommunications,Beijing 100876,China
2 China Mobile Research Institute,Beijing 100053,China
3 Capital Normal University,Beijing 100048,China
Abstract:Terahertz(THz)communication has been envisioned as a key enabling technology for sixthgeneration(6G).In this paper,we present an extensive THz channel measurement campaign for 6G wireless communications from 220 GHz to 330 GHz.Furthermore,the path loss is analyzed and modeled by using two single-frequency path loss models and a multiplefrequencies path loss model.It is found that at most frequency points,the measured path loss is larger than that in the free space.But at around 310 GHz,the propagation attenuation is relatively weaker compared to that in the free space.Also,the frequency dependence of path loss is observed and the frequency exponent of the multiple-frequencies path loss model is 2.1.Moreover,the cellular performance of THz communication systems is investigated by using the obtained path loss model.Simulation results indicate that the current inter-site distance(ISD)for the indoor scenario is too small for THz communications.Furthermore,the tremendous capacity gain can be obtained by using THz bands compared to using microwave bands and millimeter wave bands.Generally,this work can give an insight into the design and optimization of THz communication systems for 6G.
Keywords:terahertz;channel measurement;channel modeling;path loss
I.INTRODUCTION
In 2020,commercialization of Fifth-generation(5G)networks is being carried out worldwide.According to reports in the Global Mobile Broadband Forum 2020 that was held in November 2020,there are more than 110 5G commercial networks and more than 800,000 5G sites all over the world.However,with the development of big data,the internet,cloud computing,smart city,and integration of multidimensional networks,the data traffic has grown continually[1,2].In the Ericsson Mobility Report November 2020[3],Ericsson forecasted that the number of 5G subscriptions would reach 3.5 billion in 2026.Furthermore,data traffic would be about 300 exabytes per month.This may bring challenges to the bearing capacity of the 5G networks.To meet the future demand for mobile communication systems,some countries,e.g.,China,Finnish,Japan,Korean,England,American,and organizations have started research on Sixth-generation(6G)[4-7].Furthermore,THz communication has attracted considerable interests,and is considered as a promising method of supporting demand on the date rate for 6G[8,9].
THz communication means to use THz wave(0.1-10 THz)as the carrier wave to transfer data.Due to special physical properties of THz wave,e.g.,high propagation attenuation,strong penetrability,and low quantum energy and black body temperature[10-12],THz communication has been applied in many areas,e.g.,remote sensing[13],secure imaging[14],spectroscopic detection[15],and biomedical imaging[16],see Table 1.Now,it is also considered as one of the hot technologies for enabling 6G.This mainly results from that there are abundant spectrum resources in THz bands.As shown in Figure 1,within the frequency range 100-275 GHz,there are 16 bands(total 107.15 GHz bandwidth)that can be used for fixed service applications[17].Furthermore,in the World Radiocommunication Conference 2019(WRC-19),4 new bands(total 137 GHz bandwidth)were identified for unrestricted use in fixed service and land mobile applications[18].A large number of spectrum resources make it possible to support applications that need a date rate of Tbps in 6G,such as chip to chip communication,server to server communication,short-range communication[19],wireless backhaul and fronthaul,and space communication[8,20].
THz channel modeling is the foundation of designing and optimizing THz communication systems.This is because channel properties determine the performance limit of wireless communication systems[21].And,THz channel models can be used to evaluate the performance of THz communication technologies.However,current ITU 5G channel models only support the frequency up to 100 GHz.Standardized THz channel models are missing.Furthermore,THz channel properties differ a lot from that in microwave bands due to the small wavelength.For example,Mie scattering may happen when particles have a diameter similar to or larger than the wavelength of the incident THz wave[22].Moreover,the frequency range in THz bands is extremely wide.Channel properties may perform frequency dependence and differ a lot in the frequency domain[23].Table 1 concludes characteristics of radio wave from 0.3 GHz to 30 THz[5].We can see that as the frequency increases,the wavelength decreases correspondingly and is similar to hair and eukaryon in 3-30 THz bands.Also,the penetration ability becomes weak and propagation attenuation in free space becomes severer.The supported link distance is less than 1 m in 3-30 THz.Furthermore,molecular absorption,e.g,O2and H2O,can not be ignored above 30 GHz.Thus,it is essential to characterize the channel properties in THz bands.Channel measurement is an effective and commonly used method of extracting channel properties.In following,we would give a review of THz channel measurement and modeling.
1.1 Literature Review
Looking from the existing literature,a number of channel measurement campaigns in THz bands have been conducted for characterizing THz channel characteristics.These campaigns can be divided into three groups,i.e.,studying reflection,penetration,and absorption coefficients,studying channel fading characteristics in indoor scenarios,studying channel fading characteristics in outdoor scenarios.In the first group,THz time-domain spectroscopy(THz-TDS)is usually used to do measurement.For example,[24]measured the absorption coefficients and the reflection coefficients of building materials,e.g.,plaster,glass,and wood,in the frequency range 70-350 GHz.[25]also measured reflection coefficient of building materials in the frequency range from 100 to 500 GHz.Furthermore,[26]presented measurements results on rough surface scattering on common indoor materials from 100 GHz to 4 THz.In[27],a vector network analyzer(VNA)was used to study the diffraction and shadowing properties of metal and wood at 300 GHz.In[28],reflection and penetration losses of vehicles at 300 GHz were studied.
In the second group,[29]presented channel measurements at 300 GHz for short-range communication with an office room.Channel impulse responses were derived to estimate maximum achievable symbol rates.In[30],path loss and spatial characteristics were investigated based on measurements in the frequency range of 275 to 325 GHz in an office scenario.In[10],large-scale indoor path loss models at 140 GHz were provided.In[31],an indoor line-of-sight(LOS)measurement campaign up to 5.5 m in the frequency range 140-220 GHz was presented,and path loss exponent(PLE)in models was given by fitting measured data.In[32],a wideband channel measurement between 130 GHz and 143 GHz was conducted in a typical meeting room.The path loss,power-delay-angular profiles,temporal and spatial features were studied.
The third group of measurement campaigns is relatively a little small because the link budget of THz channel measurement platform is normally limited.In[33],outdoor channel measurements at 100,200,300,and 400 GHz were presented.[34]showed double directional outdoor propagation channel measurements in the 141-148.5 GHz range over 100 m distance in urban scenarios.The path loss,angular and cluster spreads were analyzed.

Figure 1.Available bandwidths for fixed service and land mobile applications from 100 GHz to 450 GHz.
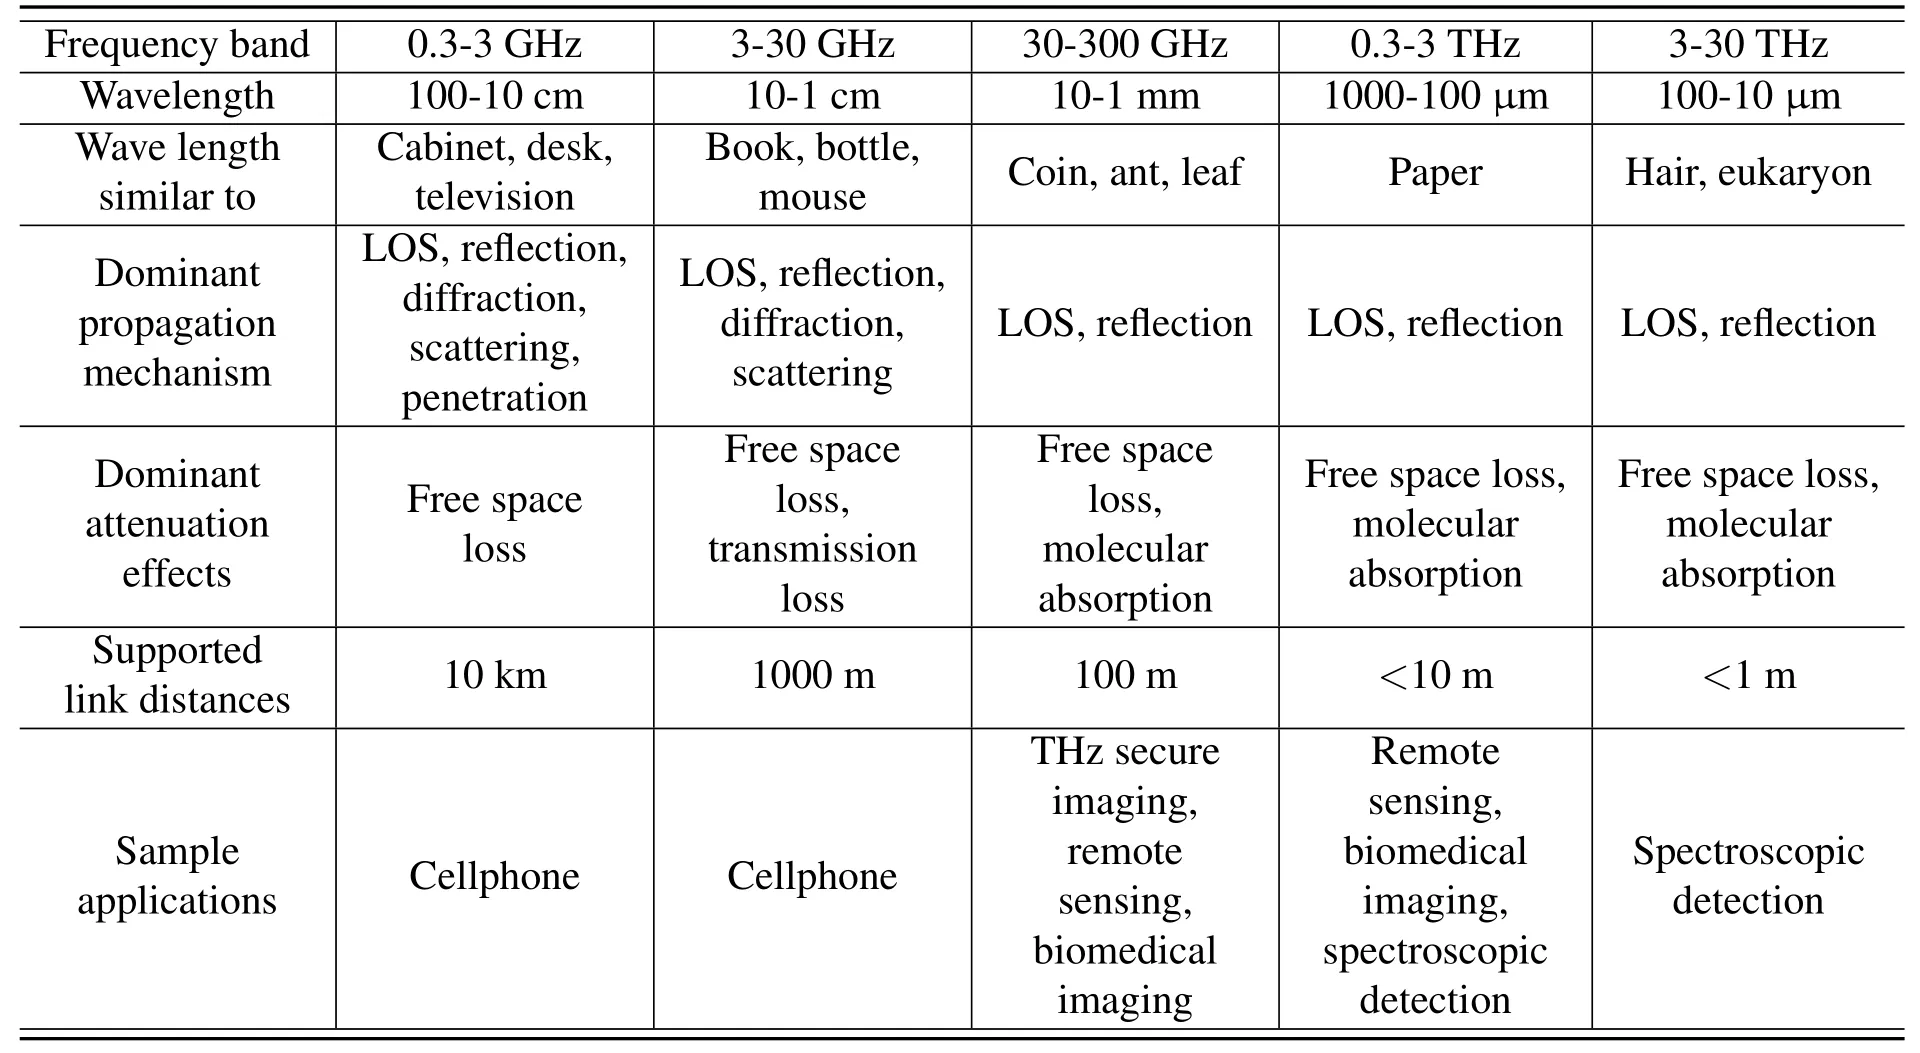
Table 1.The characteristics of radio wave from 0.3 GHz to 30 THz[5].
In a nutshell,THz channel measuring and modeling have been done in some THz bands.However,due to the large frequency span,more channel measurements should be conducted in THz bands to understand the THz channel characteristics.Furthermore,the frequency dependence of channel characteristics is worth getting more concerns.
1.2 Contributions of This Paper
In this paper,we present an extensive channel measurement campaign in the frequency range 220-330 GHz in an indoor short-range scenario,which was conducted by using a wideband channel sounder.Based on the measured data,we analyze and model the path loss using both the single-frequency model and the multiple-frequencies model.Furthermore,the obtained path loss models are used to analyze the cellular performance of THz communication systems.The contributions of this paper are as follows:
·We present an extensive channel campaign in a large frequency span from 220 GHz to 330 GHz in an indoor short-range scenario.The channel sounder setup,measurement procedures,and the system calibration method are introduced.
·We derive single-frequency path loss models at 22 frequency points based on measured data.Also,the frequency dependence and distance dependence are modeled in the meantime by using a multiple-frequencies path loss model.Obtained models can contribute to the standardization of 6G channel models.
·We analyze the cellular coverage and channel capacity of THz communication systems via using obtained path loss models in simulations.Comparisons with microwave and millimeter wave communication systems are given to provide insight into the designing and optimization of THz communication systems.
1.3 Paper Organization
The rest of this paper is organized as follows.Section II introduces measurement platform,measurement environment,and measurement procedures.Section III describe the single-frequency path loss model and the multiple-frequencies path loss model.The results and analysis of path loss modeling are presented in Section IV.Section V investigates the cellular performance of THz communication systems.Finally,Section VI concludes this paper.
II.TERAHERTZ CHANNEL MEASUREMENTS
Channel measurement is a direct and effective method of extracting channel characteristics.It is also the prerequisite for building statistical channel models[35].In this paper,we use a wideband channel sounder to conduct extensive channel measurements in the frequency range 220-330 GHz.In the following,we would introduce the channel sounder setup,measurement procedures,and the system calibration method.
2.1 Channel Sounder Setup
The structure of the measurement system is depicted in Figure 2.At the transmitter(TX)side,a vector signal generator(R&S SMW 200A)is used to generate the intermediate frequency(IF)signal.In the baseband,a periodic 12000 sample Frank-Zadoff-Chu(FZC)sequence with a duration of 5 μs was modulated using amplitude shift keying(ASK).For the frequency extender,it multiplies a local oscillator(LO)signal generated by a signal generator(R&S SMB 100A)with a factor of 18.Then,the IF signal is mixed with the LO signal and extended up into the THz range.A horn antenna with high gain is used to transmit the THz signal channel.At the receiver(RX)side,the transmitted signal is received by a horn antenna,and then is downconverted into the IF signal through a frequency extender.A spectrum analyzer(R&S FSW 43)is utilized to demodulate the IF signal.In the baseband,12000 IQ signal samples are obtained with a sample rate of 2.4 GHz.After data processing in the laptop,the channel impulse response(CIR)in the measured scenario can be derived.The patterns of used antennas in the frequency range 220-330 GHz are measured in an anechoic chamber.The antenna gain ranges from 24.8 dBi to 28.6 dBi.Figure 3 shows the antenna pattern in both the horizontal plane and the elevation plane at 230 GHz.The antenna gain is 26 dBi.Half power beam width(HPBW)in the horizontal plane is about 7.5°while it is about 10°in the elevation plane1.Details of the channel sounder setup are listed in Table 2.
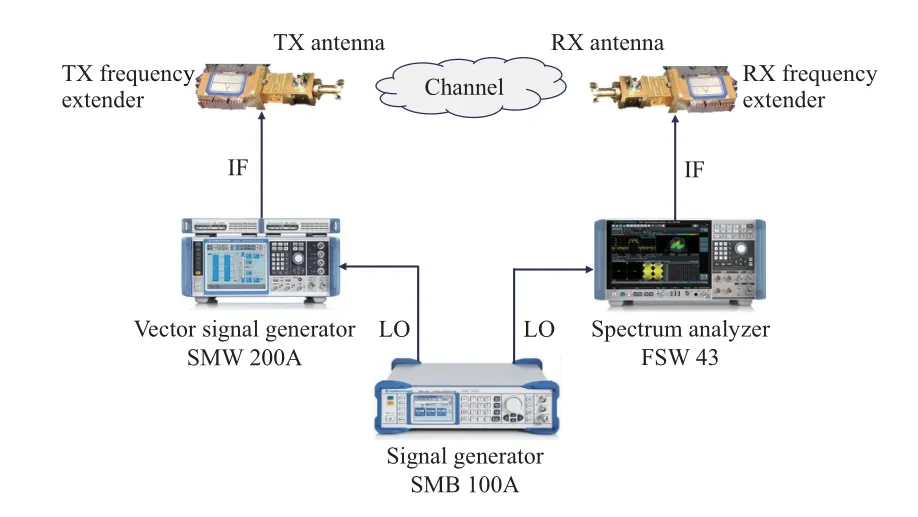
Figure 2.The diagram of the THz channel sounder.
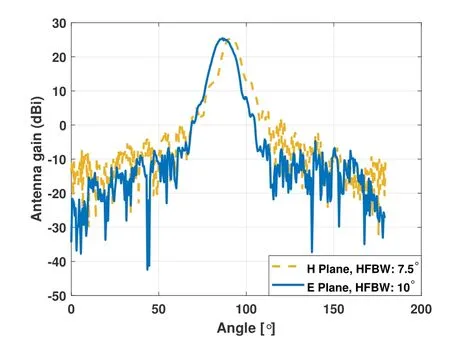
Figure 3.The antenna pattern in the horizontal plane and the elevation plane at 230 GHz.The antenna gain is 26 dBi.
2.2 System Calibration
The sampled IQ data contains the system response.To remove the effects of systems on channel characteristics and get real CIRs,a back-to-back calibration should be made before conducting measuring[36,37].
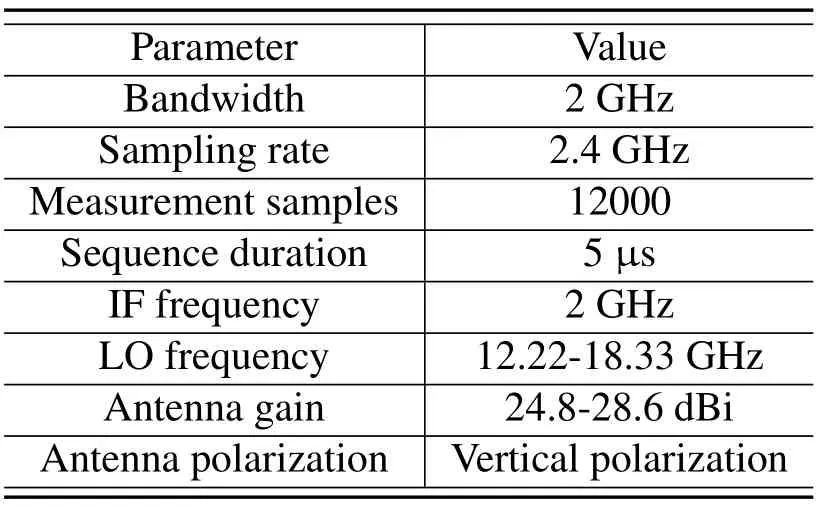
Table 2.The channel sounder setup.
The received signal in the time domain can be written as

where“*”denotes convolution in the time domain,FZC(t)is the transmitted signal,h(t)is the CIR,sT(t)is the TX response function,andANTT(t)is the antenna response function.The subscript“R”represents the function at the RX side.Through directly connecting the TX and the RX using an attenuator,the calibration signal can be expressed as

whereATT(t)is the attenuator response function.
By taking the Fourier transform of the above equations and assuming that the system is linear,we can get the ratio of the received signal data to the calibration signal data as

The antenna response can be obtained by measuring in an anechoic chamber,and the attenuator response can be measured using a vector network analyzer(VNA).Then,we can get the CIR by

whereF-1is the Inverse Fourier Transform(IFT).
Then,we can get path loss values by

whereτiis theith delay bin andLis the number of delay bins.
2.3 Measurement Procedures
Based on the above channel sounder setup and calibration method,we conducted an extensive channel measurement campaign on an optical experimental platform in the frequency range 220-330 GHz.Optical fixing instruments were used to fix the frequency extenders,and make sure that those two frequency extenders are in alignment.As shown in Figure 4,TX was fixed in the original point,and RX was moved along the line with a distance step of 0.1 m2.A total of 20 LOS positions covering a distance from 0.1 m to 2 m were measured.In each measurement position,we conducted measurements at 12 frequency points from 220 GHz to 330 GHz with a step of 10 GHz and 10 frequency points from 234 GHz to 324 GHz with a step of 10 GHz.In each measurement,50 snapshots of IQ data were collected.

Figure 4.The sketch map of measurement procedures.

Figure 5.The map of measurement scenarios.
III.PATH LOSS MODELS
The path loss is the reduction in power density of a radio wave as it propagates through the channel,which is normally caused by the natural expansion of the radio wave-front in free space,absorption losses,diffraction losses,and so on[21,38].It is important for coverage prediction and interference analysis of radio communication systems[39-41].According to the definition of path loss,it can be defined by[42]

wherePTandPRare the transmitted power and the received power,respectively.In free space,the received power is a function of distance,also knows as Friis’law[21]

whereGTandGRare the antenna gain at the TX side and the RX side,respectively,λis the wavelength,dis the spatial distance between the base station(BS)and the user equipment(UE).Correspondingly,the free space path loss(FSPL)can be expressed as

wherefis the frequency of a radio wave,cis the speed of light,andfis equal tocdivided byλ.
In the realistic environment,the path loss is highly related to the environment.The FSPL model is not able to reflect the actual propagation characteristics.In 5G,three kinds of path loss models,i.e.,the close-in(CI)model,the floating-intercept(FI)model,and the Alpha-Beta-Gamma(ABG)model,are always used to characterize the power attenuation during propagation[43,23,44].The CI model and the FI model are both single-frequency path loss models3.They can only model the path loss at one special frequency.The ABG model is a multiple-frequencies path loss model that can describe the fading in continuous bands.The CI model can be written as

whered0is a physically-based reference distance,nis the PLE,andis a zero mean Gaussian random variable with a standard derivation ofσin dB,which characterizes the shadow fading.d0is set to 0.1 m in this paper.The CI model has only one variablenthat can be derived by using the minimum mean-square error(MMSE)approach,i.e.,fitting the measured data with the smallest error.Thus the complexity of the CI model is relatively low.
Compared with the CI model,the FI model does not consider the physical reference distance.It can be expressed as

whereαis the floating-intercept,βis the slope of the model,andis a zero-mean Gaussian variable with a standard derivationσrepresenting the shadowing.Similar to the CI model,two variablesαandβcan be obtained by minimizingσ.Since the intercept is modeled as a variable,the FI model normally gets smallerσbased on the same measured data compared with the CI model.This means that the FI model can predicate path loss more accurately in a specific environment.However,the CI model is more robust because it has a physical relationship to transmitted power.
The CI model and the FI model are not able to reflect the frequency dependence.On the contrary,ABG model does not only consider the distance dependence but also the frequency dependence[45,43,46].It can be written as

whered0is the received-power reference point(It is set to 0.1 m in this paper),αandγare the distance and frequency dependence on path loss,respectively,βis the optimized offset in path loss,andhas the same physical meaning with.In this ABG model,we can see that path loss varies with the frequency and the spatial distance.
IV.RESULTS AND ANALYSIS FOR PATH LOSS MODELS FROM 220 GHZ TO 33O GHZ
This section would show path loss modeling results and analysis by using both the single-frequency path loss model(CI model and FI model)and the multiplefrequencies path loss model(ABG model).Firstly,we present the modeling results at all measured frequency points.Comparisons with the FSPL model and the International Telecommunication Union(ITU)indoor path loss model are given.Secondly,the frequency dependence is investigated based on the ABG model.
4.1 Single-frequency Path Loss Results
We have conducted measurements at 22 frequency points from 220 GHz to 330 GHz.Due to the limit of space,we only plot the results at 230 GHz,250 GHz,270 GHz,290 GHz,310 GHz,and 330 GHz.But model parameters at all measured 22 frequency points are given in the following text.
Figure 6 shows measured path loss data,CI model results,and FI model results.The FSPL model and the ITU indoor path loss model are also plotted to do comparisons.The ITU indoor path loss model can be written as[44].

This is a CI model with a PLEnof 1.73.To make that figure look clear,50 measured path loss samples at each distance are averaged and presented by circles.We can see that most circles are above the dotted line and the dash-dot line,representing the FSPL model and the 3GPP path loss model,respectively.This means that most measured path loss results are larger than the predication results of the FI model and the 3GPP model.And the actual propagation attenuation is severer.Though the measured distance is close and it is like free space,the atmosphere absorption is not able to be ignored[47,48].The FSPL model and the ITU model both do not consider the atmosphere absorption.At some frequency points,e.g.,310 GHz,it is found that the propagation attenuation is not as severe as that in free space.This may result from physical reasons.For instance,with a special wavelength,the atmosphere absorption is relatively small.As discussed in[49],several spectrum windows with lower absorption losses exist.
For the fitting results,it shows that the CI model and FI model both fit well with measured path loss samples.Also,these two models get similar fitting results.For example,at 270 GHz,the CI model line seems to overlap with the FI model line.These two models both perform well in predicting the path loss.This coincides with the conclusion in[50].Furthermore,there is a discrepancy between the fitting results and the ITU model.At 290 GHz,the discrepancy is about 4 dB between the FI mode line and the ITU model line.Table 3 lists fitting parameters of the CI model and the FI model at 22 frequency points from 220 GHz to 330 GHz.We can see that as explained in Section III,the CI model has a relatively larger standard derivation compared with the FI model.Furthermore,for the CI model,the frequency dependence of the PLE is not apparent.It gets the smallest PLE(1.83)at 310 GHz while it is 2.51 at 320 GHz.However,for the FI model,it seems that as the frequency increases,the slope has a decreasing trend.At 330 GHz,it gets the smallest slope(1.75).In the following,further investigation on the frequency dependence is given by using a multiple-frequencies path loss model.
4.2 Multiple-frequencies Path Loss Results
Frequency dependence plays an important role in understanding the channel characteristics in an extrawide frequency range.To further investigate the frequency dependence of path loss,we use the ABG model to fit the measured path loss.As shown in Figure 7,the measured path loss and the ABG model are plotted.The derived parameters of the ABG model areα=1.93,β=13.27,γ=2.1,andσ=3.78.It denotes that the frequency dependence is a little stronger than that in the free space.[31]also gave an investigation on the frequency dependence in the frequency range 140-220 GHz.But measurement results indicate that the average value of path loss over the band is pretty similar,and the frequency dependence of the path loss is not apparent.Maybe more measurements are needed to demonstrate that.On the other hand,we investigate that there is a trough at 310 GHz while it is a peak at 220 GHz.This indicates that frequency selectivity exists in some special frequencies.Figure 8 shows specific attenuation at frequencies up to 1000 GHz due to dry air and water vapour[51].Oxygen absorption causes most of the loss from the dry air.Furthermore,attenuation peaks arise in some specific frequency points,e.g.,60 GHz and 119 GHz.It seems that the increase in FSPL is small when moving into the THz bands from millimeter wave bands while the atmosphere absorption becomes more and more influential.
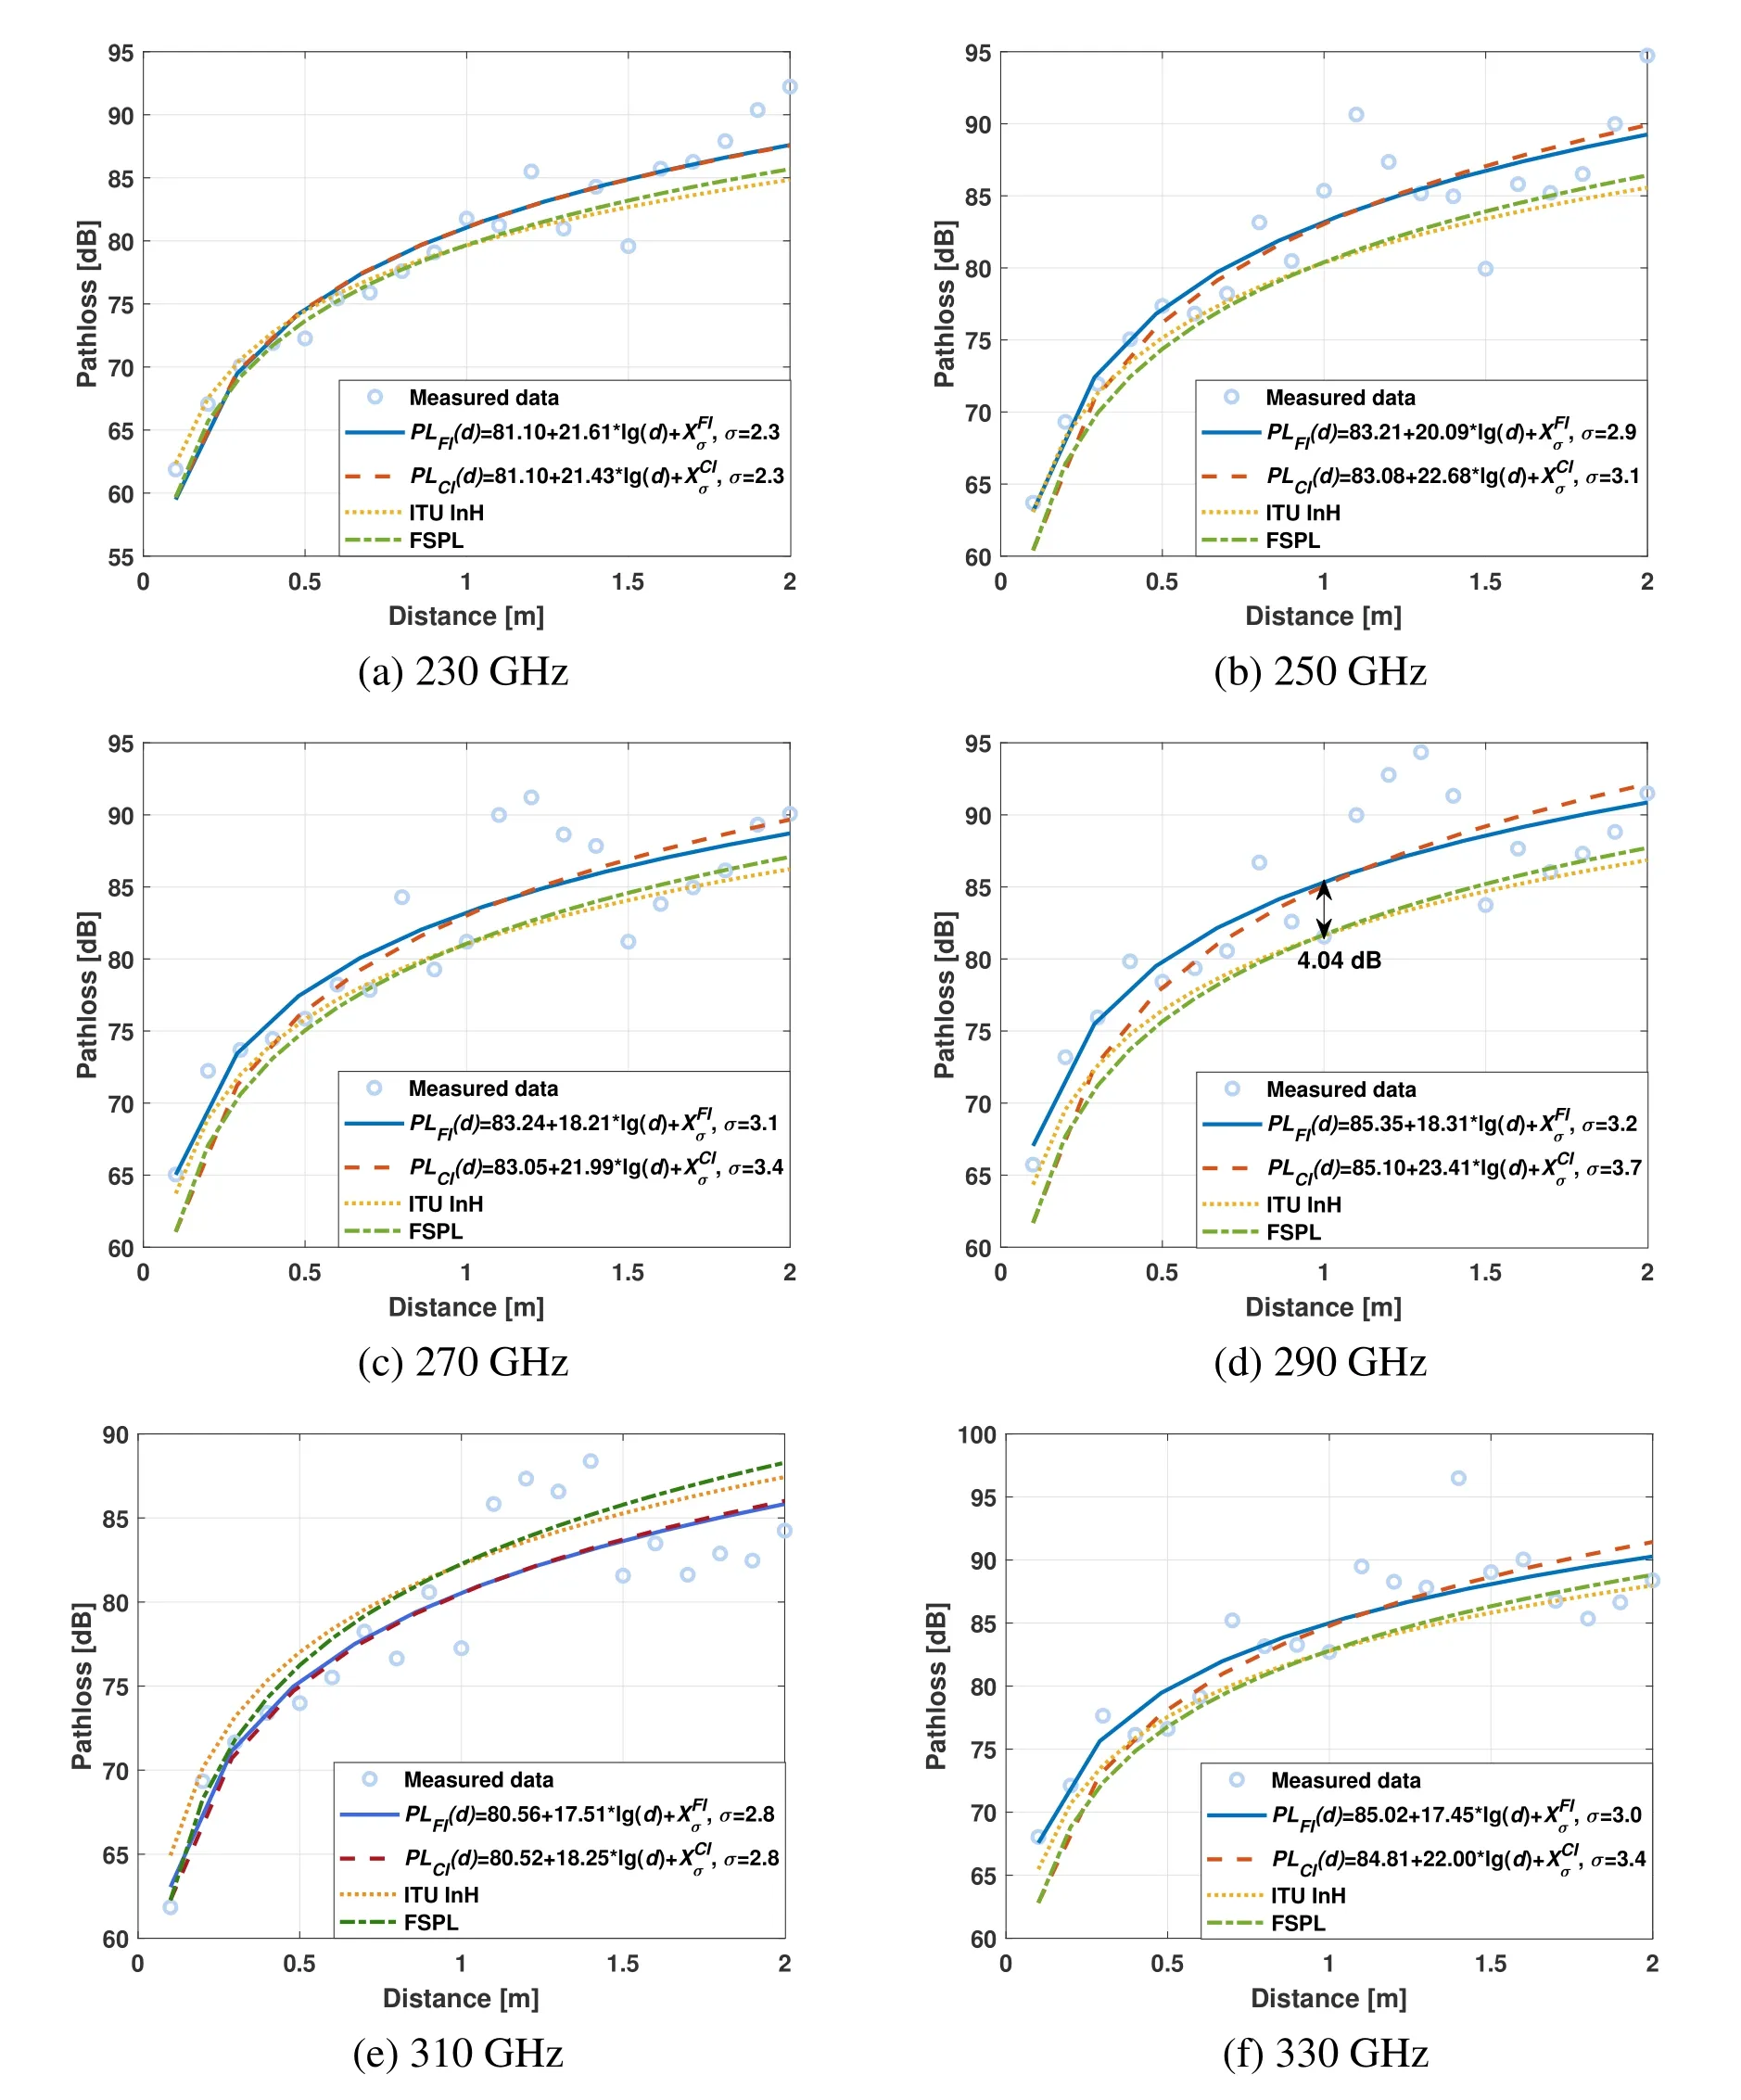
Figure 6.Path loss results at 6 frequency points.The circles denotes the averaged path loss samples at one distance.The solid line,dashed line,dotted line,and dash-dot line represents the FI model,the CI model,the 3GPP indoor hotspot office model,and the FSPL model,respectively.
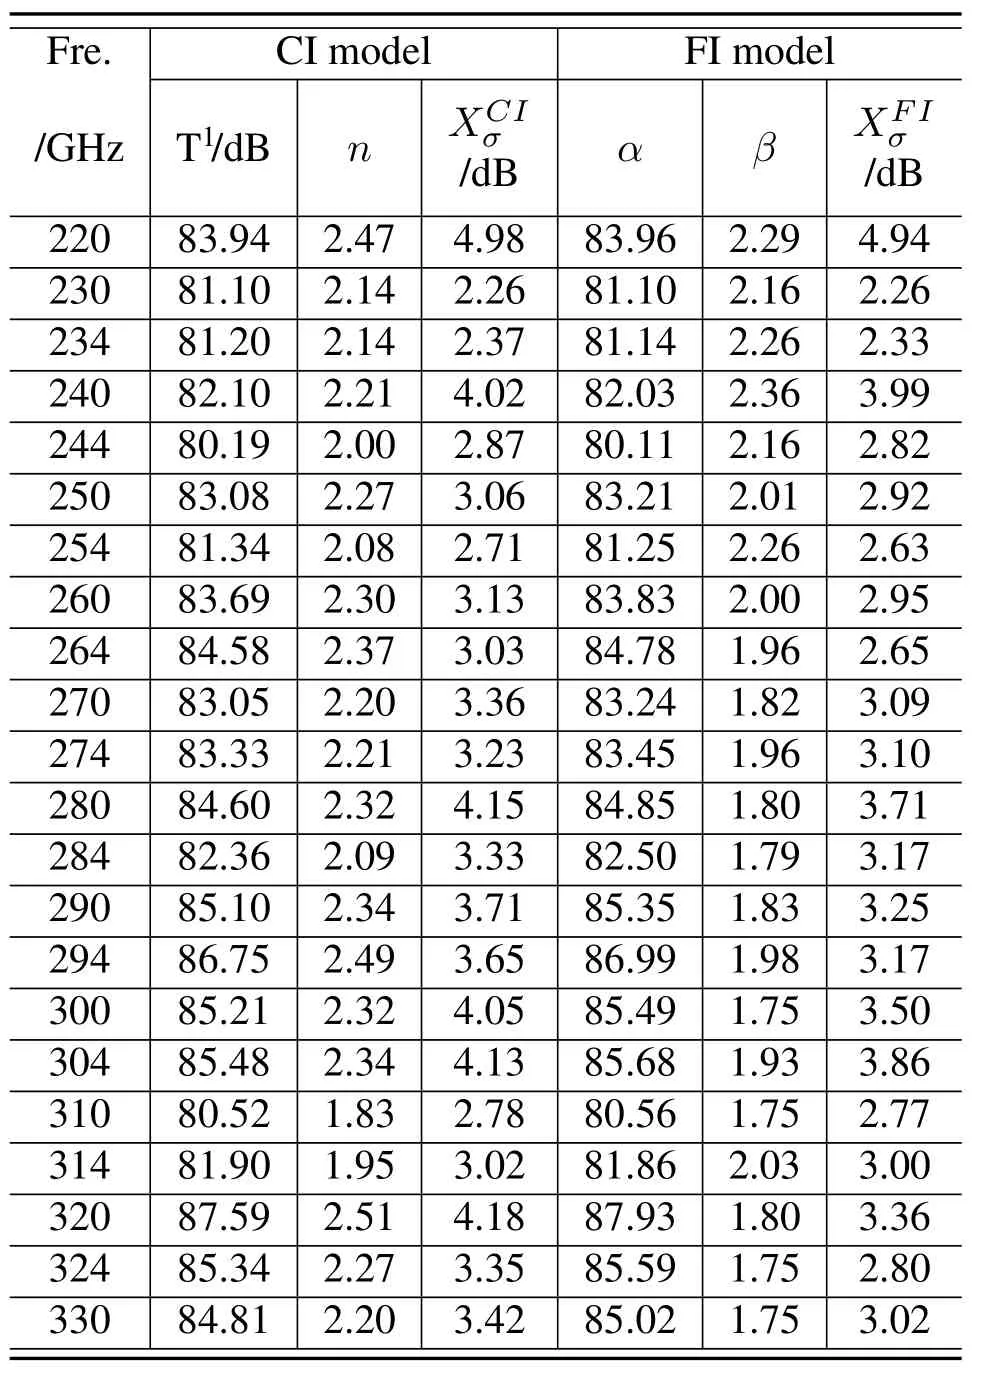
Table 3.CI and FI model parameters from 220 GHz to 330 GHz.
V.CELLULAR PERFORMANCE EVALUATION FOR THZ NETWORKS
Path loss is useful for predicting signal attenuation.Thus,by combining the link budget with a path loss model,the coverage range of the base station can be estimated[52,38].Appropriate coverage range can provide a strong enough signal for users and weak the inter-cell interference[53].Here,we would use obtained THz path loss models to make a primary simulation to compare current networks to future THz networks in terms of cellular performance.
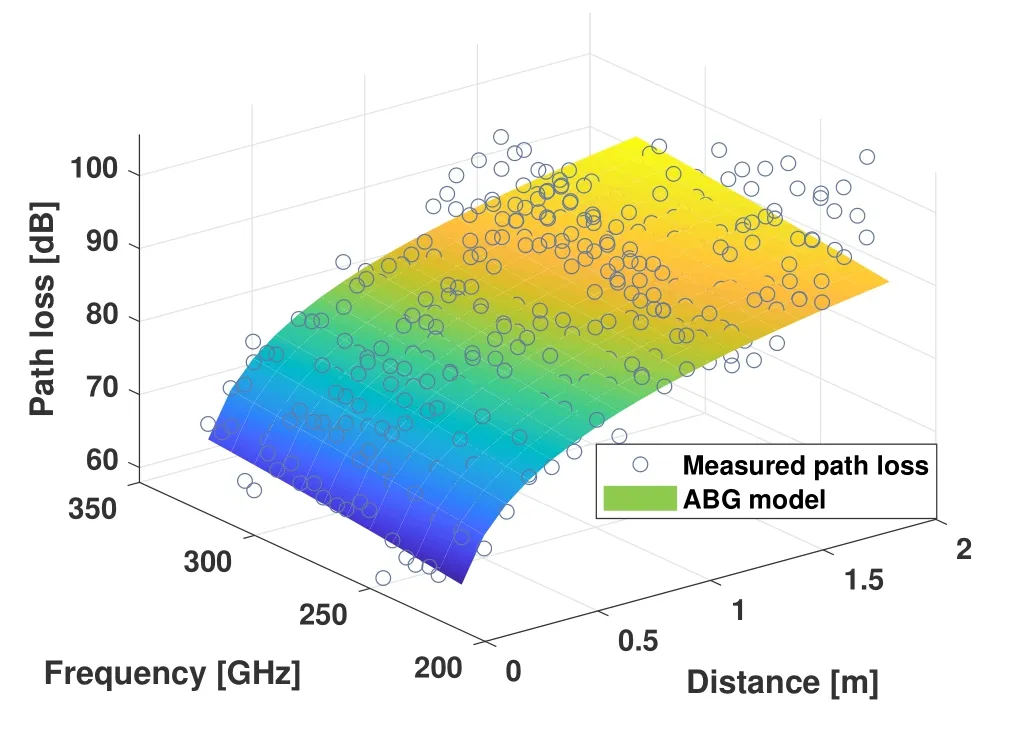
Figure 7.Multiple-frequencies path loss modeling results.
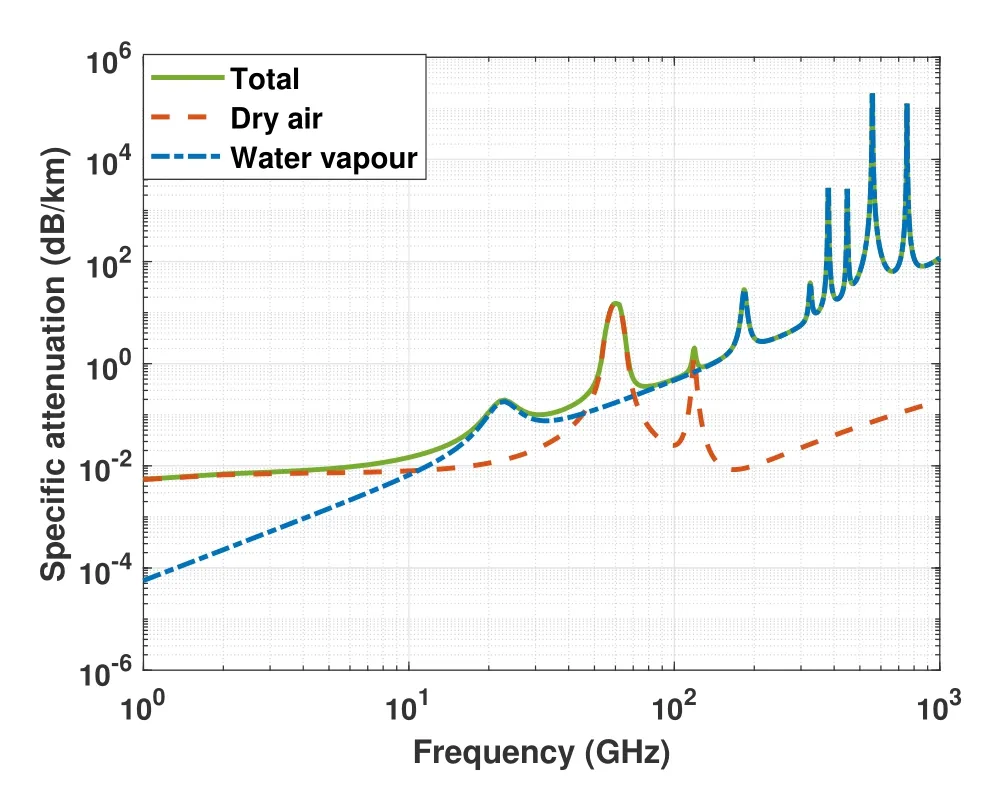
Figure 8.The frequency dependent atmosphere absorption loss[51].
Considering that THz communication technologies are more possible to be used in indoor short-range scenarios due to the high propagation attenuation,an indoor office scenario is chosen in simulations.It is worth noting that the obtained path loss model is only valid for the LOS condition.Building penetration losses or human body shadowing are not considered.Furthermore,though the maximum measurement distance is 2 m,the measurement based path loss model can provide an insight into propagation characteristics,and give a prediction on the path loss in a longer distance.Table 4 shows simulation configurations for an indoor hotspot scenario,which refer to evaluation configurations in ITU-R M.2412[23].Three typical frequency points,i.e.,3.5 GHz,30 GHz,and 285 GHz,are chosen to represent the microwave band,the millimeter wave band,and the THz band,respectively.In simulations,we assume that the BS and UE are placed in the 3D space,with a height of 3 m and 1.5 m,respectively.Furthermore,BS transmits the signal with a power of 24 dBm.And,10000 UEs are randomly and uniformly distributed over the cell4.
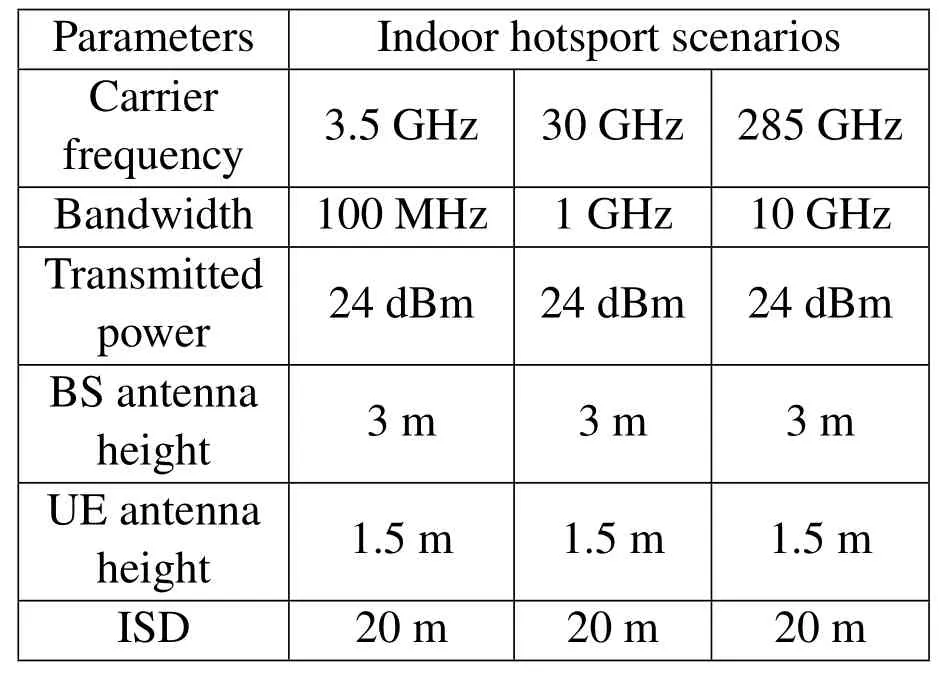
Table 4.Simulation configurations for an indoor hotspot scenario.
Figure 9 describes the cumulative distribution function(CDF)of the signal power received by UEs,and Table 5 gives results at probabilities of 10%,25%,50%,75%,and 90%.We can see that the UE received power at 285 GHz in a cell is extremely smaller than that at 3.5 GHz,having a discrepancy of 42.75 dBm at a probability of 50%.Compared to the UE received power at 30 GHz,the discrepancy is 24.1 dBm.Also,if the desired minimum received power is-75 dBm in practical systems[54],almost 75%UEs in the cell are not able to communicate with BS.The distribution of UEs at 285 GHz is drawn in Figure 10.The color represents the received power.It shows that UEs around the cell edge receive weak signal power.This indicates that the ISD set for the 5G indoor hotspot scenarios may not be suitable for future THz communications,and the cell density should be increased.
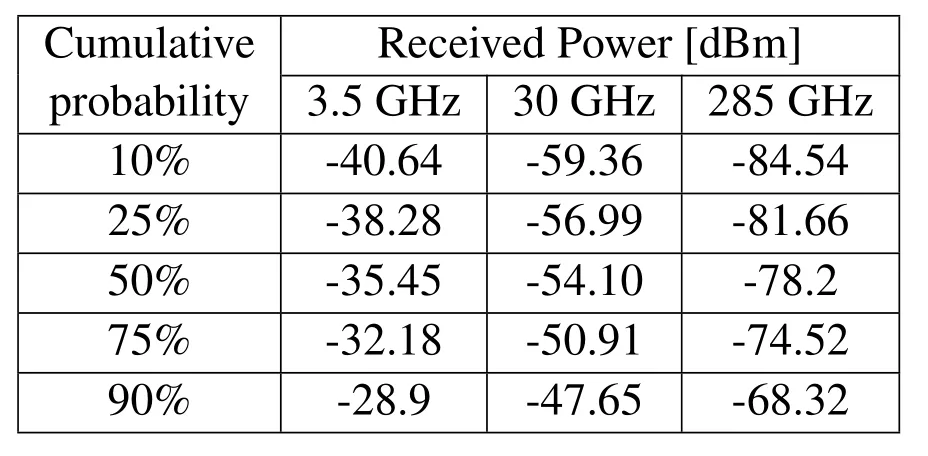
Table 5.CDF of received power at special probabilities in a cell for an indoor hotspot scenario.
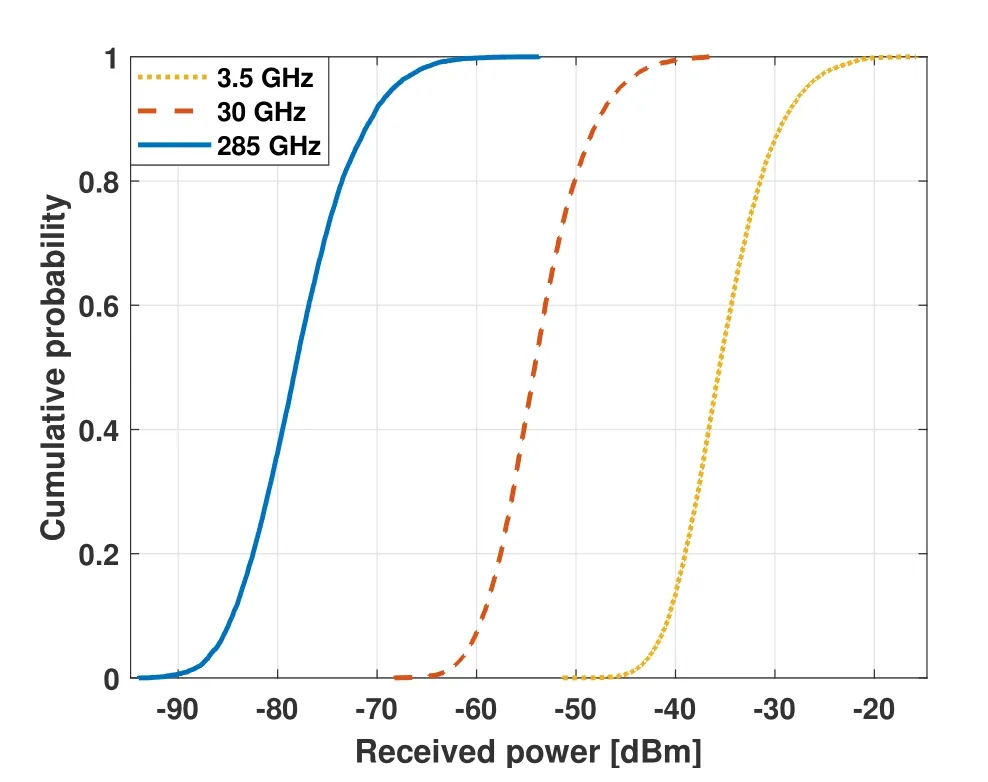
Figure 9.CDF of received power at 3.5 GHz,30 GHz,and 285 GHz in a cell for an indoor hotsport scenario.
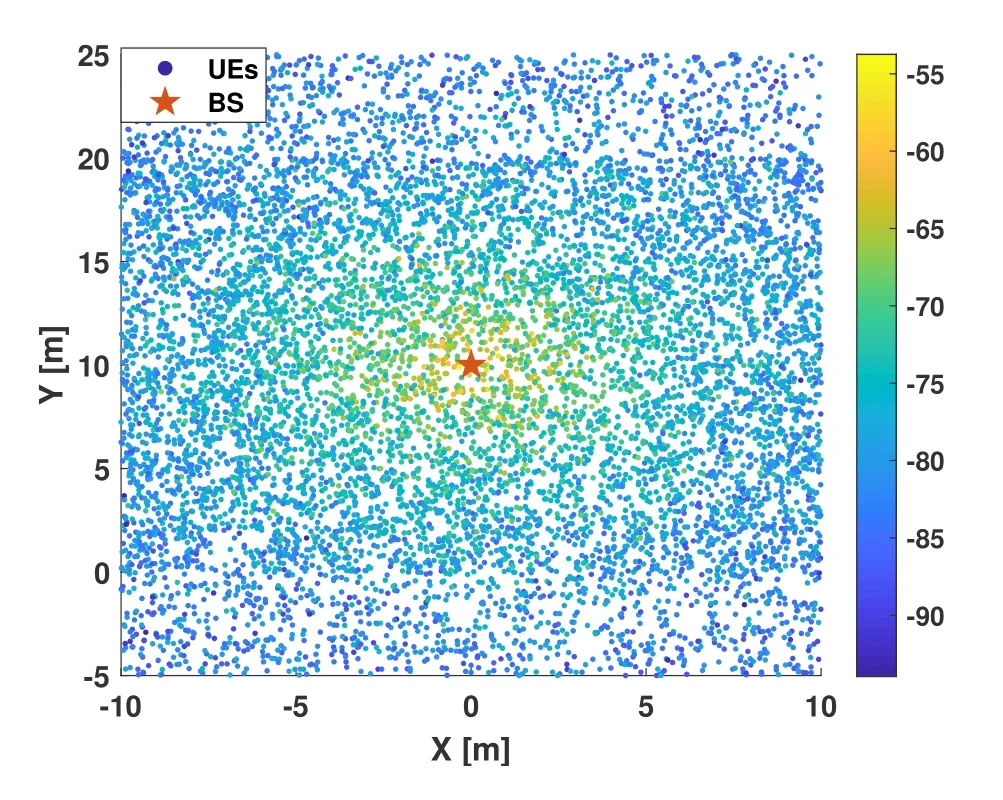
Figure 10.The distribution of UEs at 285 GHz.The color represents the received power.
The channel capacity is another important indicator of cellular performance.The most important advantage of applying THz communication is that the capacity can be improved greatly.The capacity can be estimated as

whereBdenotes the channel bandwidth,andRdenotes the carrier-to-interference-plus-noise ratio.In the indoor hotspot scenarios,assuming there are 3 interfering cells for a given BS[23],the estimated carrier-to-interference ratio can be calculated by[54]

wheredis the distance between the BS and the UE,Dis the ISD,andPUE(d)is the UE received power.PUE(d)can be estimated by

Figure 11 shows the channel capacity simulation at 3.5 GHz,30 GHz,and 285 GHz.In the simulation,the ITU indoor path loss model and the obtained path loss model for the THz band are used to calculate the carrier-to-interference ratio.We can see that the capacity of the THz communication system is over 10 times that at 30 GHz,and 100 times that at 3.5 GHz.Basically,this capacity gain results from the increasement of bandwidth.
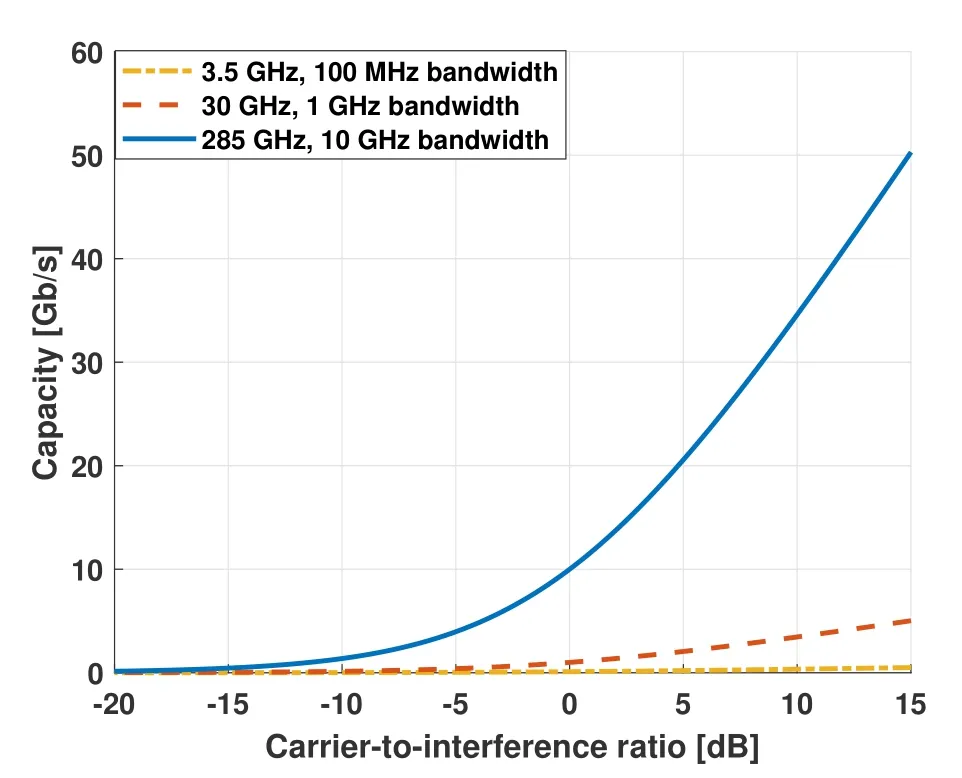
Figure 11.Capacity analysis at 3.5 GHz,30 GHz,and 285 GHz.
VI.CONCLUSION
This paper focuses on the path loss modeling and analysis in THz bands.Based on an extensive measurement campaign in the frequency range 220-330 GHz in an indoor short-range scenario,we derive the path loss modeling results in 22 measured frequency points using the single-frequency path loss model.Also,the frequency dependence of path loss is investigated by fitting all measured data with a multiple-frequencies path loss model.The obtained frequency exponent is 2.1.This indicates that there is a little stronger frequency dependence than that in free space.Furthermore,path loss variation over the measured bands is observed,which may be caused by atmosphere absorption.By using the obtained path loss model,the cellular performance of future THz networks is analyzed,and comparisons with 5G networks are made.Simulation results tell that the current inter-site distance for 5G networks is too large for future THz networks.The cell-density should be increased to make users get strong enough signal power.Moreover,it is demonstrated that THz communication can do bring great capacity gain due to the large bandwidth.Generally,this work can contribute to the standardization of 6G channel models,and help to design and optimize 6G communication systems.
A?CKNOWLEDGEMENT
The work is supported by the National Science Fund for Distinguished Young Scholars(No.61925102),the National Key R&D Program of China(No.2020YFB1805002),the Key Project of State Key Lab of Networking and Switching Technology(No.NST20180105),BUPT-CMCC Joint Innovation Center.Furthermore,the authors are grateful to acknowledge Xiaolei Wu,Jiuzhou Han,and Zhongxin Zhao for their help in channel measurements.
- China Communications的其它文章
- Towards 6G:Paradigm of Realistic Terahertz Channel Modeling
- Terahertz Wireless CommunicationS
- THz Channel Modeling:Consolidating the Road to THz Communications
- A 3-D Hybrid Dynamic Channel Model for Indoor THz Communications
- Wideband Channel Estimation for THz Massive MIMO
- Hybrid Precoding for Cluster-Based Multi-Carrier Beam Division Multiple Access in Terahertz Wireless Communications

