
Framework of automated value stream mapping for lean production under the Industry 4.0 paradigm*
2021-05-21 10:50HaonanWANGQiqiHEZhengZHANGTaoPENGRenzhongTANG
Hao-nan WANG,Qi-qi HE,Zheng ZHANG,Tao PENG†‡,2,Ren-zhong TANG,3
1State Key Laboratory of Fluid Power and Mechatronic Systems,School of Mechanical Engineering,Zhejiang University,Hangzhou 310027,China
2Key Laboratory of 3D Printing Process and Equipment of Zhejiang Province,Zhejiang University,Hangzhou 310027,China
3Key Laboratory of Advanced Manufacturing Technology of Zhejiang Province,Zhejiang University,Hangzhou 310027,China
Abstract:For efficient use of value stream mapping (VSM) for multi-varieties and small batch production in a data-rich environment enabled by Industry 4.0 technologies,a systematic framework of VSM to rejuvenate traditional lean tools is proposed.It addresses the issue that traditional VSM requires intensive on-site investigation and replies on experience,which hinders decisionmaking efficiency in dynamic and complex environments.The proposed framework follows the data-information-knowledge hierarchy model,and demonstrates how data can be collected in a production workshop,processed into information,and then interpreted into knowledge.In this paper,the necessity and limitations of VSM in automated root cause analysis are first discussed,with a literature review on lean production tools,especially VSM and VSM-based decision making in Industry 4.0.An implementation case of a furniture manufacturer in China is presented,where decision tree algorithm was used for automated root cause analysis.The results indicate that automated VSM can make good use of production data to cater for multi-varieties and small batch production with timely on-site waste identification and analysis.The proposed framework is also suggested as a guideline to renew other lean tools for reliable and efficient decision-making.
Key words:Value stream mapping (VSM);Root cause analysis;Automated decision-making;Lean production tools;Industry 4.0
1 Introduction
To meet diverse customer needs and rapidly respond to market dynamics,the production mode of manufacturing enterprises has shifted from mass production to multi-varieties and small batches.Multi-variety and small batch oriented manufacturing is more complex,featuring frequent production line changes and difficult standard time setting,which brings new challenges to manufacturers in cost reduction,and quality and productivity improvements(Dombrowski et al.,2017;Ku et al.,2020).To cope with these challenges,manufacturers are eager to find better ways to incorporate lean production tools in the context of Industry 4.0 (Mayr et al.,2018;Rossini et al.,2019).The traditional lean production tools were developed in the 1990s and initially used in simple and stable environments (Ramadan et al.,2020).The development of lean production tools from Industry 1.0 to 4.0 is shown in Fig.1.
In Industry 3.0,lean production tools were developed in parallel with internet and programmable logic controller (PLC) to jointly solve the problems.Over time,the lean house concept was gradually formed.In Industry 4.0,many researchers began to think about the development of a lean house.Lean production tools also need to integrate new technologies to meet the challenge caused by multivarieties and small batches.However,application of traditional lean production tools relies mostly on manual data collection and analysis,which is timeconsuming and costly to apply (Uriarte et al.,2018)and requires workers to be highly experienced in increasingly complex and dynamic environments(Longo et al.,2017).This often hinders the awareness,delays the decision response,and misses the improvement opportunity.With advances in information and communication technology (ICT),such as the internet of things (IoT),smart sensors,and big data,manufacturers have many technologies available to achieve digitalization and intelligence.This evokes new ideas for the applications of lean production tools (Ramadan et al.,2020).
Lean production tools include 5S,Kanban,value stream mapping (VSM),and total quality management (TQM),which are used to reduce cost,control process quality,and improve productivity by eliminating waste.Among these tools,VSM is a fundamental tool which can reduce the waste in material and information flows (Tamás,2016),identify bottlenecks,and indicate production performance,such as processing time and work-in-process (WIP) inventory (Solding and Gullander,2009;Rahani and Al-Ashraf,2012;Rohani and Zahraee,2015).Although VSM can identify waste and bottlenecks,the root causes require intensive on-site investigations and manual analysis which hinders decision-making efficiency,particularly in a dynamic and complex manufacturing environment.Data-informationknowledge mapping towards decision-making in the context of Industry 4.0 is also important (Badia,2014;Papacharalampopoulos et al.,2020).Therefore,to make good use of the streamed data and improve decision-making efficiency,we propose a systematic framework of automated VSM for lean production under the Industry 4.0 paradigm.The framework consists of three levels and introduces a new approach to collecting data,visualizing on-site manufacturing performance,and mining root causes automatically.These provide operators with the real-time production status of a smart workshop and a scientific decision basis which is suitable for multi-varieties and small batches,and features high flexibility and dynamic variability.
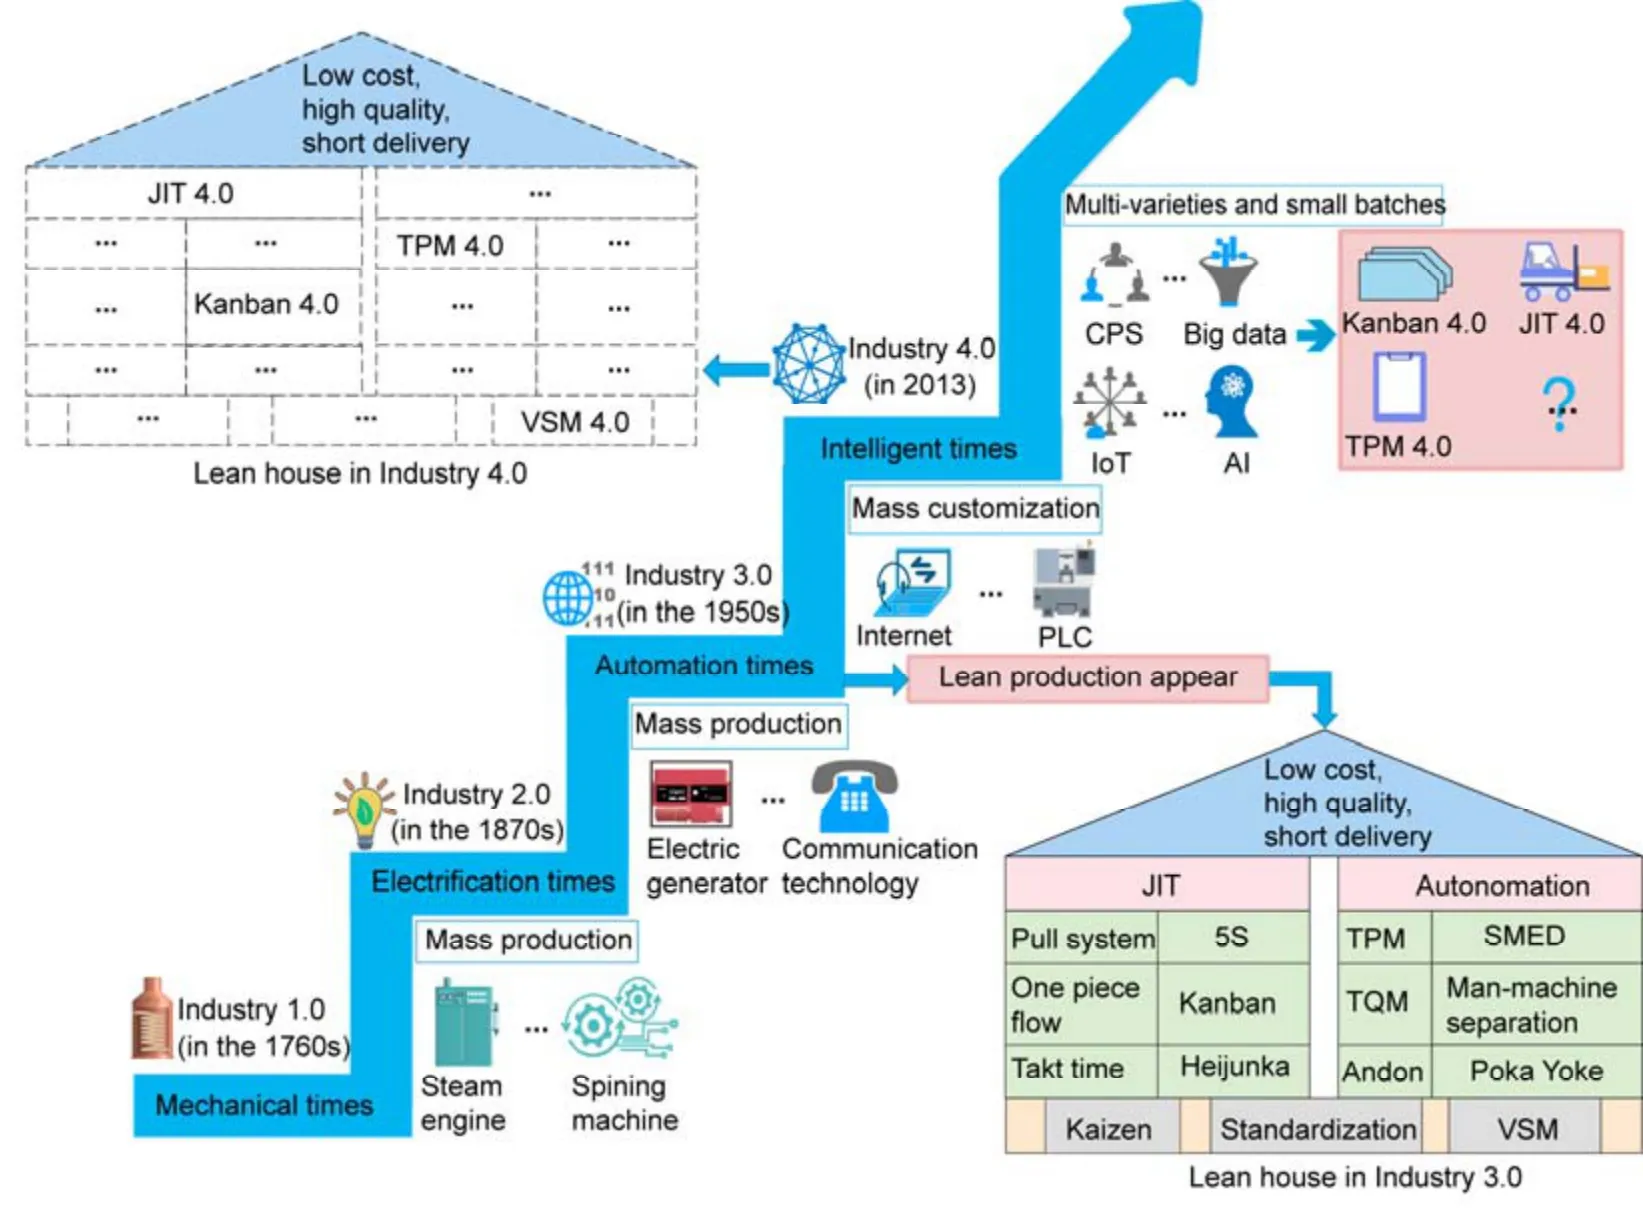
Fig.1 Development of lean production tools in Industry 1.0–4.0
2 Literature review
To further improve the competitiveness of manufacturing factories,the German government proposed the Industry 4.0 strategy in 2013 (Kagermann et al.,2013;Drath and Horch,2014).It is defined as“a real-time,intelligent,and digital network of people,devices,and objects for managing business processes and value creating networks,”which is enabled by advanced,cost-effective ICTs.These ICTs facilitate end-to-end communication among smart machines,products,systems,and operators in production and logistics processes,towards comprehensive data analysis,fine process control,and continuous improvements.They promote the maturing applications of pillar technologies,such as cyberphysical systems (CPS),IoT,cloud platforms,and radio frequency identification (RFID) (Fonseca,2018).CPS can integrate with physical entities related to production systems (Lins and Oliveira,2020).It ensures data collection and processing and meets multiple purposes of an organization (Xu et al.,2018).IoT is another main enabler for digitalization and smart factories which has changed the operation and role of industrial systems (Peruzzini et al.,2017).Manufacturing enterprises should be efficient,productive,and competitive to survive in complex and dynamic markets,and an Industry 4.0 strategy to achieve digitization and intelligence can help achieve this.The potential short and long term impacts of Industry 4.0 on industries in the global market are huge,and can meet the needs of customers in mass production (Xu et al.,2018).
2.1 Lean production tools in Industry 4.0
Lean production,or lean management,is recognized as the groundwork for Industry 4.0 (Prinz et al.,2018).Many researchers wanting to achieve a higher lean level have focused on how to use and improve existing lean production tools (Buer et al.,2018).ICTs can be incorporated in lean production tools in highly-customized,dynamic,and complex manufacturing environments (Kolberg et al.,2017;Buer et al.,2018;Prinz et al.,2018).Researchers also stated that the integration of these technologies with lean production tools can help manufacturing enterprises further improve production efficiency,reduce cost,and improve quality (Khanchanapong et al.,2014;Sanders et al.,2016;Moeuf et al.,2018).Mayr et al.(2018) suggested the introduction of various lean tools in Industry 4.0 such as Kanban 4.0,Just-in-time(JIT) 4.0,total productive maintenance (TPM) 4.0.They adopted a cloud-based,data-driven approach to improving the efficiency of implementing TPM.Wagner et al.(2017) introduced a conceptual integration framework enabled by CPS and JIT,and described the operational procedure.Shahin et al.(2020) proposed the fundamental elements and an implementation framework for cloud Kanban.Kolberg et al.(2017) described the combination of ICTs and Kanban in lean automation practice.
Although some lean production tools have been studied and improved in Industry 4.0,there is still a lack of a systematic and practice-oriented framework with holistic approaches to integrate lean tools (Ma et al.,2017;Prinz et al.,2018).Deuse et al.(2015)pointed out that existing integration frameworks cannot sufficiently reflect technology,human,and other elements.
2.2 Value stream mapping in Industry 4.0
VSM is often regarded as the starting point of lean improvement,and is of great significance to the promotion of lean projects (Tamás,2016).However,traditional VSM is used mainly in serial production lines that produce a single product or a single family of products.It now faces challenges in data-rich environments performing real-time data processing,visualization,and decision-making assistance,and consequently is not well suited to manufacturing sites with diverse products,unstable batches,and frequent line changes (Dotoli et al.,2011;Schönemann et al.,2016;Balaji et al.,2020).Lian and van Landeghem(2007) pointed out that the data for VSM could be collected from multiple information systems,e.g.manufacturing execution system (MES),enterprise resource planning (ERP),and supply chain management (SCM),but poor data interoperability makes subsequent processing very time-consuming.Traditional VSM demonstrates the system performance during a certain time,which is a rather static and snapshot-type description of a production system,and it is costly to continuously visualize dynamic performance using VSM (Stadnicka and Litwin,2019).
In this paper,a systematic framework of automated VSM for lean production under the Industry 4.0 paradigm is proposed to showcase how VSM can be rejuvenated in future manufacturing.
Advances in ICTs accelerate the transformation of manufacturing in Industry 4.0 by enabling data collection and exchange anytime anywhere,providing manufacturers with a new and important form of asset,data.How to mine the data,extract the information,and form knowledge in a timely fashion has been the most challenging task.Lean production tools,in particular VSM,have been shown to be useful in practice,and need to incorporate this data.The literature reviewed here suggests that there have been few studies on how to improve the efficiency of VSM to assist decision-making in such a data-rich environment.Therefore,in this paper we propose a systematic framework of automated VSM to rejuvenate lean production tools in the Industry 4.0 era.An implementation case of a furniture manufacturer in China is introduced to help readers better understand the framework.
However,such integration has focused mainly on real-time data collection and visualization,and few studies have reported on how to conduct in-depth data mining and automate root cause analysis.Papacharalampopoulos et al.(2020) emphasized that automatic root cause identification in a manufacturing site can greatly improve decision-making efficiency,which in practice still relies heavily on managers’ experience and expertise.It is difficult and costly to cope with dynamic manufacturing conditions,and responses are often delayed.Chen and Chen (2014) used the 5Why tool to make improvement plans based on root cause mining,after automatically collecting data and creating VSM in an ORFPM system.The timeliness of the improvement effect needs further investigation.Badia (2014) proposed the data-information-knowledge hierarchy model,which explains the relationship between data,information,and knowledge in detail.This inspired our current study on VSM and Industry 4.0 technologies.
The data on a task card,such as card number,delivery time,arrive time,and swipe time are also collected.Bill of material,process,customer,and supplier data are extracted from product lifecycle management(PLM),ERP,and SCM.These data are preprocessed and reviewed for VSM.The partial preprocessing process is shown in Fig.4.
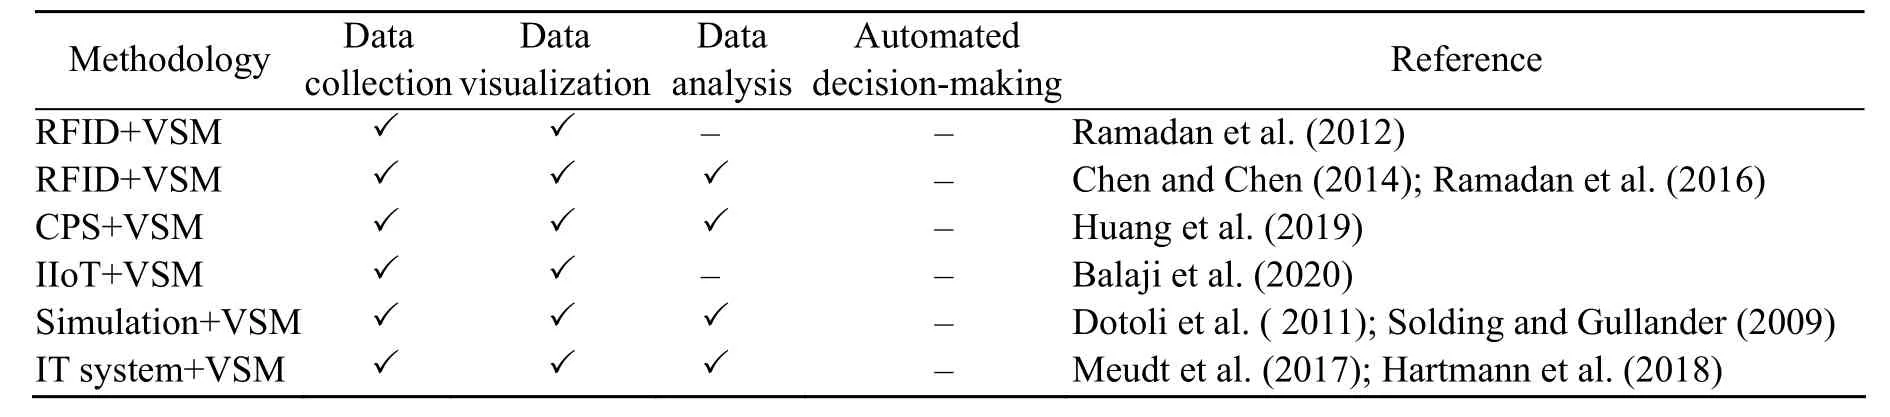
Table 1 Summary of VSM and Industry 4.0 technology integration
To solve the above challenges,some researchers have adopted Industry 4.0 technologies to improve the traditional VSM.In these studies,terms such as dynamic value stream mapping (DVSM) and value stream mapping 4.0 (VSM4.0) emerged.DVSM and VSM4.0 can display the real-time manufacturing performance of a whole process through the data acquisition system.DVSM mainly focuses on the waste of materials in the production process,while VSM4.0 focuses on the waste of the information flow.DVSM was defined as“a digitalized event-driven lean-based IT system that runs in real-time according to lean principles that cover all manufacturing aspects through a diversity of powerful practices and tools that are mutually supportive and synergize well together to effectively reduce wastes and maximize value”(Ramadan,2016).Thus,DVSM connects production factors such as equipment,workers,and materials based on the integration of traditional VSM and Industry 4.0 technologies,so as to achieve real-time data transmission and display of production performance.With the development of Industry 4.0 technologies,some researchers applied RFID in value stream analysis to achieve the function of DVSM.Ramadan et al.(2017) integrated RFID technology with VSM and proposed a DVSM implementation framework which can automatically collect data of materials,personnel,machines,and other production factors to achieve real-time monitoring of manufacturing performance.Similarly,Chen and Chen (2014)presented an on-line RFID-based facility performance monitoring (ORFPM) system.This system uses wireless monitoring via RFID to automatically generate a real-time VSM using computer programming.Ramadan et al.(2017) expanded the function of DVSM by proposing an innovative real-time manufacturing cost tracking system (RT-MCT) which integrates VSM and RFID.The system addresses how to track and visualize the cost of development of individual products.CPS can also be integrated with traditional VSM.Huang et al.(2019) proposed a multi-layer DVSM,which integrates traditional VSM with a multi-agent system based on CPS technology.It can automatically collect data near a station through agents and display the changes of key indicators related to material and information flow in the production process of multi-parts in real time,or near real time.In addition to RFID and CPS technologies,researchers have combined the industrial internet of things (IIoT) with VSM.Balaji et al.(2020) introduced an integrated model of IIoT and VSM.By establishing a sensor system to collect workshop data and monitor site status in real time,a digital site can be observed comprehensively and observation accuracy can be improved,which helps managers to carry out improvement activities quickly based on experience.Some researchers (Solding and Gullander,2009;Dotoli et al.,2011) also used discrete event simulation such as plant simulation and arena to build workshop models and automatically generate multi-part VSM using technologies such as AutoMod and MicroSoft Excel.The concept of VSM4.0 has also been proposed.Meudt et al.(2017) first introduced“VSM4.0”and extended the notation of process boxes.They focused mainly on detecting waste and loss in information flows.Hartmann et al.(2018) later gave the steps to design VSM4.0,which brought a new understanding of information in value streams.Table 1 summarizes the studies on the integration of VSM and industry 4.0 technologies.
3 Framework of automated VSM
Other instant causes have been identified based on statistical data analysis,such as work-in-process inventory or waiting time being excessive,but this is still insufficient to support decision-making on how to solve these problems.
“I think it is gone,” he said. But it was not gone; it was one of those bits of the looking-glass—that magic mirror, of which we have spoken—the ugly glass which made everything great and good appear small and ugly, while all that was wicked and bad became more visible, and every little fault could be plainly seen. Poor little Kay had also received a small grain in his heart, which very quickly turned to a lump of ice. He felt no more pain, but the glass was there still. “Why do you cry?” said he at last; “it makes you look ugly. There is nothing the matter with me now. Oh, see!” he cried suddenly, “that rose is worm-eaten, and this one is quite crooked15. After all they are ugly roses, just like the box in which they stand,” and then he kicked the boxes with his foot, and pulled off the two roses.
Smart workshop applies intelligent technologies to realize autonomous perception,analysis,and adaptation in manufacturing sites (Gao et al.,2016).One important feature of smart workshop is the comprehensive collection of production data related to machines,personnel,and materials.Machine data can be acquired via PLC or sensors,which help managers better understand the manufacturing on-site situation.Workers can be equipped with RFID or barcode tags to record work flow information with corresponding readers.This is also feasible for WIP inventory and material data acquisition.In addition,the status of machines,personnel,and materials is critical for automated reasoning in root cause analysis.
3.1 Data level
The data level is responsible for data storage and pre-processing,which supports VSM visualization and further analysis.Production data in a smart workshop is streamed to the database via a cable/wireless communication network,and integrated with other information systems,such as ERP,product data management (PDM),and SCM to provide supplier,process,and customer data according to the needs of VSM.Due to the residual issue of limited data interoperability among different information systems,there is a large amount of heterogeneous data in the database,which requires data cleaning,format conversion,and review for VSM.
3.2 Information level
The information level visualizes the preprocessed data based on VSM,displays the actual production situation,and reveals the instant cause of problems through basic statistics.Unlike the traditional VSM,the proposed VSM can be generated gradually along with the actual production progress.For example,when a part is being processed on the first machine,the associated VSM displays only its waiting time in the storage area,the WIP quantity before the machine,and the related machine data at that very moment.The subsequent processing status is not yet displayed.Personnel and material data can also be displayed.Statistical analysis will then be conducted to indicate production performance with visuals,such as actual progress,machine utilization,and output.To this point,data are considered to be converted into information,because they already carry practical meaning.When an incident happens,this information will be used for tracing and root cause analysis.
3.3 Knowledge level
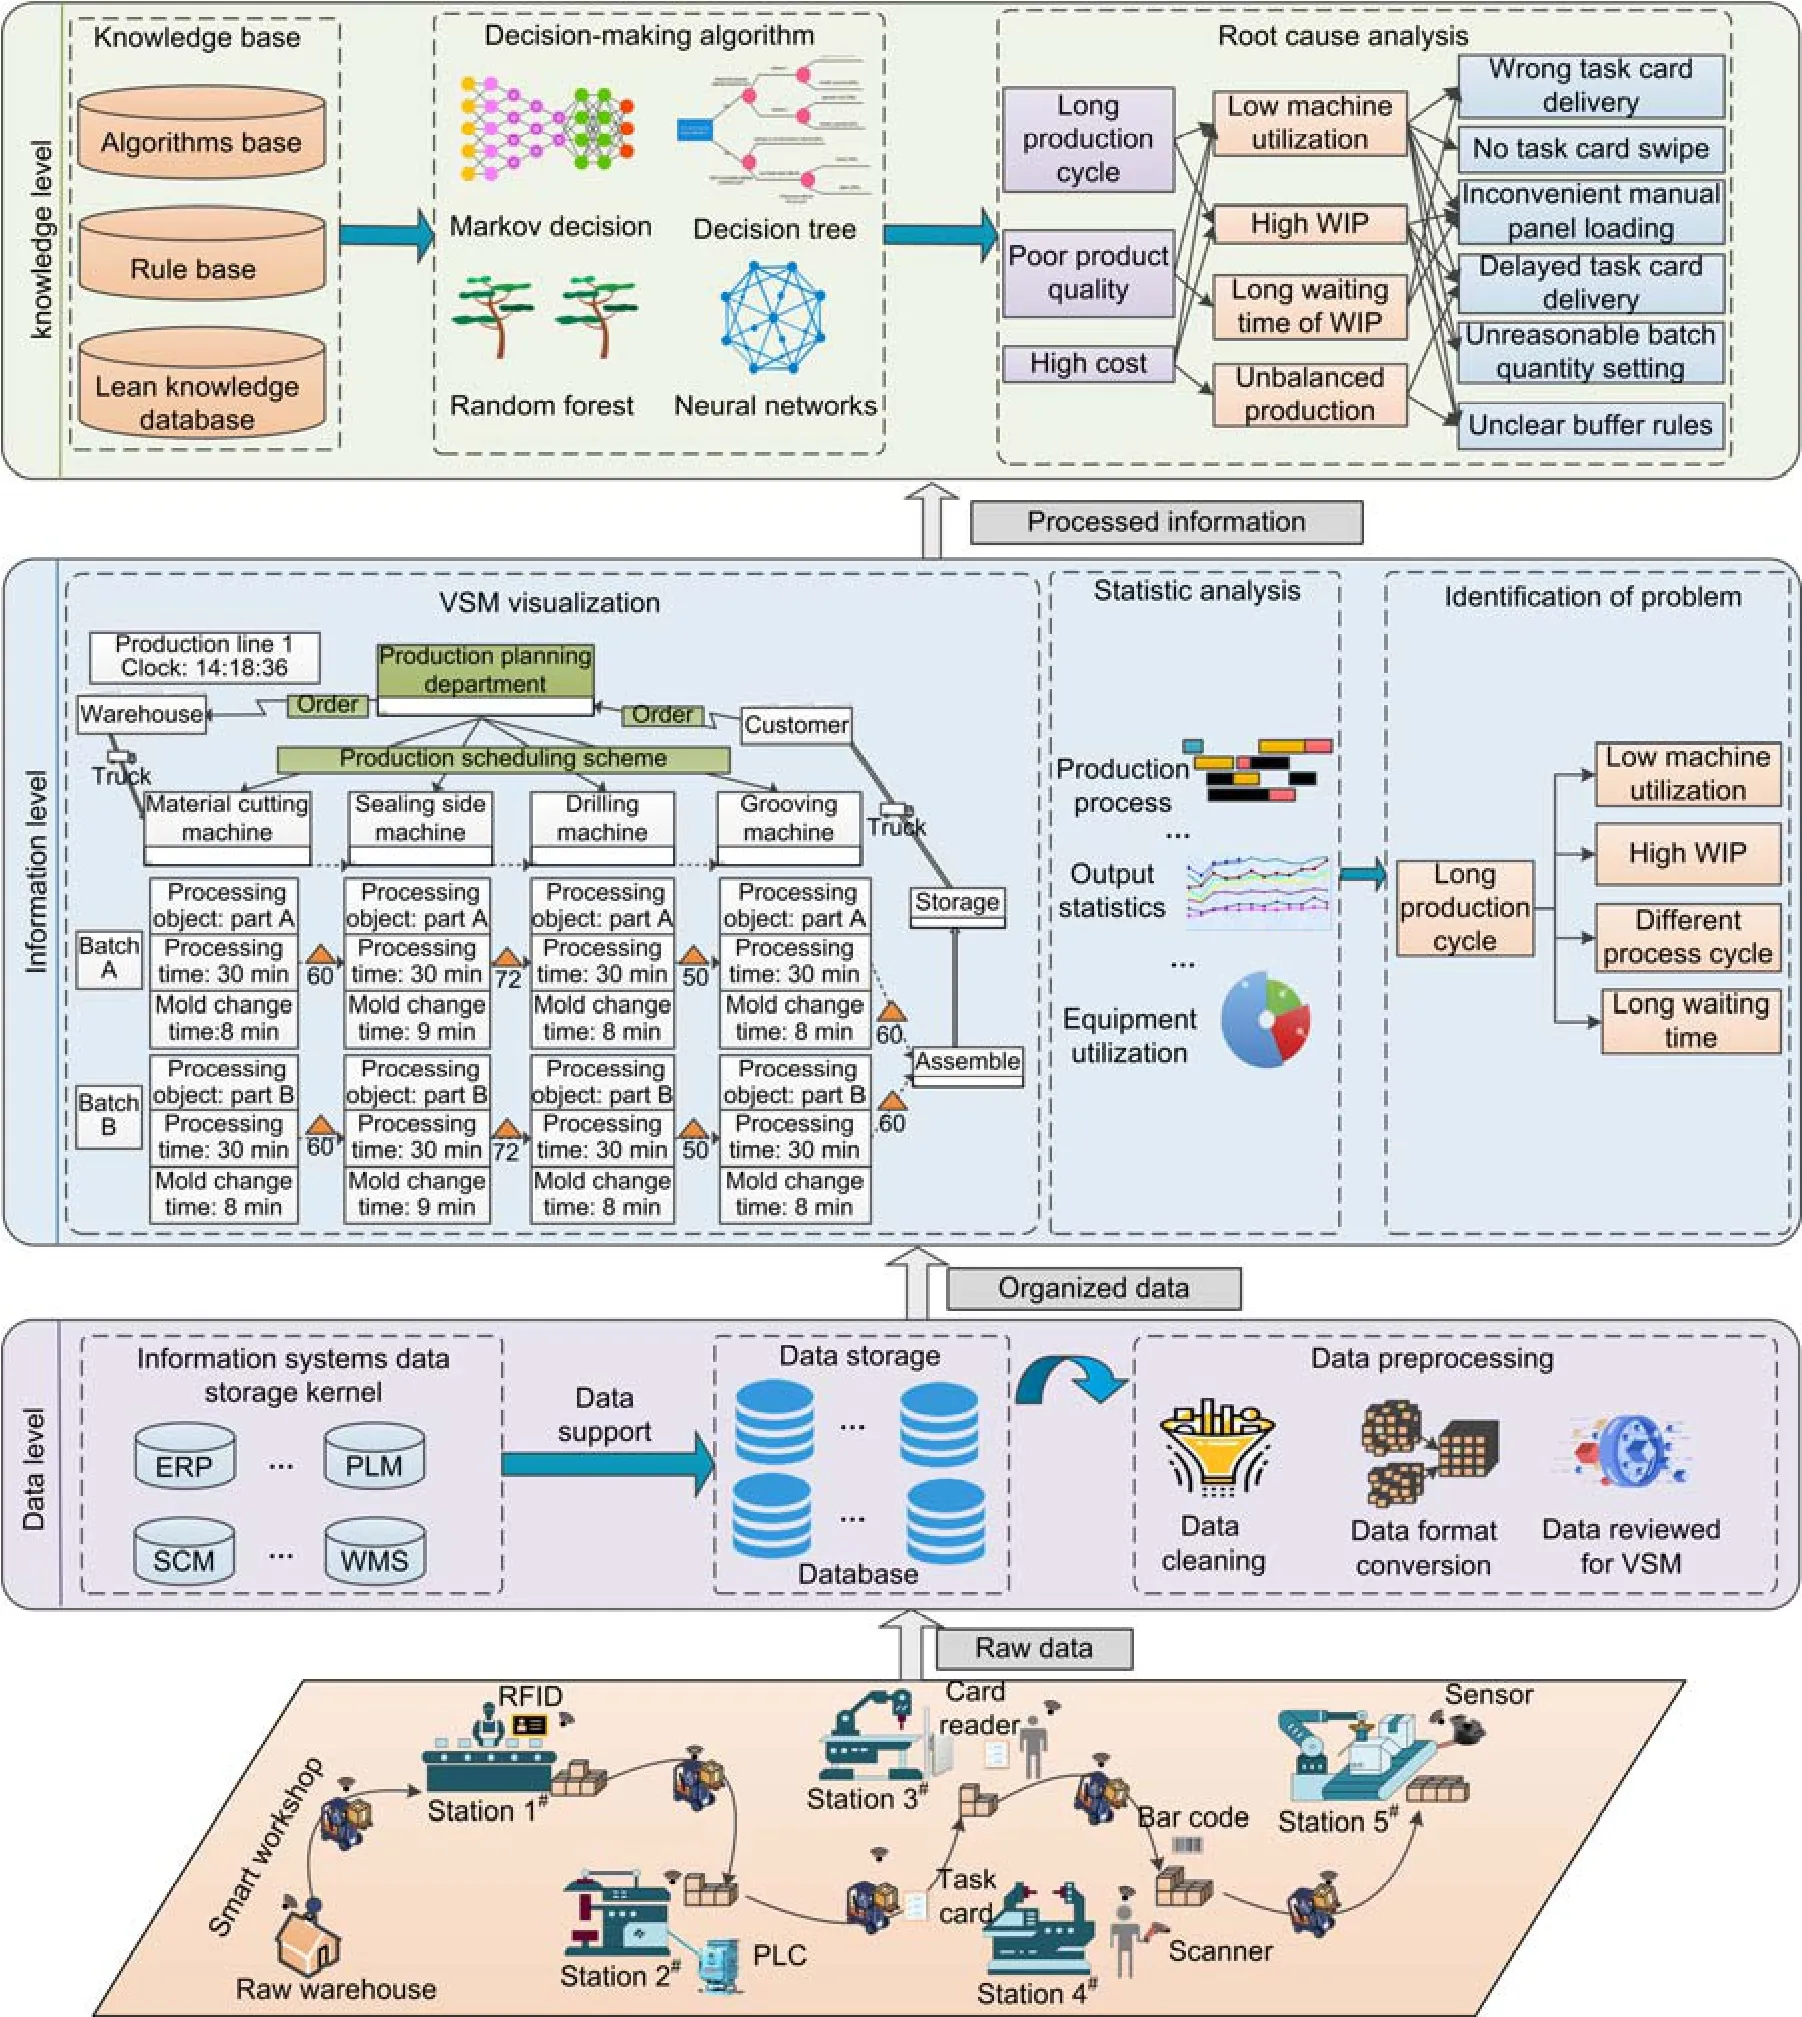
Fig.2 Proposed systematic framework of automated value stream mapping
The knowledge level is designed to support automated root cause analysis.The knowledge base includes an algorithm base,rule base,and lean knowledge base.An appropriate algorithm will be selected based on actual production know-how,and combined with predetermined rules to analyze the root cause of actual situation.To this point,information is considered to be processed into knowledge,because a manager can choose the most appropriate lean tool for improvement activity.Automated root cause analysis can significantly improve decisionmaking efficiency by reducing on-site investigation,which is labor-intensive and experience-dependent.
4 Implementation case
The proposed framework was implemented in a panel-type furniture workshop of a manufacturer in Hangzhou,China.The workshop produces various types of office furniture,such as office desks and tables.A schematic diagram of the workshop is shown in Fig.3.
The large trees which grew round it saw the plant and heard theremarks, but they said not a word either good or bad, which is thewisest plan for those who are ignorant.
The current production has been analyzed from three aspects:machines,personnel,and materials.Cutting machines,sealing side machines,drilling machines,and others are configured in four production lines based on furniture products.The materials are sent to the line inventory area using forklifts according to a predetermined delivery plan and transferred in batch within the workshop.Workers manually load the panel on a machine,process it when its task card and materials are ready,and unload after finishing.Previously,most production-related data in the workshop were recorded in paperwork and analyzed by workers,resulting in low utilization efficiency.The workshop has now implemented a preliminary data acquisition system,including RFID,barcode,readers/scanners,and external sensors.A manufacturing execution system was available to extract key information from the PLCs of machines.However,the data have not yet been fully used to assist decision-making.
4.1 Data level
To support root cause analysis and efficient decision-making,a data acquisition scheme was designed for this furniture workshop (Table 2).It shows the specific data types and collection methods according to VSM requirements.
2. Tumbled out of its ears: This version of the story was sanitized for a Victorian sensibility. In the original story by Charles Perrault, the donkey s feces are gold.Return to place in story.
Vingo sat there stunned10, looking at the oak tree. It was covered with yellow handkerchiefs. 20 of them, 30 of them, maybe hundreds, a tree that stood like a banner of welcome billowing in the wind. As the young people shouted, the old con rose and made his way to the front of the bus to go home.
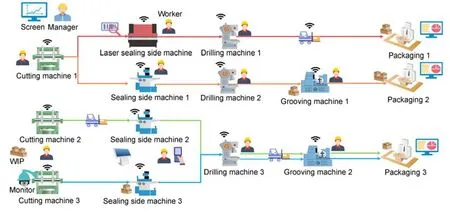
Fig.3 A schematic diagram of the panel-type furniture workshop case study
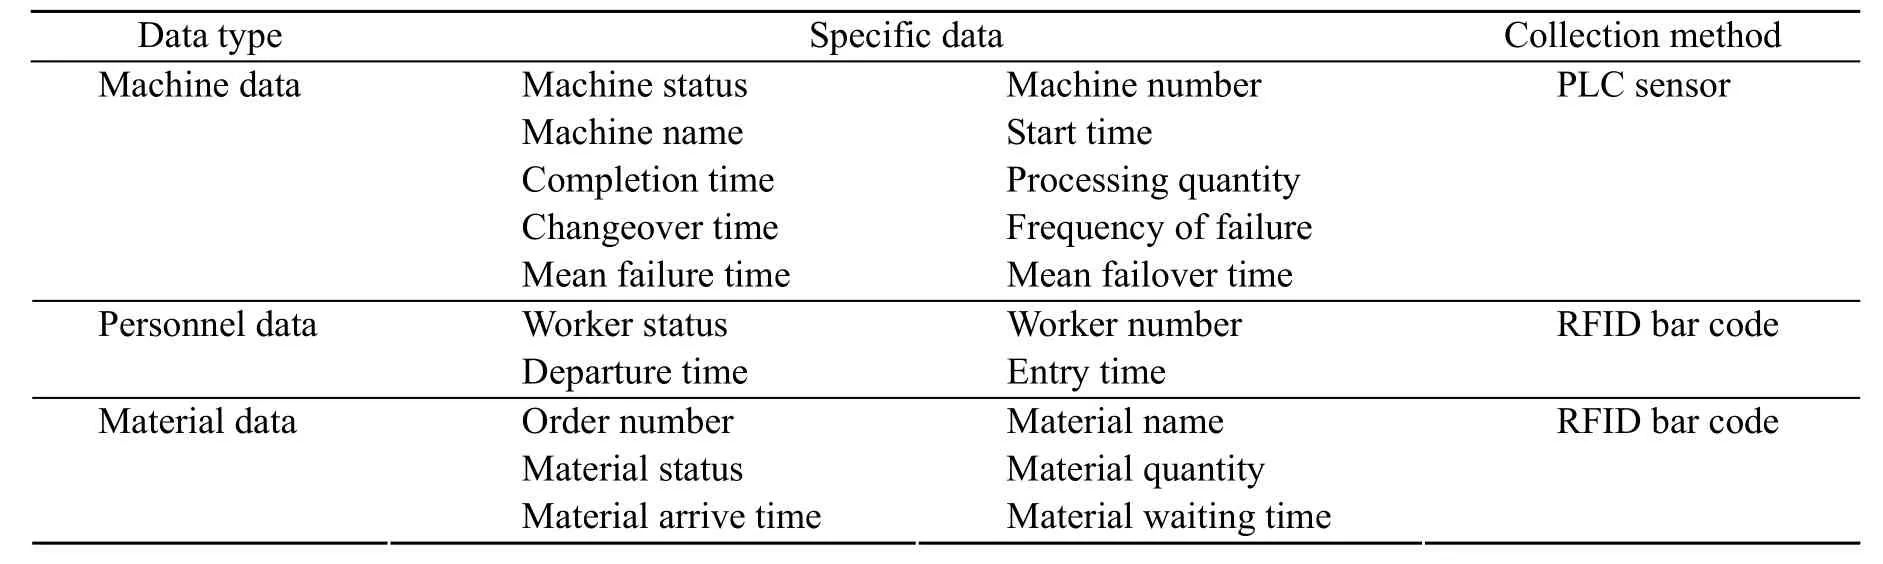
Table 2 Designed data acquisition scheme
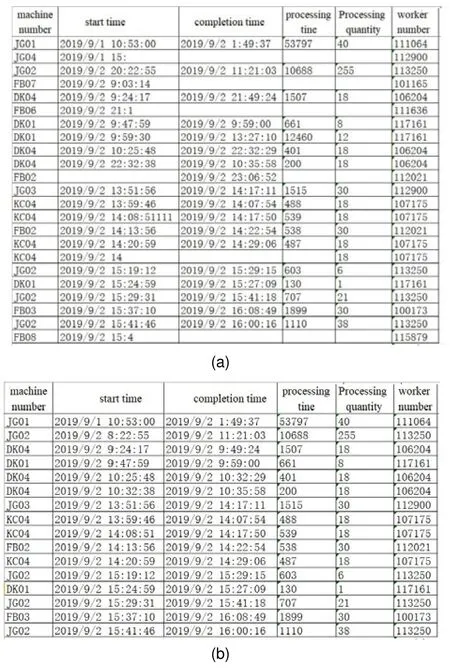
Fig.4 Data preprocessing process
4.2 Information level
Fig.5 depicts the automatically generated and visualized VSM.The data box of VSM is redesigned,including the material arrival time,departure time,task card arrival time,and swiped time,which can represent the status of the entire production site at a given time.For better readability,only the key information for developing the required VSM is illustrated in the data box.
In this workshop,materials and WIPs were handled by batch,which was therefore used as the tracking reference in VSM.Values to represent the status of machine,materials,personnel,and task card are shown in Table 3.These data support reasoning in root cause analysis.
VSM is generated gradually along with the production:for example,at time 14:18,the workshop was processing panels for a filing cabinet and a supervisor’s desk (Fig.6).The filing cabinet is composed of a top panel,a bottom panel,and side panels,labelled as Batches A,B,and C,respectively.The supervisor’s desk of table-board is composed of two panels,labelled Batches D and E.Batch A normally finishes processing on the grooving machine number 2.As the dash-line boxes in Fig.5 indicate,a worker comes to grooving machine number 1 at 13:30 to prepare for Batch B and discovers the machine is in failure.This leads to the data box displaying 0:00.The worker leaves the station and calls for maintenance service at 13:36.VSM also displays that Batches D and E are processed on the sealing side machine 1 and the cutting machine 2 at 14:18.
With the data streamed from the smart furniture production workshop,the root cause of the low machine utilization rate was automatically mined andpresented to the operator via a user interface (Fig.9)to assist a timely response.
After VSM visualization,data are further analyzed.Taking the utilization rate of a drilling machine as an example,Fig.7 (p.391) illustrates the accumulated processing time and idle time at different periods,and the corresponding utilization rates.This information instantly reveals potential loss or problems,and prepares managers for an improvement activity.
Our proposed framework follows the datainformation-knowledge hierarchy model,and indicates how data can be collected in a smart workshop,processed into information,and then interpreted into knowledge (Fig.2).It explains the automated data flow from smart workshop to knowledge level for analyzing root causes based on VSM.
4.3 Knowledge level
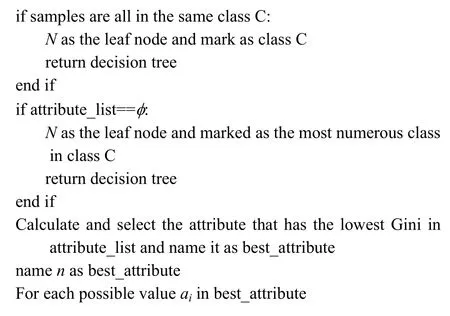
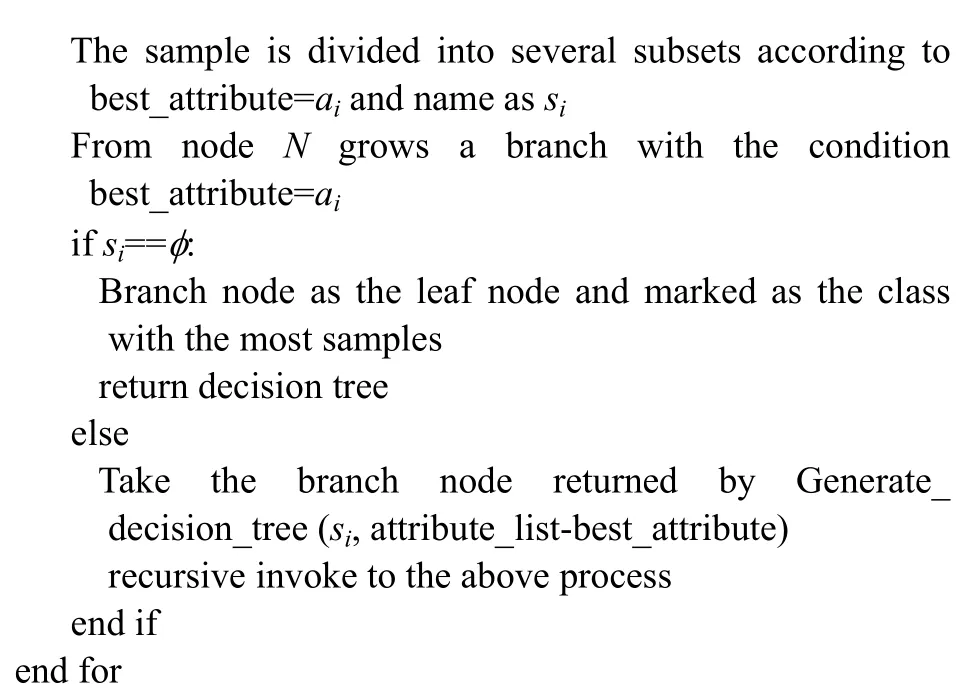
The information is then processed in the knowledge layer,utilizing the algorithm,rule,and lean knowledge bases.In this case,a decision tree algorithm was used to investigate the root cause of a low machine utilization rate.The procedure used is outlined as follows.First,the existing root causes for the low utilization rate of the drilling machine that relate to the actual status of production were aggregated in advance.In Table 4 (p.391),A=1 represents that the value of processing end time of material typeNminus second processing started time of material typeNis greater than the reasonable time interval.B=1 represents that the value of processing end time of material typeN−1 minus arrival time of material typeNis greater than the reasonable time interval.C=1 represents that the value of processing end time of material typeN−1 minus swiping time of task card typeNis greater than the reasonable time interval.D=1 represents that the mode changing time is greater than the reasonable time interval.E=1 represents that the value of processing started time of material typeNminus swiping time of task card typeNis greater than the reasonable time interval.Second,the corresponding decision tree was generated based on a classification and regression tree (CART) algorithm.The pseudocode of the algorithm is given in the Appendix A.
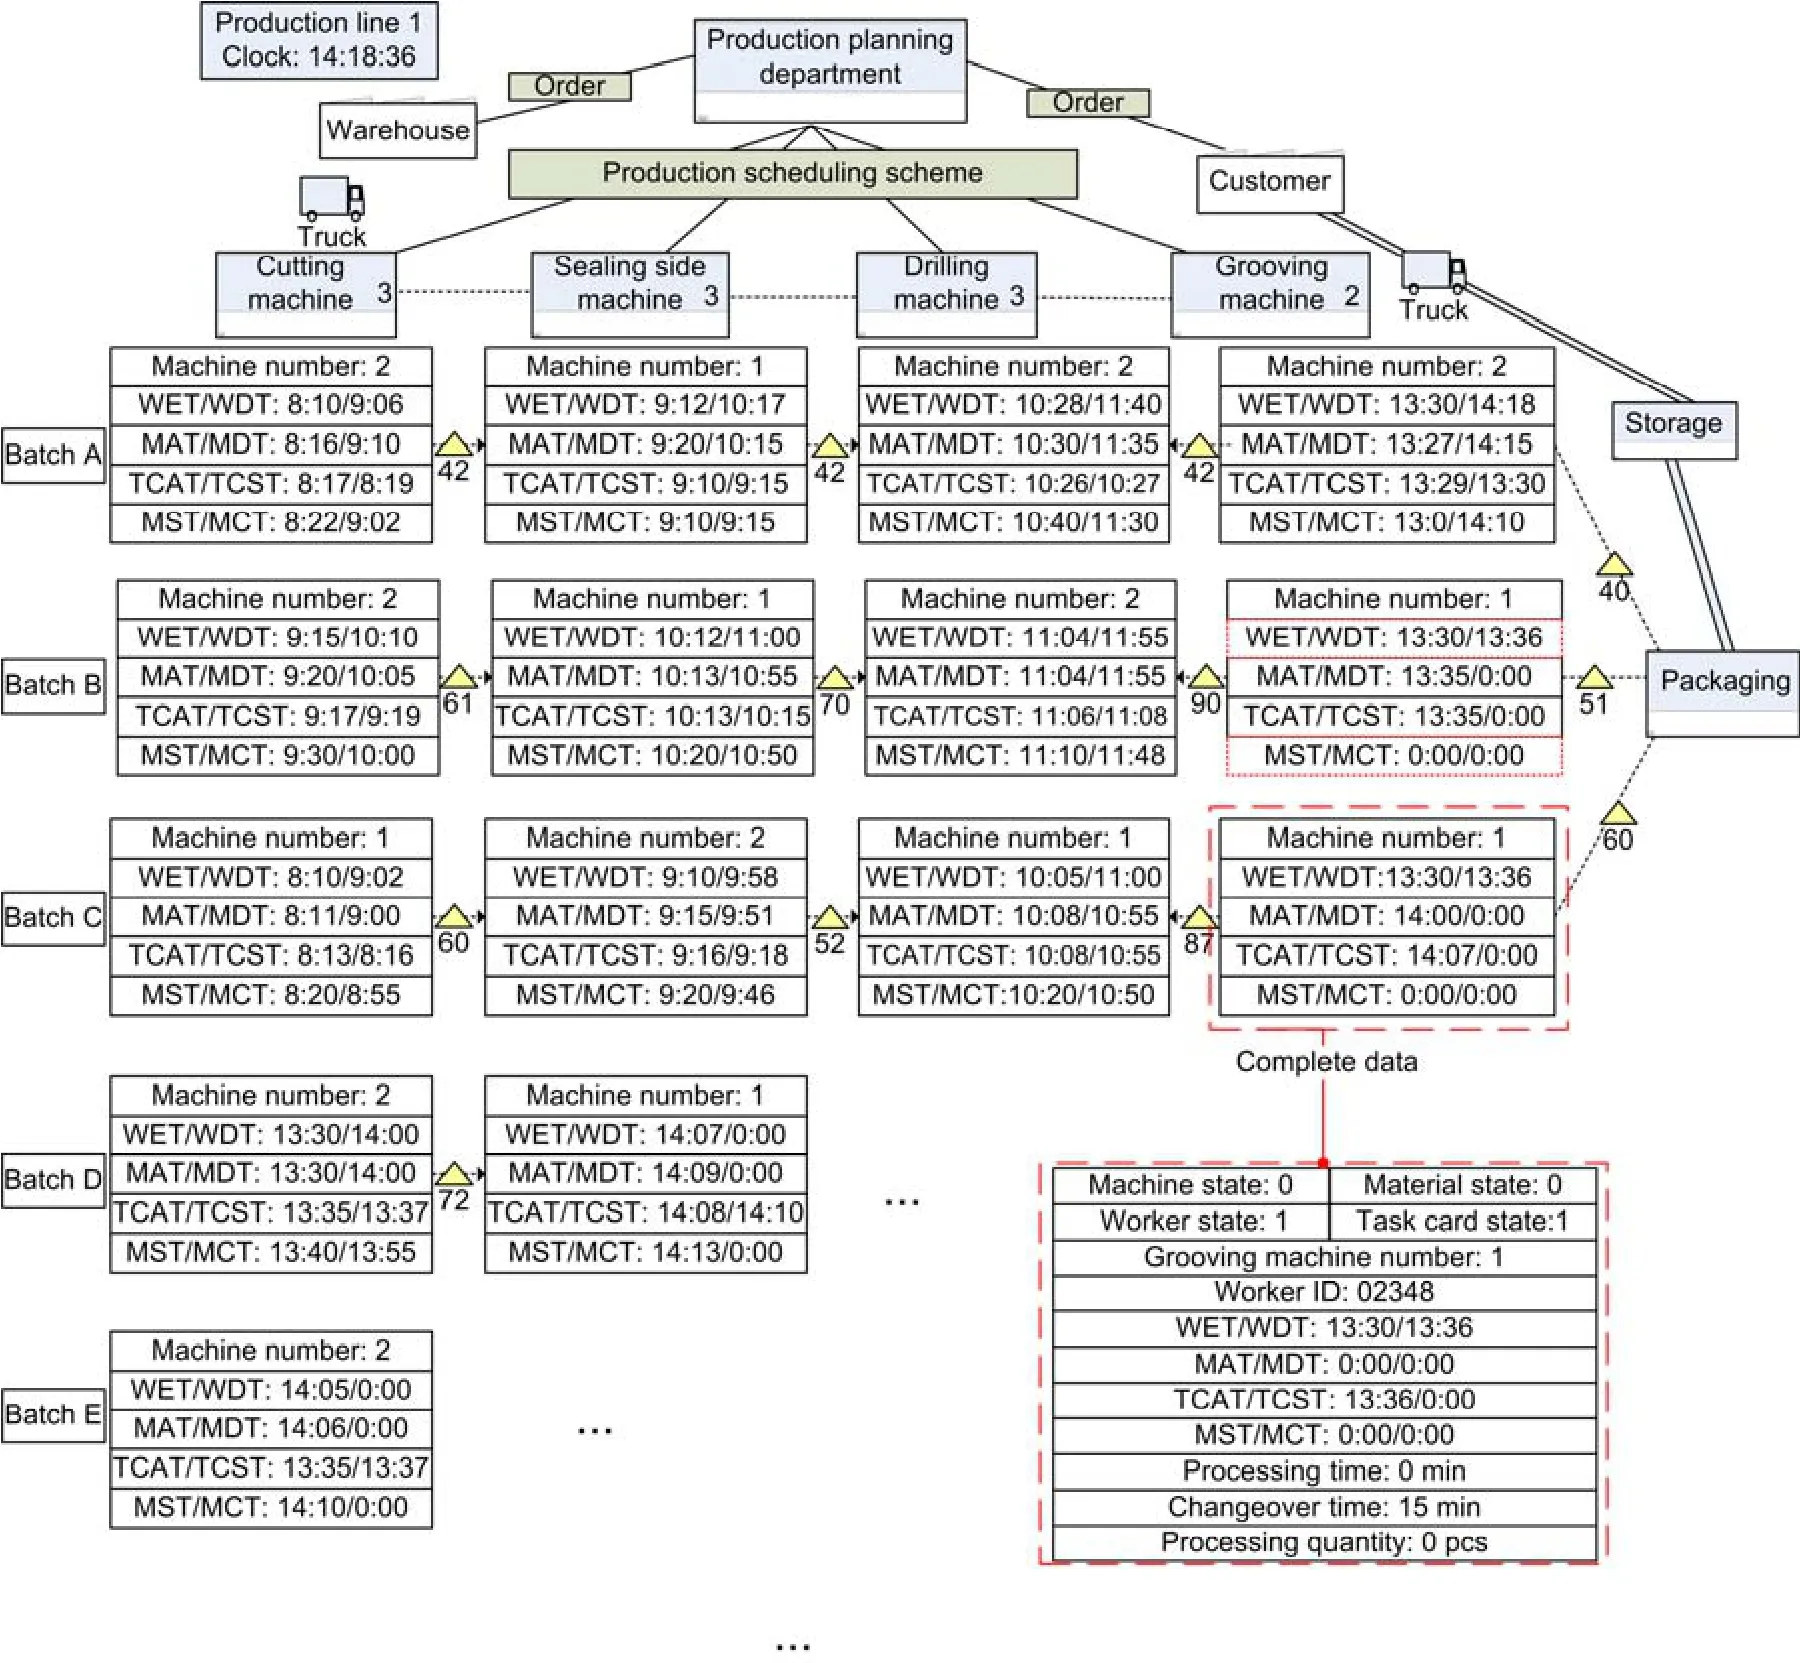
Fig.5 Developed VSM
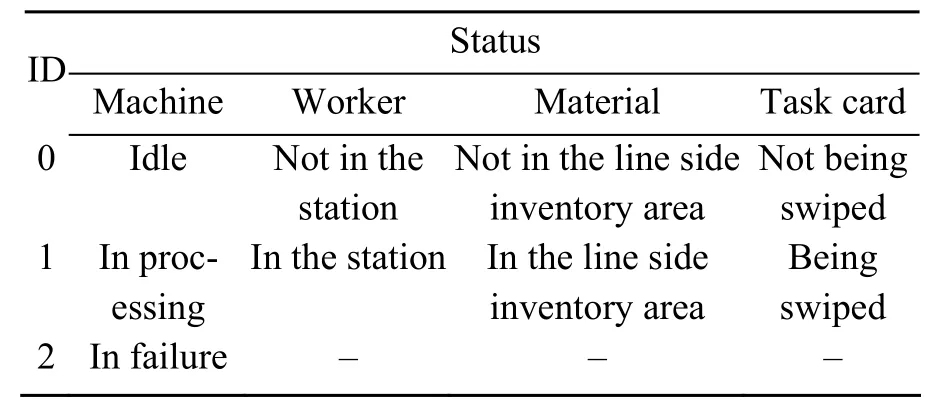
Table 3 Values for different statuses
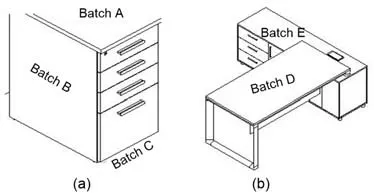
Fig.6 Processing product
The generated decision tree is illustrated in Fig.8a.For example,when the status of materials,workers,and task cards shows (1,1,1) respectively,the most-likely root cause ID is 7.Besides,a new issue could be discovered and its root cause will be renewed.For example,when a new status (0,1,1,0,1,0,0,1) pops,the algorithm will report an error.After its root cause is identified,a new branch will be added dynamically to the decision tree (Fig.8b).
18. Looked back at the house: Hansel is looking back at the house so he can place the pebbles along the path. However, looking back is an important concept in many stories. One of the most famous stories is of Lot s wife who is turned to salt when she turns and looks back at the city her family is fleeing, an act she has been forbidden to do. Consequently she is turned into a pillar of salt.Return to place in story.
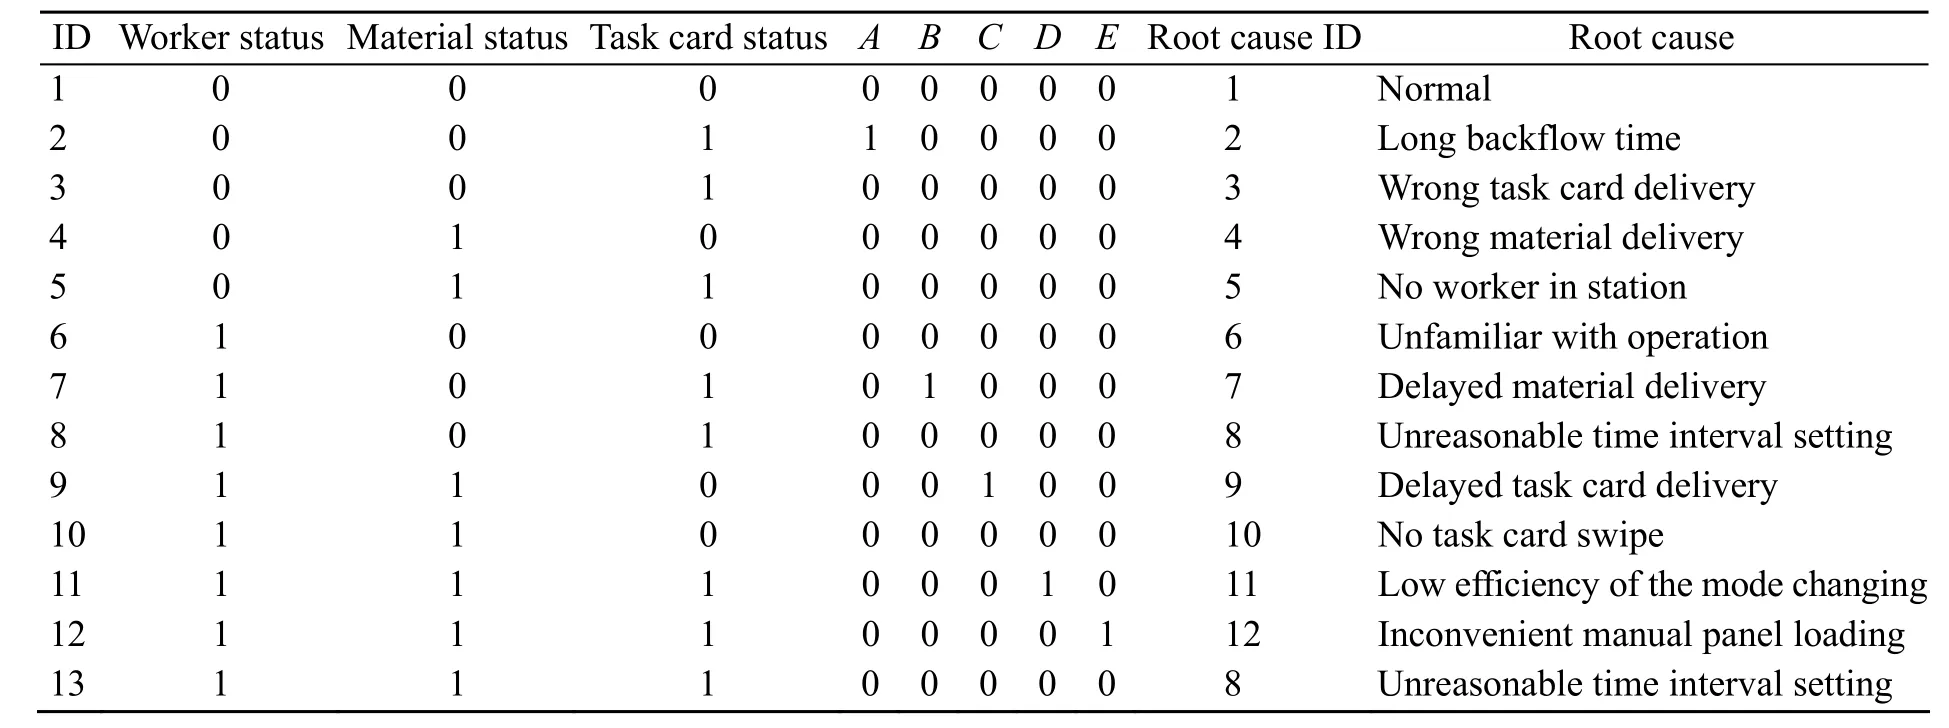
Table 4 Root causes in relation to the furniture production status
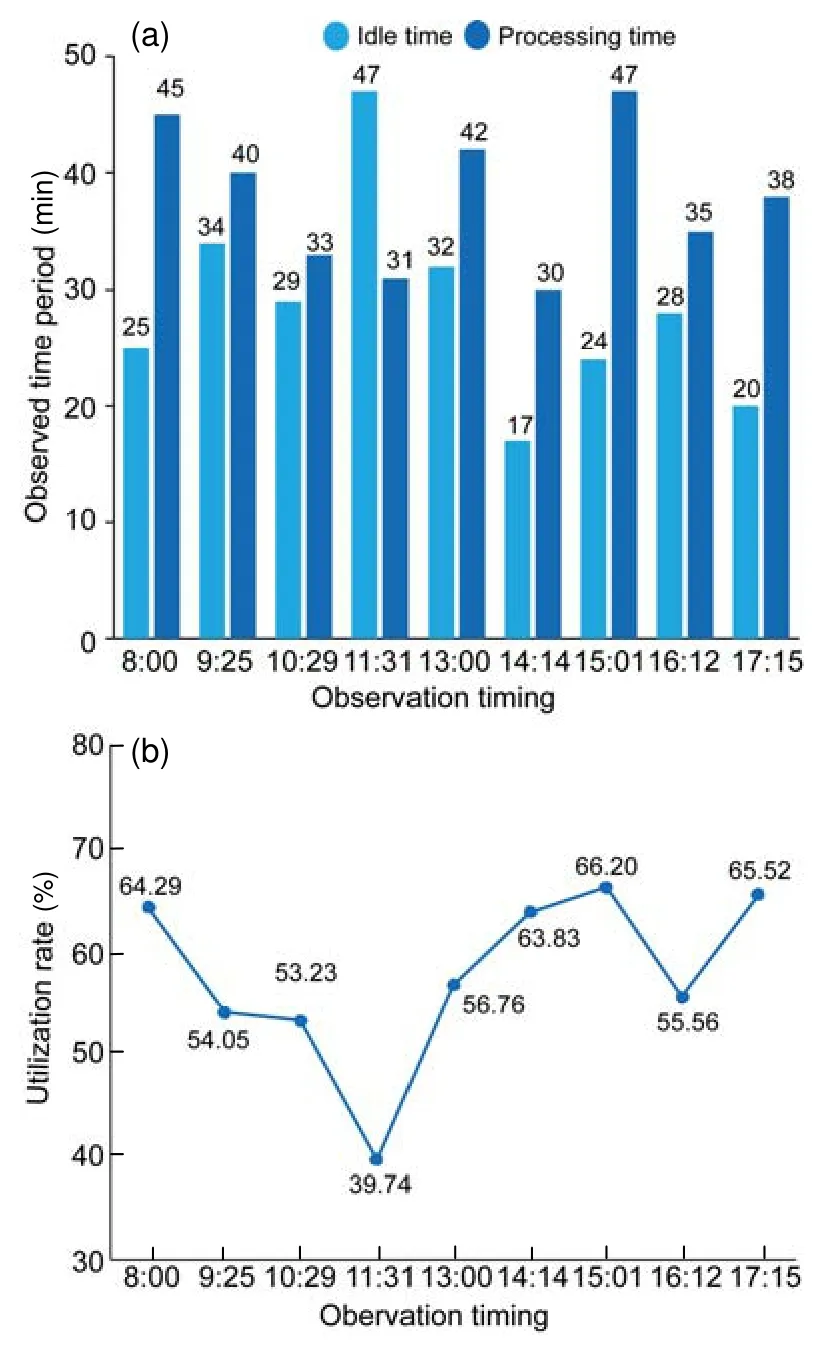
Fig.7 Drilling machine utilization statistics
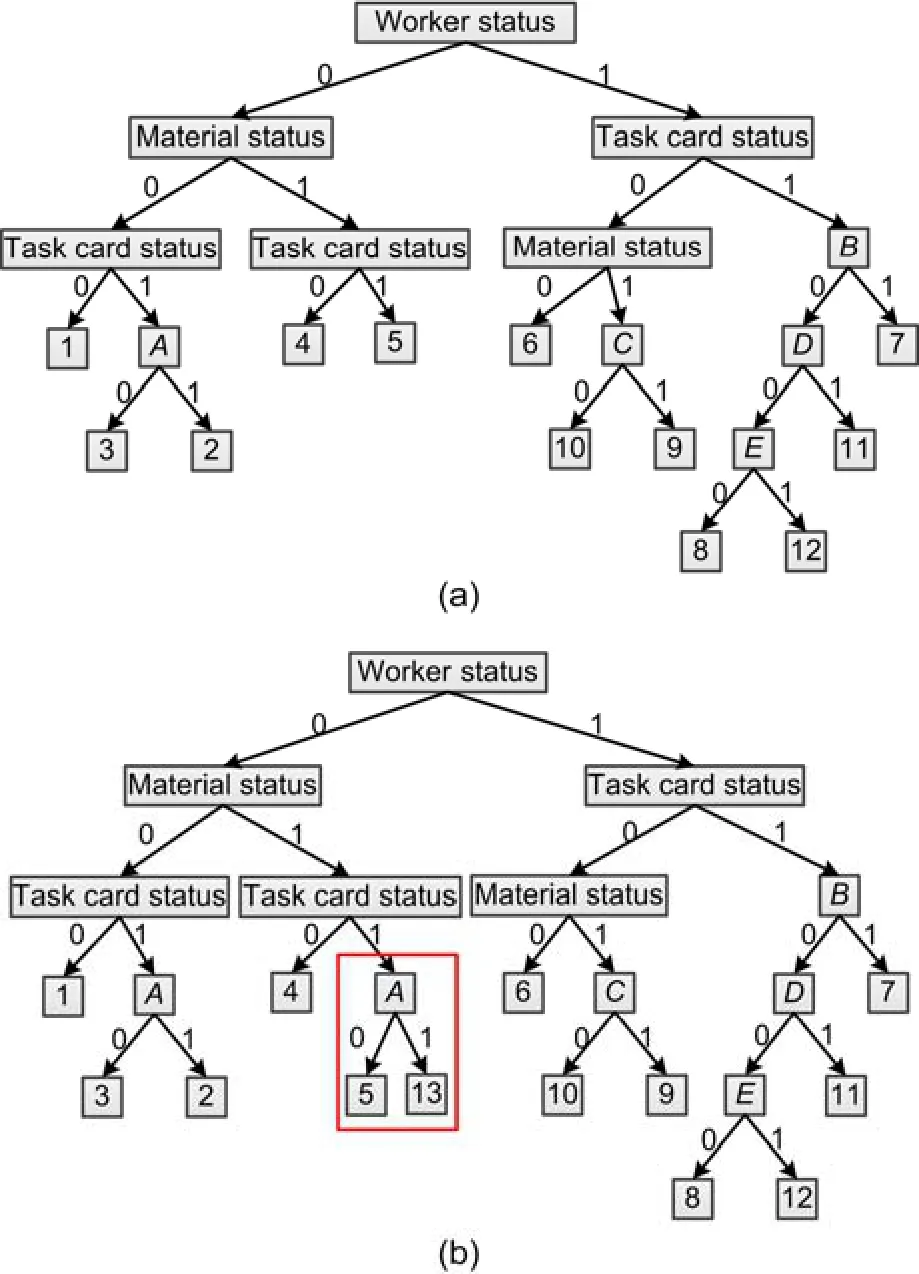
Fig.8 An example of decision tree generation and update
The identified root cause of the low machine utilization rate was inefficient material loading,which was fed back to the production department to design an automatic fixture.Two fixtures were fabricated the next day and placed in the loading bay of the drilling machine.From the third batch onwards,the average loading time saved was 12 s.In this way,the issue was solved within 2 d,which was considered efficient compared to the 7-d production cycle.The designed fixture is shown in Fig.10.
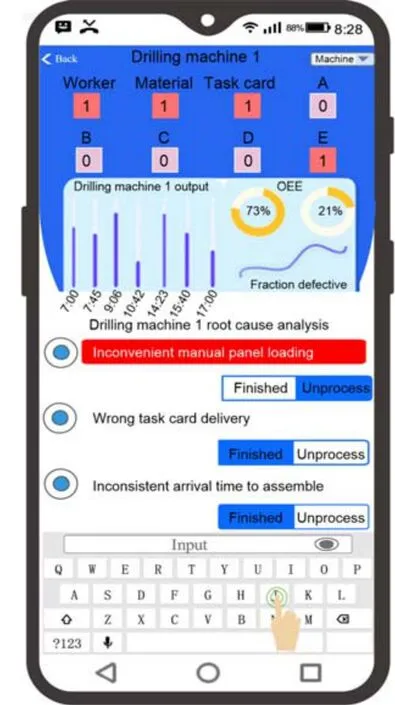
Fig.9 A prototype system with user interface
Fig.10 Automatic fixture
5 Conclusions
Once I was reading a book, and I noticed Mamun come to their roof and he looked at me, and smiled. OH MY GOD! I don t know what happened to me. That sweet smile just took me away. I smiled back at him, for the first time. I could never forget that moment. We used to smile at each other whenever we saw each other, but never had a chat. I was sure that he liked me a lot, because, anytime he would see me on the roof from his balcony, he came up to the roof right away. I fell in love with him very deeply. I was surprised that I did. The feelings I had was so beautiful and made me so happy.
Over the decades moviegoers have heard the straight version of “Lilli” in dozens of feature films and documentaries. And she is still heard today whenever old soldiers gather to sing of loneliness and loves gone by.
Thesharp-tongued cavalier who had caused the flute to be played, andwho was the child of his parents, flew headlong into the fowl-house,but not he alone
This paper makes several contributions.Firstly,the framework proves that it is feasible to incorporate Industry 4.0 technologies to improve the efficiency of traditional VSM.Other lean production tools can follow this framework for reliable and efficient decision-making.Secondly,it provides a roadmap to help enterprises integrate Industry 4.0 technologies and lean production tools to achieve a higher level of manufacturing performance and competitiveness.Thirdly,it shows that traditional VSM can make full use of production data to cater for multi-varieties and small-batch production,with timely on-site waste identification and automated root cause analysis.There are some limitations:the process from lean production tools to solution still requires operator intervention and is not yet automated.The lean production tools recommended for Industrial 4.0 technologies need to be further explored.In future work,the framework will be applied in smart workshops to verify its effectiveness in different production situations.
Contributors
Hao-nan WANG:investigation;formal analysis;methodology;writing-original draft;visualization;validation.Qi-qi HE:methodology;data curation;investigation;validation.Zheng ZHANG:methodology;resources;investigation.Tao PENG:conceptualization;writing-review and editing;supervision.Ren-zhong TANG:project administration;resources;funding acquisition;supervision.
Conflict of interest
Hao-nan WANG,Qi-qi HE,Zheng ZHANG,Tao PENG,and Ren-zhong TANG declare that they have no conflict of interest.
And I knew they had each made something for me: bookmarks carefully cut, colored, and sometimes pasted together; cards and special drawings; liquid embroidery8() doilies, hand-fringed, of course
Appendix A:pseudocode for the CART algorithm
 Journal of Zhejiang University-Science A(Applied Physics & Engineering)2021年5期
- Journal of Zhejiang University-Science A(Applied Physics & Engineering)的其它文章
- Tunable patterning of microscale particles using a surface acoustic wave device with slanted-finger interdigital transducers*
- Influences of fiber length and water film thickness on fresh properties of basalt fiber-reinforced mortar*
- Multi-geomagnetic-component assisted localization algorithm for hypersonic vehicles*
- Analytical solution for upheaval buckling of shallow buried pipelines in inclined cohesionless soil*
- Optimization of smoke exhaust efficiency under a lateral central exhaust ventilation mode in an extra-wide immersed tunnel*