
Tunable patterning of microscale particles using a surface acoustic wave device with slanted-finger interdigital transducers*
2021-05-21 10:50YanchengWANGChengyaoXUDeqingMEI1JiaweiLIU
Yan-cheng WANG,Cheng-yao XU,De-qing MEI1,,Jia-wei LIU
1State Key Laboratory of Fluid Power and Mechatronic Systems,Zhejiang University,Hangzhou 310027,China
2Key Laboratory of Advanced Manufacturing Technology of Zhejiang Province,Zhejiang University,Hangzhou 310027,China
3School of Mechanical Engineering,Zhejiang University,Hangzhou 310027,China
Abstract:Polymer-based materials with patterned functional particles have been used to develop smart devices with multiple functionalities.This paper presents a novel method to pattern microscale particles into biocompatible polyethylene glycol diacrylate (PEGDA) fluid through a designed surface acoustic wave (SAW) device with slanted-finger interdigital transducers(SFITs).By applying signals of different frequencies,the SFITs can excite SAWs with various wavelengths to pattern the microscale particles.The structural design and working principle of the SAW device with SFITs are firstly presented.To investigate the generation of standing SAWs and pressure field distributions of the SAW device with SFITs,a numerical model was developed.Simulation results showed that different strip-shape patterned pressure fields can be generated,and the period and width of adjacent strips can be adjusted by changing the frequencies of the excitation signals.Experiments were performed to verify that the microscale particles in the PEGDA solution can be successfully patterned into strip-shape patterns with various positions,periods,and widths.The results obtained in this study demonstrate that the developed method of using an SAW device with SFITs can be used for tunable patterning of microscale particles in solutions,and shows great potential for biomedical and microfluidic applications.
Key words:Tunable patterning;Surface acoustic wave (SAW);Acoustic pressure field;Polymer-based composite;Slanted-finger interdigital transducers (SFITs)
1 Introduction
Polymer-based multifunctional composites have been widely used for the development of flexible and wearable electronic skins (Wang S et al.,2019),soft robotics (Ze et al.,2020),and health monitoring devices (Zhang et al.,2019).Microscale or nanoscale materials,such as dots,wires,rods,fibers,or particles,are usually mixed into the polymer solution for the preparation of multifunctional materials.For example,transparent pressure sensing film with a solution-processable cellulose/nanowire nanohybrid network featuring ultrahigh sensitivity and fast response time can be used to image a pressure distribution (Lee et al.,2020).A 3D-printed microscale fish with localized iron oxide and platinum nanoparticles exhibits chemically powered and magnetically guided propulsion,and can provide a platform for engineering advanced micro-swimmers for diverse biomedical applications (Zhu et al.,2015).Polymer-based composites with metal particle patterning can also be used for the development of heat dissipation networks (Lu et al.,2019) and conductive 3D microstructures with embedded electronic components (Yunus et al.,2017).
Directly assembling or patterning of microscale and nanoscale particles or fibers into a polymer matrix is an effective way to fabricate multifunctional polymeric composites.Several methods have been proposed,such as electrophoretic assembly (Hermanson et al.,2001) and capillary assembly (Aubry et al.,2008).With an applied electrical field,controllable assembly of various types of nanomaterials can be achieved (Hermanson et al.,2001;Yilmaz et al.,2017).The 3D printing techniques allow user-defined structural design,and thus have been widely used to fabricate functional polymer-based composites.For example,a projection-based stereolithography (SLA)process with a rotational electrical field has been developed to fabricate bioinspired composites (Yang et al.,2017).A wide range of materials including fibers and spherical and non-spherical particles can be printed.Using a magnetic-field-assisted 3D printing process to control the position and orientation of fibers has also been studied (Martin et al.,2015).However,the use of both electrical and magneticassisted particle manipulation and patterning is limited by the need for the particles to respond naturally to the applied electrical or magnetic field.Otherwise,the particles need to be coated with a thin layer of electrical or magnetic material,which requires additional pretreatment processes.Recently,acousticassisted particle patterning has been proposed to overcome this limitation of electrical-and magneticassisted patterning methods.A piezoceramic ultrasonic transducer can generate an acoustic pressure field for patterning of glass fibers (Llewellyn-Jones et al.,2016) and metal particles (Lu et al.,2018).Standing surface acoustic waves (SAWs) generated by a piezoelectric SAW device have also been used to pattern cells (Collins et al.,2015;Devendran et al.,2016).These methods have fewer restrictions on the shape and/or physical properties of the materials,and thus have potential for wider application.
Polymer-based composites with complicated patterning of particles are usually required to achieve superior functions,such as sensing of external stimuli(Cho et al.,2017).Using an acoustic-assisted method to pattern microscale particles accurately into composite material still remains a challenge,especially for complex particle patterning.Once an SAW device is fabricated,the patterns of the particle are determined by the structural design of the interdigital transducers (IDTs),which limits the application of standing SAWs to achieve complicated particle patterning.To overcome these shortcomings,a waveguide has been used for the SAW device to locally guide SAWs into the fluidic environment,achieving localized particle patterning (Bian et al.,2017) and microstructure fabrication (Wang YC et al.,2019).Vibration-driven assembly with different modes can also be used to disperse particles into complicated patterns,but the patterns generally depend on the acoustic pressure field induced by the unprogrammable vibration modes.Thus,the patterning regions of the particles are usually not controllable (Chen et al.,2014;Shabaniverki et al.,2018).Slanted-finger interdigital transducers (SFITs) have been designed for the SAW device (Ding et al.,2012).They can generate standing SAWs of different wavelengths to manipulate microbubbles (Zhou et al.,2016) and arrange cells (Naseer et al.,2017).In this study,we develop a method using the SAW device with SFITs to pattern the microscale particles in a biocompatible fluidic solution.The tunable patterning properties are also investigated by both numerical modeling and experimental tests.
In this paper,we describe a novel method for tunable patterning of microscale particles into polyethylene glycol diacrylate (PEGDA) solution by using a designed SAW device with SFITs.The structural design of the SAW device and its working principle for tunable patterning of microscale particles in fluidic solution are first described.Then,we describe numerical modeling of the SAW device with SFITs used to study the generation of standing SAWs and an acoustic pressure field when using different input frequencies.We then discuss the fabrication of the SAW device and the experimental setup of the system for tunable patterning of microscale particles in PEGDA solution.Finally,results and discussion are presented.
2 Working principle and design of SAW device
2.1 Working principle
A schematic view of the SAW device with SFITs for microscale particle patterning is shown in Fig.1a.The SAW device has one pair of SFITs deposited on a 128° Y-cut lithium niobate (LiNbO3) piezoelectric wafer connected to a signal generator.In the central region of the SAW device,a rectangular-shaped polydimethylsiloxane (PDMS) chamber is covered on the top surface.The mixture of the PEGDA solution with microscale particles is blended homogeneously and then injected into the chamber.The SFITs can be regarded as the combination of many conventional IDTs with different electrode widths and gap distances.Various particle patterns with different periods and widths can be achieved when using different excitation signals.The operating frequency (f) range of the signals is determined by the period of the electrodes (λe),calculated asf=cLN/λe,wherecLNis the sound speed of 128° Y-cut LiNbO3.
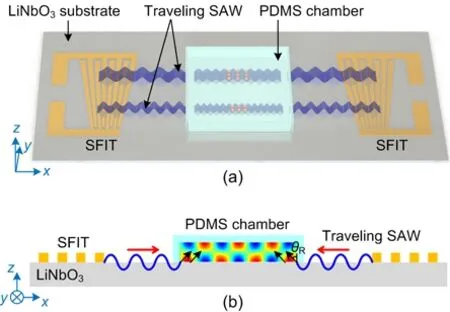
Fig.1 Schematic view of the SAW device with SFITs (a)and working principle for the SAW-assisted particle patterning method (b) (θR is the Rayleigh angle)
Fig.1b shows the working principle of the tunable SAW-assisted particle patterning method.When a sinusoidal signal is applied to the pair of SFITs,two series of identical SAWs with the same wavelength can be generated on the piezoelectric wafer.The wavelength of the SAWs depends on the frequency of the applied signal.The SAWs propagate along the LiNbO3substrate and interact with each other,forming a standing SAW in the central region of the device.The standing SAW transmits into PEGDA solutions at the Rayleigh angle (θR) and induces a localized acoustic pressure field in the chamber with alternative pressure nodes and antinodes.The pressure value drops to zero at the pressure nodes,and reaches a maximum at the pressure antinodes.The randomly dispersed particles in the PEGDA solution in the localized standing SAW-induced acoustic pressure field will be subjected to an acoustic radiation force and a drag force,and move to the pressure node or antinode positions (Fig.1a).Specifically,the primary acoustic radiation force (Fr) and the drag force (Fdrag) applied on microscale particles can be expressed as (Shi et al.,2009):
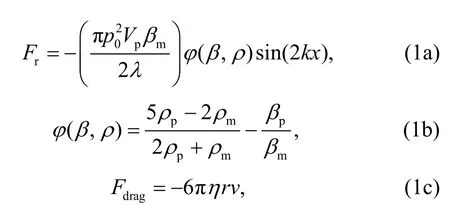
wherep0is the pressure amplitude;λis the acoustic wavelength;kis the wavenumber;Vp,ρp,βp,andrare the volume,density,compressibility,and radius of the particle,respectively;ρm,βm,andηare the density,compressibility,and viscosity of the medium,respectively;vis the relative velocity of the particles and streaming field;φ(β,ρ) is the acoustic contrast factor,which determines the direction of the acoustic radiation force.For the Fe3O4particles used in this study,φ(β,ρ) is positive and the acoustic radiation force points to the acoustic pressure nodes.
Typically,the acoustic streaming induced by the second-order terms is much smaller and usually neglected compared to linear wave propagation (Bruus,2012).This means that the relative velocityvin Eq.(1c) can be substituted by the particle velocityvp,and finally the particles will be pushed to the pressure nodes by the acoustic radiation force.However,the acoustic streaming may have some influence on particle motion near the wall of the chamber (Devendran et al.,2016).This will be studied in our future work to achieve more accurate modeling.
The spatial period of the particle patterning can be regarded as the distance between adjacent nodes or antinodes,whose value is about half the wavelength of the standing SAWs.Then,when we apply a sinusoidal signal with another frequency to the SFITs,it can also generate an acoustic pressure field in PEGDA fluid and in turn pattern the particles with a changed spatial period.Thus,the microscale particles can be patterned with a tunable period for future applications by applying sinusoidal signals with different frequencies.
2.2 Design of the SAW device with SFITs
The structural design of the SFITs is crucial for using the SAW device for particle patterning.The SFITs are designed along thex-axis of the 128° Y-cut LiNbO3substrate due to its relatively low parasitic signal level and low propagation loss.Each SFIT has 25 pairs of electrodes (Fig.2).The width of each electrode varies linearly from 40 to 60 μm,so the total width of the SFIT ranges from 4.0 to 6.0 mm,and the aperture length of the SFIT is 10.0 mm.Based on the designed SFITs,the corresponding working frequency ranges from about 16.2 to 24.3 MHz.The wavelength of the generated standing SAWs varies from 160 to 240 μm,resulting in patterned particles with theoretical spatial periods ranging from 80 to 120 μm.The distance between two SFITs varies from about 13 to 15 mm.Therefore,the working region of the SAW device is located in the center,with an area of about 10.0 mm×10.0 mm due to the intensity imbalance of the generated standing SAWs near the electrodes.A PDMS chamber with dimensions of 10 mm×10 mm×0.05 mm is placed in the working region.The mixed solution is injected into the chamber for particle patterning.
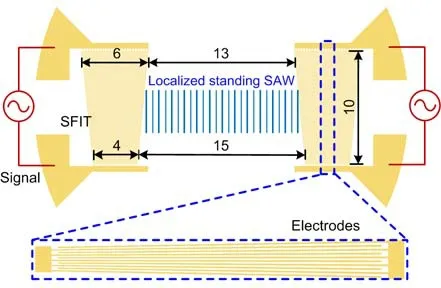
Fig.2 Structural design of the SAW device with SFITs(unit:mm)
3 Numerical modeling
3.1 Geometric modeling and governing equations
To predict the performance of the SAW device when applying excitation signals of different frequencies,finite element modeling (FEM) was conducted.Two opposite SFITs along thexdirection were excited by harmonic signals during experiments,and generated two travelling SAWs which propagated along the LiNbO3substrate.When the two SAWs encountered each other,a standing SAW would be formed.Then,the SAWs transmitted into PEGDA solution at the Rayleigh angle,reflected on the wall of the chamber,and induced an acoustic pressure field.Multiphysics 3D modeling was performed to consider the asymmetric structure of the SFITs and the complicated multiphysics process.Since the structure of the SAW device has two SFITs arranged symmetrically along thexdirection,only one of the SFITs was modelled,to simplify the numerical modeling.Fig.3a shows the established numerical model of the SAW device with SFITs,which was performed using COMSOL Multiphysics V5.5 software.
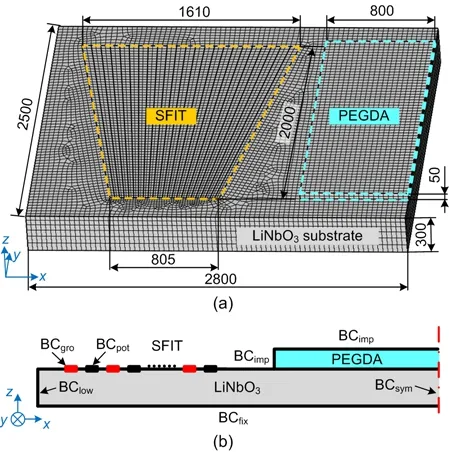
Fig.3 3D FEM model of the SAW device with SFITs (a)(unit:μm) and boundary conditions (b) (description of the boundary conditions refers to Section 3.2)
The developed numerical model consisted mainly of three domains:a LiNbO3substrate,electrodes of the SFITs,and a thin layer of PEGDA fluid.Due to the surface propagation characteristics of SAWs,the thickness of the LiNbO3substrate was reduced to 300 μm for simplification.The LiNbO3substrate was 2800 μm long and 2500 μm wide.The electrodes were simulated by an area on the LiNbO3substrate with defined electric potential.Six pairs of electrodes were considered in this study.The width of the electrodes was designed to change linearly from 35 to 70 μm to compensate for the reduction in size and pairs of electrodes.The PEGDA fluid domain had an area of 2000 μm×800 μm,and a height of 50 μm.
Several physical fields were applied during numerical simulation.Solid mechanical and electrostatic fields were considered for the LiNbO3substrate domain,as they further contributed to the piezoelectric effect of multiphysics coupling.The pressure acoustics (transient) field was applied to the PEGDA fluid domain to obtain an acoustic pressure field.An acoustic-structure boundary coupling was used at the interface between the LiNbO3substrate domain and the PEGDA fluid domain.
As for the governing equations,the anisotropy piezoelectric substrate is governed by (Dual and Möller,2012):
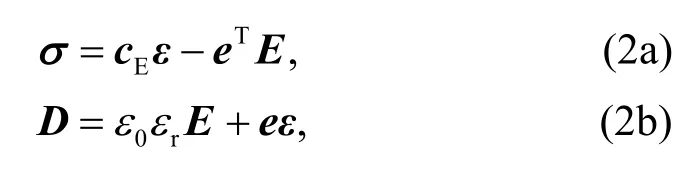
whereσis the stress;cEis the stiffness matrix;εis the strain;eis the coupling matrix;Eis the electric field;Dis the electric displacement;andε0andεrare the vacuum permittivity and relative dielectric constant,respectively.The material properties of the piezoelectric LiNbO3substrate,including the stiffness matrixcE,coupling matrixe,and relative dielectric constantεr,were adopted from Ma et al.(2016).
Perturbation theory was used to simplify the calculation of the acoustic pressure in the PEGDA fluid domain (Bruus,2012).Since it is very time consuming to calculate the second-order terms in time domain,especially for 3D modeling,only the firstorder terms were considered.Therefore,the governing equation can be expressed as
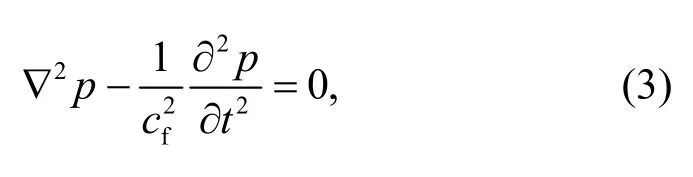
wherepis the acoustic pressure,tis the time,andcfis the sound speed of PEGDA.
The acoustic-structure boundary coupling contains the fluid load on the structure (Ai et al.,2013)and the structural acceleration experienced by the fluid (Mao et al.,2016).The condition can be derived as
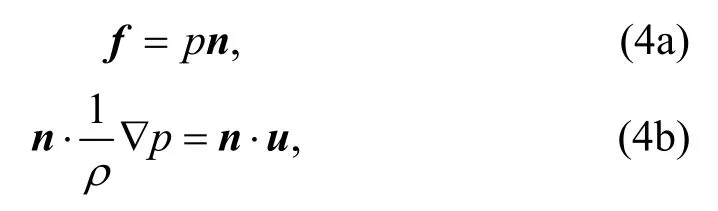
whereu,n,andfare the structure acceleration,surface normal,and the load experienced by the structure,respectively.
Numerical modeling was calculated in time domain,considering the situation when the signals of superimposed frequencies are applied.The initial state was set as zero,meaning that all variables in Eqs.(2)–(4) were zeros.The displacement in thezdirection on the LiNbO3surface and acoustic pressure in the PEGDA fluid were analyzed to investigate our method.The material properties used in the numerical modeling are listed in Table 1.
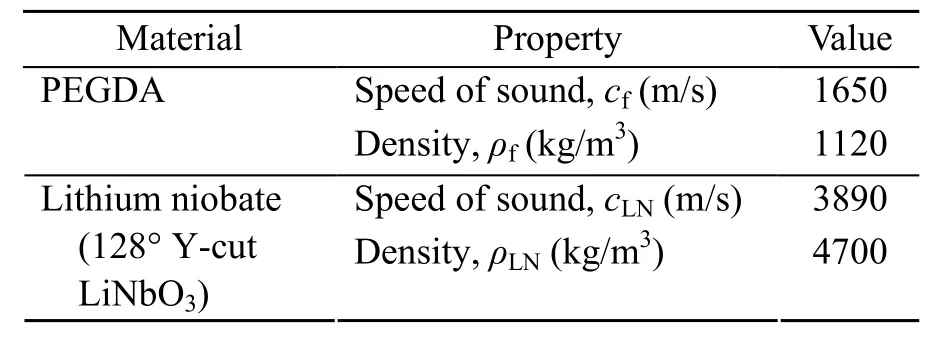
Table 1 Material properties used in the numerical modeling at the temperature of 25 °C
3.2 Boundary conditions and element mesh
Fig.3b illustrates the boundary conditions for the developed 3D FEM model.A fixed constraint boundary (BCfix) was added at the bottom of the LiNbO3substrate,setting a reference point for the calculation of elastic mechanics.A symmetrical boundary condition (BCsym) was used on the right side to reduce the computational cost.A low-reflecting boundary condition (BClow) was set on the outside of the LiNbO3substrate to let SAWs pass out from the model without any reflection in the time dependent analysis.Boundary conditions of ground (BCgro) and electric potential (BCpot) were added to the electrodes alternately (Fig.3b).The electric potential was set to 24 V,and the frequencies of 17,20,23,17.1,22.8,and 17.1 MHz,overlapped with 22.8 MHz,were applied.Finally,an impedance boundary (BCimp) was applied on the surface of the PEGDA fluid to replace the PDMS chamber (Devendran et al.,2016).An acoustic-structure boundary coupling was constructed at the interface between the LiNbO3substrate and the PEGDA fluid.Fine element mesh was applied to the developed 3D FEM model with the aim of improving the prediction accuracy.Firstly,a planar mesh was applied.The mapped quadrilateral mesh was used in the electrode domain,and the maximum size of elements was set at 35 μm.All electrodes were meshed to two elements in thexdirection,contributing to a fine element mesh with a maximum size of less than one eighth of the wavelength in the corresponding region.The PEGDA fluid domain was also treated with mapped mesh,ranging from 27.5 to 36.7 μm.Then,unstructured quadrilateral mesh with a pre-defined extremely fine element size (maximum size 56 μm) was applied to other domains.Finally,a swept mesh with hexahedral grid elements was applied to obtain the final mesh result.Considering the surface propagation characteristics of the SAW,the mesh elements of the LiNbO3substrate in thezdirection were set to dense in the upper region and sparse in the lower region.The final result of the mesh modeling is shown in Fig.3a.In total,there were 41 336 hexahedral grid elements in the meshed model,including 38 916 in the LiNbO3substrate domain and 2420 in the PEGDA domain.Mesh independence tests were conducted to confirm that the numerical results would not be affected by the mesh quality.
4 Experimental setup and procedure
4.1 SAW device fabrication
The fabrication method and process of the SAW device were adopted from our previous study (Wang et al.,2018).The SFITs were fabricated onto a double polished 128° Y-cut LiNbO3wafer using a standard lithography and lift-off technique.Firstly,a thin-layer of photoresist was spin-coated onto the LiNbO3wafer,and then the reversed electrode pattern was transferred onto the photoresist by ultraviolet (UV)exposure.Then,a 200-nm-thick aluminum layer was deposited on the surface of the photoresist-coated LiNbO3substrate by magnetron sputtering.Thirdly,acetone solution was used to dissolve the remaining photoresist to obtain the designed slanted-finger electrodes.The fabricated LiNbO3wafer was fixed onto a printed circuit board (PCB) using silver conductive adhesive.A photograph of the fabricated SAW device with the PDMS chamber is shown in Fig.4a.Two pairs of SFITs were fabricated for the purpose of fully using the LiNbO3substrate,while only the pair of SFITs along thexdirection was used during our experimental tests.
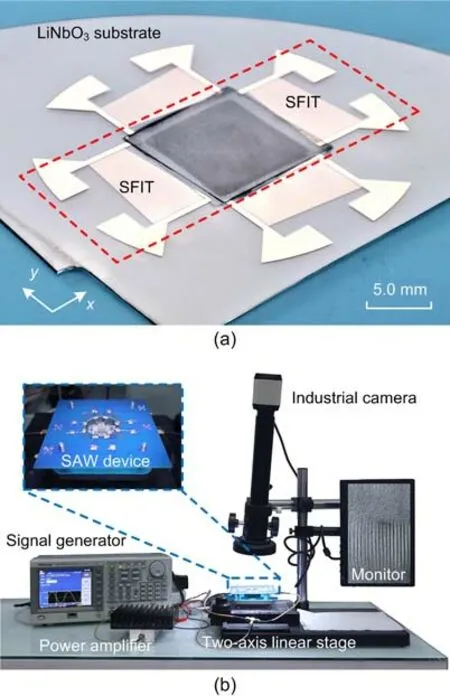
Fig.4 Photograph of the fabricated SAW device (a) and experimental setup for particle patterning (b)
4.2 Experimental setup
The experimental setup of the SAW device for microscale particle patterning is shown in Fig.4b.The SAW device was placed on a two-axis manual linear stage.An industrial camera (XDS-0745,Ruishikeni,China) with a monitor was used to observe the particle patterning results within the PDMS chamber during the experiments.A signal generator(AFG 3052C,Tektronix,USA) was used to generate a sinusoidal signal.The induced signal was amplified by a coaxial amplifier (ZHL-1-2W+,Mini-Circuits,USA),and split into two coherent signals for the IDTs to generate a standing SAW.
4.3 Experimental procedure
The PEGDA substrate used in this study was a mixture of 95% (w/v) PEGDA (Mn 700,Sigma,USA) and 5% (w/v) ethyl (2,4,6-trimethylbenzoyl)phenylphosphinate (TPO-L,ALADDIN,China).This solution was used as the medium for patterning of microscale Fe3O4particles.Fe3O4particles (NOI0108-PL,Rigor Bio-Tech,China) with a diameter of 0.8 μm were dispersed in water at an initial mass fraction of 5%,and then 3 mL of the particle-dispersed solution was mixed with 4 mL of the prepared PEGDA.The final mixed solution was sonicated for 15 min in an ultrasonic mixer to form a homogeneous solution.
To verify the proposed tunable particle patterning method and numerical predictions,a series of experiments were conducted to implement particle patterning under different working frequencies.Two sets of experiments were performed:firstly,to validate our hypothesis that tunable particle patterning can be achieved with different excitation signals,experiments with 17,20,and 23 MHz were conducted.Typically,the particle patterning procedure can be divided into four steps:(1) A 6-μL droplet of PEGDA solution was injected into the PDMS chamber.(2) Turning on the Tektronix signal generator,sinusoidal electric voltages were applied to the SFITs.Then,the SAWs were generated and propagated along the piezoelectric substrate surface.(3)After the acoustic pressure field was generated,the particles in the PEGDA solution moved to pressure nodes and the patterning could be observed on the monitor.(4) After about 2 s,the signal generator was turned off,and the particle patterning was obtained.Secondly,experiments with two different excitation signals in succession were performed to confirm the flexibility of the proposed method.Particle patterning under working frequencies of 16.5 and 17.5 MHz in succession,and patterning under the corresponding single frequencies were conducted.The experimental procedure was similar.
During the patterning process,the voltage of input signals generated by signal generator was set at 800 mV.The signals applied on the SFITs could reach about 24 V after amplification.The final patterned particles in PEGDA solution were observed using a microscope (OLS4100,Olympus,Japan).The period and width of the particle patterning were measured using the optical images from the microscope.
5 Results and discussion
5.1 Simulated results of acoustic pressure field
To demonstrate the capability of tunable particle patterning,numerical simulations of the SAW device were conducted.The frequency of electric potential was set as 17,20,or 23 MHz;the simulated displacement in thezdirection on the surface of the LiNbO3substrate and the acoustic pressure field in the PEGDA liquid domain att=60T(Tis the period of the corresponding excitation signal) are shown in Figs.5a–5f.First,we defined the spatial period of the acoustic field as the average adjacent distance of the six strip-like antinodes close to the symmetric line on one side.The width of the acoustic field was defined as the average width of all strip-like antinodes.Considering that the maximum absolute pressure of the subordinate pressure field was around 0.1 MPa,the width of one strip-like antinode had a threshold value of 0.1414 MPa.
Taking the numerical results at an electric potential with the frequency of 17 MHz as an example,the SAWs were excited in a narrow region,and propagated along thexdirection.The displacement in thezdirection on the LiNbO3substrate surface and the acoustic pressure in the PEGDA fluid are shown in Fig.5a.The amplitude of thez-axis displacement in the region where the PEGDA fluid was located was reduced.This was due mainly to the leakage of acoustic energy transmitted into the PEGDA fluid,which formed the acoustic pressure field in the PEGDA fluid.The same phenomenon occurred when the frequency changed to 20 or 23 MHz (Figs.5b and 5c).The periods and widths of the formed acoustic pressure fields were distinct inx-ycross sections which cut through the pressure antinodes.Fig.5d shows the pressure field in the PEGDA fluid where the pressure nodes and antinodes were patterned into parallel lines with a width of 759.4 μm and a period of 113.3 (~566.4/5) μm in the region aroundy=1210 μm.It was noticed that the spatial period between two pressure antinodes in the boundary area of the fluid was smaller than average,which may be attributed mainly to the Rayleigh angle (θR) when the SAWs were transmitted into the PEGDA fluid.Figs.5e and 5f show the numerical simulation results at 20 and 23 MHz,respectively.The SAWs were excited in the region aroundy=730 μm when an electric potential with 20 MHz was applied,and thus the acoustic pressure field in the PEGDA liquid domain was generated in the corresponding area.The width and period of the acoustic pressure field were 628.1 and 96.1(~480.7/5) μm,respectively.As to the simulated results at 23 MHz,the acoustic pressure field was generated in the region aroundy=420 μm,and had a width of 601.0 μm with a period of 87.5 (~437.6/5) μm.Therefore,the generated region of the acoustic pressure field could be adjusted by changing the input frequencies.
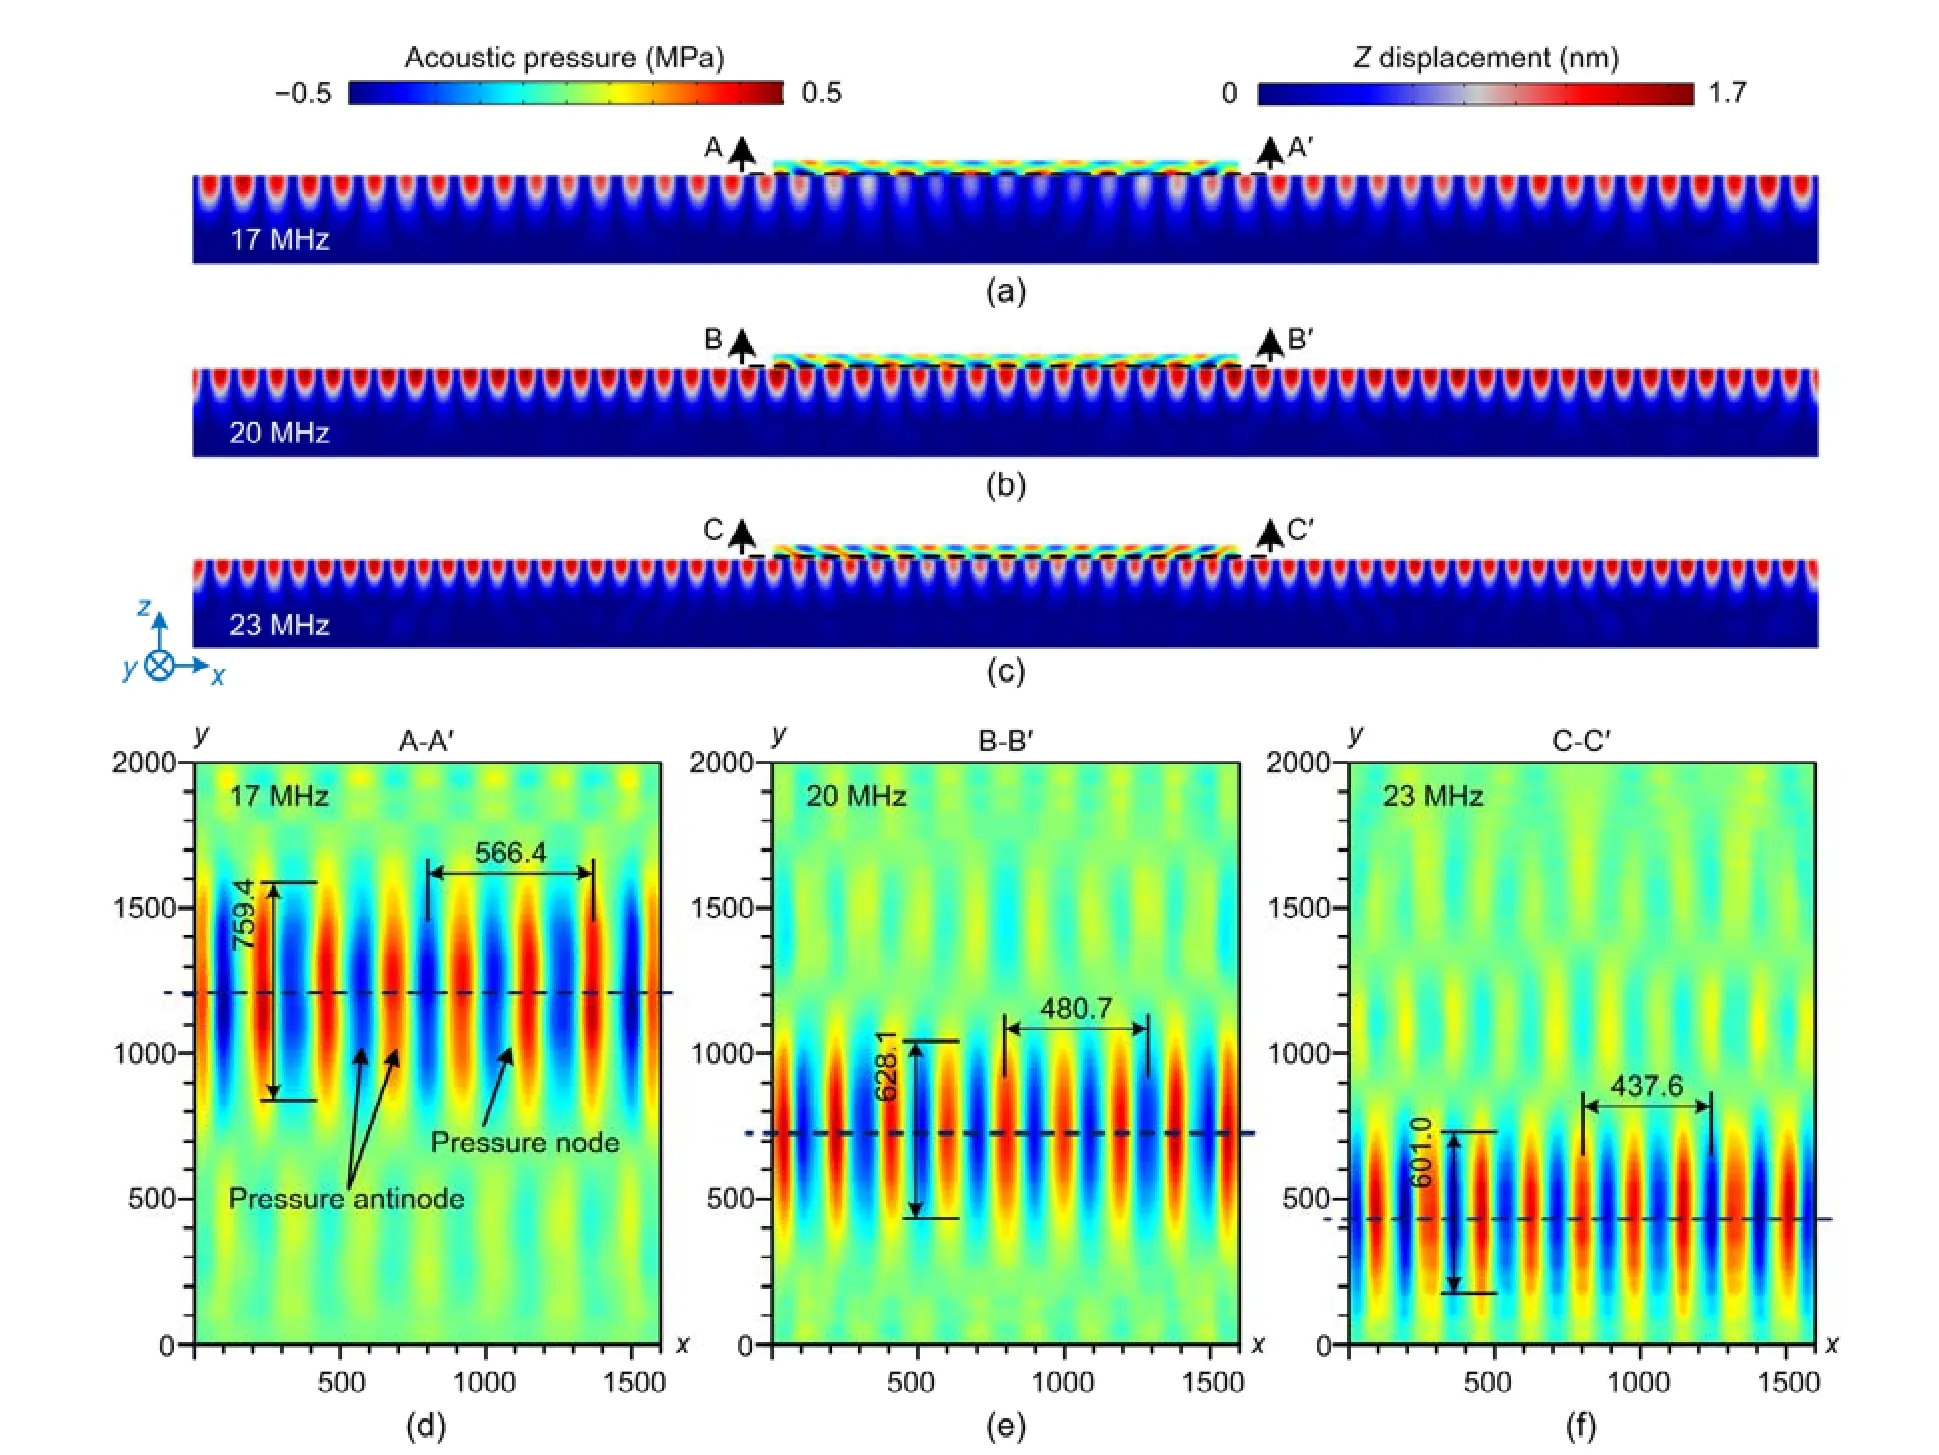
Fig.5 Z-axis displacement of the LiNbO3 surface and acoustic pressure of the PEGDA fluid in x-z cross section of the numerical model with the electric potential frequencies of 17 MHz (a),20 MHz (b),and 23 MHz (c),and acoustic pressure of the PEGDA fluid in x-y cross section with electric potential frequencies of 17 MHz (d),20 MHz (e),and 23 MHz (f)(unit:μm).The average spatial period of acoustic pressure field in the PEGDA liquid domain was 113.3,96.1,and 87.5 μm,respectively
More simulations were conducted to reveal the rules of the generated acoustic pressure field with different electric potential,and the results are shown in Figs.6a and 6b.The spatial period of the acoustic pressure field decreased as the frequency of electric potential increased.Also,the width of the acoustic pressure field tended to decline,except for an abnormal increase at 21.5 MHz.This may have been caused by the resonant mode of the simplified model,which was not found in our experiments.The decrease in width can be explained by a narrower region of SFITs being excited at higher frequencies.
We conducted another numerical simulation with two superimposed frequencies to confirm the flexibility of the SAW device with SFITs for tunable particle patterning.Simulations with the corresponding single frequencies were also conducted for comparison.The frequencies were set to 17.1 MHz,22.8 MHz,and 17.1 MHz superimposed with 22.8 MHz,respectively,and the simulation results are shown in Figs.7a–7c.The generated acoustic pressure field with superimposed frequencies had two regions of patterned pressure field (Fig.7c).Each region of the acoustic pressure field was similar to the acoustic pressure field generated with the corresponding single frequency,which revealed the possibility of patterning particles with various periods in different regions at the same time or in succession.Compared to acoustic pressure fields in Figs.7a and 7b,the corresponding region in Fig.7c had an upward shift,and the patterns aroundy=1280 μm appeared twisted.This may have been due to the subordinate pressure field generated near the main field.This phenomenon would be weakened in a real size simulation because the two regions would be further apart.
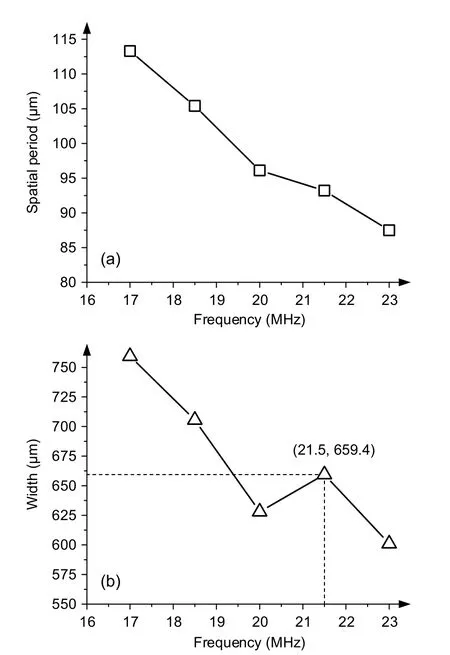
Fig.6 Spatial period (a) and width (b) variation of the numerical simulated acoustic pressure field in the PEGDA liquid domain with frequency changing from 17 to 23 MHz
5.2 Microscale particle patterning experimental results
We first considered particle patterning with a single frequency.Fig.8a gives a schematic view of the SAW device used,and shows the regions of particle patterning with different working frequencies.Figs.8b–8d show optical images of particle patterning under working frequencies of 17,20,and 23 MHz,respectively.The 0.8-μm Fe3O4particles were patterned in parallel lines with various periods and widths.When the working frequency was set to 17 MHz,the average period of the particle patterning was 116.4 (581.8/5) μm and the average width was 1145 μm (Fig.8b).Under a working frequency of 20 MHz,the period was 97.7 (~488.7/5) μm and the width 861 μm (Fig.8c),and at 23 MHz the period was 83.9 (~419.7/5) μm and the width 710 μm (Fig.8d).Thus,the positions,spatial periods,and widths of the particle patterning all changed with the frequencies of the excitation signals.Some small flaws occurred in the experimental results,which might have resulted from the slightly uneven initial particle dispersion in the thin liquid layer and acoustic streaming excited by travelling wave components.
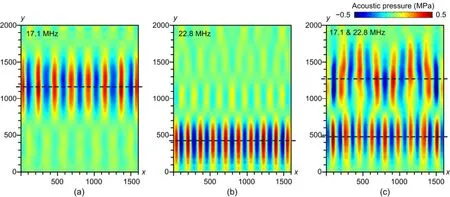
Fig.7 Numerical simulated results of acoustic pressure in the PEGDA liquid domain with electric potential frequencies of 17.1 MHz (a),22.8 MHz (b),and 17.1 MHz superimposed with 22.8 MHz (c) (unit:μm)
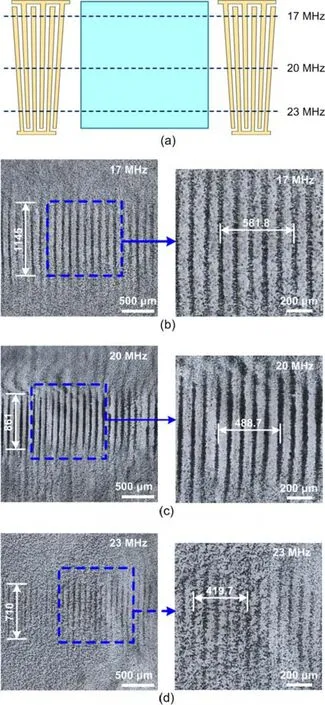
Fig.8 Schematic view showing the positions of different particle patterns (a),and tunable particle patterning of 0.8-μm Fe3 O4 particles at frequencies of 17 MHz (b),20 MHz (c),and 23 MHz (d) (unit:μm).The average spatial period was 116.4,97.7,and 83.9 μm,respectively
The experiment for each working frequency was carried out five times to confirm the repeatability.Fig.9 shows a comparison of the spatial periods between acoustic pressure in numerical modeling and particle patterning in experiments.Generally,the actual periods of the particle patterning matched well with those of the numerical simulated acoustic pressure.The distribution and the trend of width variation of the particle patterning were also in accord with the simulated results.In conclusion,tunable particle patterning with a period shifting from around 83.9 to 116.4 μm,and a width of about 710 to 1145 μm can be achieved through the proposed method.Compared to particle patterning using an interdigital transducer,the main differences were the tunable spatial periods and a narrow patterning region.However,we observed that the particle patterning using SFITs could also expand when the excitation signal was sustained for a much longer time.This was due mainly to the subordinate pressure field generated near the main field,which can also be observed in our simulation results (Figs.5d–5f).We observed that particles near the wall of the chamber moved toward the center in the experiments.This may have been due to the acoustic streaming induced by the second-order fields,which we neglected in the simulation.However,this phenomenon occurred only in the area very close to the chamber wall,and particles in the central region maintained a stable regular striped patterning.
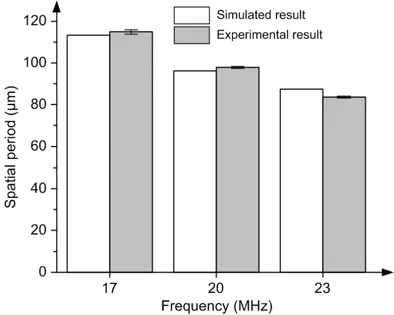
Fig.9 A comparison of spatial period between numerical modeling and particle patterning experiments,with standard deviations
We conducted further particle patterning with two excitation signals of various frequencies in succession.Particle patterning under one single working frequency of 16.5 MHz or 17.5 MHz was performed first,followed by particle patterning with excitation signals of 16.5 MHz and 17.5 MHz in succession.Figs.10a and 10b show the experimental results of particle patterning under working frequencies of 16.5 and 17.5 MHz,respectively.The particle patterning occurred only in a narrow region corresponding to the working frequency.Particle patterning with different spatial periods in two regions could be obtained by applying excitation signals of 16.5 and 17.5 MHz in succession (Fig.10c).The spatial period and width of each pattern were similar to those when applying the single corresponding frequency.There was almost no interference between the two particle patterns,which reveals the flexibility of the proposed method.Similarly,more complex particle patterning can be achieved by applying more excitation signals in succession.The frequency difference should be considered to avoid overlap or interference between two patterns.With particles positioned with different spatial widths in one sample,multifunctional composite materials with properties changing in different areas could be obtained in future.
6 Conclusions
In summary,we proposed a novel method to pattern microscale particles in PEGDA solution by using an SAW device with SFITs.The structural design of the SAW device and SFITs and its working principle were presented.The proposed SAW device can generate a localized acoustic pressure field in the polymer-based fluid film to pattern the microscale particles within.A 3D numerical model of the SAW device was developed,and simulation results confirmed that a localized acoustic pressure field can be generated and adjusted by varying the frequencies of the excitation signals.Two sets of experiments were then performed,and results demonstrated that the microscale particles (Fe3O4) can be successfully patterned into localized strip-like patterns in the PEGDA solution.By applying excitation signals of different frequencies,the spatial periods and widths of the particle patterns can be easily adjusted.Typically,the spatial period of the pattern was about half the wavelength of the signals used.
This study opens up the opportunity to pattern microscale particles in polymer-based solutions for the preparation of composite functional materials.For future work,more experiments will be conducted to investigate the effects of patterning parameters,such as the working voltage and frequency,and the height of the chamber.Simulation of the second-order fields will be performed to study the influence of acoustic streaming.In addition,applications of this patterning method for microscale particles will be investigated,such as in magnetic drive units and anisotropic conductive films.
Contributors
Yan-cheng WANG designed the research.Cheng-yao XU and Jia-wei LIU processed the corresponding data.Cheng-yao XU wrote the first draft of the manuscript.Yan-cheng WANG helped to organize the manuscript.De-qing MEI revised and edited the final version.
Conflict of interest
Yan-cheng WANG,Cheng-yao XU,De-qing MEI,and Jia-wei LIU declare that they have no conflict of interest.
 Journal of Zhejiang University-Science A(Applied Physics & Engineering)2021年5期
- Journal of Zhejiang University-Science A(Applied Physics & Engineering)的其它文章
- Influences of fiber length and water film thickness on fresh properties of basalt fiber-reinforced mortar*
- Multi-geomagnetic-component assisted localization algorithm for hypersonic vehicles*
- Analytical solution for upheaval buckling of shallow buried pipelines in inclined cohesionless soil*
- Framework of automated value stream mapping for lean production under the Industry 4.0 paradigm*
- Optimization of smoke exhaust efficiency under a lateral central exhaust ventilation mode in an extra-wide immersed tunnel*