
Effects of filleting methods on composition, gelling properties and aroma pro file of grass carp surimi
2021-05-20 08:53LiuShiTaoYinQilinHuangJuanYouYangHuDanJiaShanaiXiong
食品科学与人类健康(英文) 2021年3期
Liu Shi, Tao Yin,c,*, Qilin Huang, Juan You, Yang Hu, Dan Jia, Shanai Xiong
a Institute of Agricultural Products Processing and Nuclear Agricultural Technology, Hubei Academy of Agricultural Sciences, Wuhan 430073, China
b College of Food Science and Technology, Huazhong Agricultural University, Wuhan 430070, China
c National R & D Branch Center for Conventional Freshwater Fish Processing, Wuhan 430070, China
d College of Animal Science and Technology, Yunnan Agricultural University, Kunming 650201, China
Keywords:
MRI
Fish tail
Fish belly
Fish protein
Microstructure
ABSTRACT
Traditionally, fish carcass is headed and gutted to prepare a skin-on fillet in surimi production. In this study,tail and/or belly of grass carp carcass were further cut off in the filleting step. Yield, composition, gelling properties and aroma profile of surimi as affected by filleting methods were investigated by SDS-PAGE,ELISA, SEM, magnetic resonance imaging (MRI) and electron nose. Cutting tail off increased surimi yield by 14.0%, whereas cutting belly off decreased it by 11.2%. Cutting tail or belly off significantly decreased fat content, but did not change protein content, ash content, cathepsin (B, H and L) contents, nor protein patterns.Both breaking force and whiteness of surimi gel significantly increased after cutting tail off. Cutting belly off slightly increased whiteness of surimi gel. The microstructure of all the surimi gels was compact and uniform,with fractal dimensions (Df) ranging from 2.81 to 2.85. As for the macrostructure, cutting tail off apparently improved the integrity of surimi gel while cutting belly off did not. Aroma profiles of the surimi prepared under different filleting methods could be clearly distinguished by linear discriminant analysis (LDA). Our results indicate that cutting tail off contribute positively to surimi production.
1. Introduction
Surimi is concentrated fish myofibrillar proteins sequentially produced through the steps of filleting, deboning (mincing), washing,refining, dehydrating, blending with cryoprotectants, packaging,and freezing [1]. In the production of surimi, to recover as much myofibrillar proteins as possible is the great concern, because higher productions yield generally leads to higher profit. The production yield is largely depended on the method used to prepare a fish cut or fillet for deboning [1]. Currently, the filleting methods applied in the surimi production are varied to fish size, fish species, and machinery, etc. The most popular one is to produce a skin-on fillet from the fish carcass after heading, gutting, and cleaning belly walls[1]. However, in recent years, some surimi producers further cut tail and/or belly off the headed and gutted (H & G) fish carcass prior to deboning [2]. They believed that cutting tail and/or belly off in the filleting step would bring benefits to the surimi industry rely on the following as assumptions: 1) fewer impurities like fragments from belly and tail would be embedded in the final surimi [3], increasing quality of surimi; 2) less washing water would be needed due to less fat and water-soluble proteins in the fish mince, cutting production cost; 3) the tail and belly could be used for fried and other kinds of foods, creating additional values [1-4]. Nevertheless, very few data are available to verify these assumptions so far.
Myofibrillar proteins, predominantly myosin and actin, are distributed in striated thick and thin filaments of myofibrils, which in turn are encased in sarcomeres offish muscle fiber [5]. Fish muscles from different fish parts (like dorsal muscle, tail, and belly, etc.)may be varied in compositions [6]. For instance, as compared with dorsal muscle, muscle from a fish belly is richer in fat content [7],while muscle from a tail may be higher in water-soluble sarcoplasmic proteins [8]. Researchers have reported that fat oxidization impacts properties of surimi including gelling ability, color, and flavor[9,10]. Besides, proteases (especially cathepsin B, H, and L) from sarcoplasmic proteins hydrolyze myofibrillar proteins, resulting in the softening of heat-induced surimi gel [10]. The filleting method may affect the compositions of surimi, which would eventually influence the properties of the heat-induced surimi gel. However, relative information does not exist in the literature.
Grass carp (Ctenopharyngodon idellus), with an annual output of over 5 million t, ranks the first in production volume among all of the aquacultured fishes in China [11]. Beside silver carp(Hypophthalmichthys molitrix), grass carp is another kind of freshwater fish species widely used for surimi production [12]. Year-round harvested grass carp (2-5 kg) is much bigger than silver carp (1-2 kg).Cutting tail and belly off from fish carcass and recover these byproducts manually or mechanically would be easier. Therefore,this study investigated the effects of filleting method on yield,composition, gelling properties and aroma pro file of grass carp surimi,aiming to provide the fundamental supports for the improvement on the quality of grass carp surimi.
2. Materials and methods
2.1 Materials
Grass carp, approximately 2.5 kg, was harvested in winter from a local fish farm (Wuhan, China) to make surimi in this study. Enzymelinked immunosorbent assay (ELISA) kits for determining cathepsin B (product code: JLC16300), cathepsin H (product code: JLC14366)and cathepsin L (product code: JLC14452) were purchased from Gelatins Bioengineering Co., Ltd (Shanghai, China). Reagents and pre-casted acrylamide gel used for sodium dodecyl sulfatepolyacrylamide gel electrophoresis (SDS-PAGE) were purchased from Bio-Rad Laboratories Co., Ltd. (Shanghai, China). Chemicals used in the determinations of fat and protein and the preparation of samples for scanning electron microscopy (SEM) observation, were of analytical grade and purchased from Sino harm Chemical reagent Co., Ltd (Shanghai, China).
2.2 Preparation of surimi under different filleting methods
Surimi was prepared under the method of Zhang et al. [13] with some modifications. Grass carp from the same batch was randomly divided into 4 groups. The live fish was stunned with a forceful and accurate blow to the head with a blunt instrument in the most humane way. The fish was then descaled, headed, gutted, and thoroughly rinsed to remove the blood and other impurities. The fish carcass was subjected to 4 kinds of filleting methods (Fig. 1) before entering a drum-type fish meat separator (4 mm perforation, YBYM-6004-B,Yingbo Food Machinery Co., Ltd., Xiamen, China). For the filleting method 1 (F1), fish carcass was cut into two pieces of skin-on fillets and backbone part. The cut was moved in a straight line across the backbone from tail to the other end. For the filleting method 2 (F2),fish tail (approximately 5% of the total weight of the fish carcass) was further cut off from the backbone part. For the filleting method 3 (F3),fish belly (approximately 25% of the total weight of the fish carcass)was further cut off from the skin-on fillets. For the filleting method 4 (F4), both tail and belly were cut off. In each group, the fillets and backbone parts went through the meat separator three times. The obtained fish mince was mixed with ice water at a weight ratio of 1:4 and gently stirred for 10 min. The washing process was repeated three times to remove fat and water-soluble proteins. The washed fish mince was dumped into a fabric bag (80 mesh) and then centrifuged(SS-300, Runxin Machinery Works, Zhangjiagang, China) at 15 000 r/min for about 5 min. The dewatered mince was blended with cryoprotectants (6% sucrose and 0.3% sodium tripolyphosphate)using a comminution machine (UM 5 universal, Stephan Machinery Corp, Columbus, OH, USA). The surimi sample (approximately 800 g) was flattened (approximately 1 cm in thickness) prior to vacuum packaging. Finally, the surimi was frozen at -18oC in a walk-in freezer and used within one month. The surimi samples made by the filleting methods of F1, F2, F3 and F4 were termed as F1 surimi, F2 surimi, F3 surimi and F4 surimi, respectively, hereafter.

Fig. 1 Fish fillets under 4 kinds of filleting methods.
2.3 Determinations of yield, proximate compositions and cathepsin content
The yield was calculated according to the method of Tan et al. [14]with some changes. In each group, weight of raw fish and the resultant surimi was recorded. The yield was calculated as weight percentage of the surimi to the raw fish. The weight of surimi produced under different filleting methods was calibrated using a constant of 0.76 to balance moisture variances.
Muscle flesh (dorsal part, tail and belly) and surimi as described in section 2.2 were used as samples for the determinations of proximate compositions including moisture, fat, protein, and ash. The determinations were carried out according to the method of Yin et al. [15].
The contents of cathepsin B, H, and L were determined according to the methods as described by Zhong et al. [16] using ELISA kits.Accurately weighed 5 g surimi was added with 20 mL cold NaAc solution (50 mmol/L NaAc, 100 mmol/L NaCl, 1 mmol/L EDTA,pH 5.0) prior to homogenizing (FJ-200, Shanghai Specimen and Models Factory, Shanghai, China) under 5 000 r/min for 2 min.The homogenate was centrifuged (J-26XP, Beckman Coulter Inc.,Fullerton, CA, USA) under 4oC and 10 000 r/min for 20 min. The supernatant was used as crude extract for ELISA assay.
2.4 Analysis of protein patterns
The protein patterns offish mince obtained by 4 kinds of filleting methods were analyzed using SDS-PAGE according to Yin et al. [5].The protein sample extracted by 5% (m/m) SDS was adjusted to a concentration of 1 mg/mL. β-mercaptoethanol was added to disrupt disulfide bonds. The protein sample (5 μL) was loaded onto wells of a pre-casted 12% acrylamide gel. The acrylamide gel was vertically placed in a Mini-PROTEAN Tetra Cell (Bio-Rad Laboratories Co.,Ltd., Hercules, CA, USA) and subjected to electrophoresis under 240 V for 40 min.
2.5 Surimi gel preparation
The preparation of surimi gel was carried out according to the method as described by Liu et al. [17] with some modifications. The frozen surimi was cut to small pieces using a stainless-steel knife. Salt and ice water were added into the surimi to reach final salt content and moisture content at 2% and 78%, respectively. The mixture was continuously chopped using a silent cutter (Multiquick3, Braun,Germany) at speed 5 for 10 min. The obtained surimi paste was incubated at 90 °C for 30 min to form a gel.
2.6 Measurements of texture and color parameters
The textural values (breaking force and penetration distance) of surimi gel were evaluated by penetration test according to Liu et al.[17] using a TA. XT. Plus Texture Analyzer (Stable Micro Systems,Goldaming, Surrey, U.K.). Measurements of color parameters including L* value (lightness), a* value (redness to greenness), and b* value (yellowness to blueness) were carried out according to the method of Guo et al. [18] using a CR-400 colorimeter (Konica Minolta, Osaka, Japan). The equation of L-3b recommended by Park[19] was used to calculate whiteness (W) of surimi gel.
2.7 Microstructure analysis
The microstructure of surimi gel was analyzed with the method of Liu et al. [17] using a field emission scanning electron microscope(JSM-6390PLV, JEOL, Tokyo, Japan). The surimi gel sample was prepared in the following sequences: cutting to slices (2 mm), fixing in glutaraldehyde solution (25 mg/mL), dehydrating by graded ethanol solutions (70% to 100%), drying with a critical-point dryer (HCP-2,Hitachi Koki Co., Ltd., Tokyo, Japan), and sputter-coating with gold.The obtained SEM images were transformed to 8-bit binary images prior to analyzing fractal dimension according to the method of Dàvila et al. [20] using the Frac-Lac 2.5 tool of the software ImageJ(V1.3n, National Institution of Health, Bethesda, USA).
2.8 Magnetic resonance imaging (MRI) analysis
The proton density weighted image was obtained under the method of Guo et al. [18] by using an nuclear magnetic resonance (NMR)analyzer 20-25 (Niumag Co., Ltd., Shanghai, China). Spin echo sequence was applied in the test and its main parameters were set as follows: echo time (TE), 20 ms; repetition time (TR), 500 ms; field of view (FOV),80 mm × 80 mm; slice width, 3.0 mm; and gap, 2.0 mm.
2.9 Electronic nose (E-nose) analysis
The flavor profile of surimi was analyzed according to the method of Zhang et al. [21] using an electronic nose device (Pen III,Airsense, Germany) assembled with 10 different MOS (metal oxide semiconductor) sensors. In brief, surimi (3.0 g) was placed in 20 mL headspace vial and calibrated at room temperature (30 °C) for 30 min.The main testing parameters were set as follows: flow rate,150 mL/min; assessment time, 100 s; and flush time, 110 s. The data obtained from the sensor array of the electronic nose were analyzed by linear discriminant analysis (LDA) with a software of Winmuster(Version 1.6.2.22, Airsense Analytics GmbH, Schwerin, Germany).
2.10 Statistical analysis
All the experimental tests were performed at least two replications.In each replication, at least three samples were tested. Analysis of variance (ANOVA) was carried out using the SAS program (V8, SAS Institute Inc., Carry, NC, USA). Differences among mean values were evaluated by the Duncan multiple range test (DMRT) using a 95% confidence interval.
3. Results and discussion
3.1 Yield, proximate compositions and cathepsin content
Yields of surimi made by the filleting methods of F1, F2, F3 and F4 were 27.8%, 31.7%, 24.7% and 25.7%, respectively (Table 1). Xiong [22] reported that yield of grass carp surimi made by the traditional filleting method (F1) was about 30%, which is consistent with the results of this study. Yield of F2 surimi was higher than that of F1 surimi; F4 surimi was higher than F3 surimi, indicating cutting off fish tail was beneficial for the yield improvement. During mincingprocess, fish fillet was pressed between a traveling rubber belt and a steel drum with numerous orifices. The fish muscle flesh was pressed into the interior of the drum through the orifices, while separating fish bone, skin and other impurities into the exterior of the drum. Fish tail is a small portion (approximately 5%) of the fish carcass subjected for mincing. Muscle flesh from fish tail contributed slightly to the yield.However, fragments or particles were generated when fish tail was repeatedly pressed and crushed, which might block the drum orifices[1], resulting in the reduction of surimi yield. Therefore, cutting off fish tail improved the yield. Unlike cutting off fish tail, cutting off fish belly decreased yield significantly (P< 0.05), as denoted by the results that yields of F3 surimi and F4 surimi were lower than those of F1 surimi and F2 surimi, respectively. The reason may be due to the significant reduction of muscle flesh (approximately 25%) for mincing. As compared with the F1 method, yield of surimi made by the F4 method decreased by 7.5%.
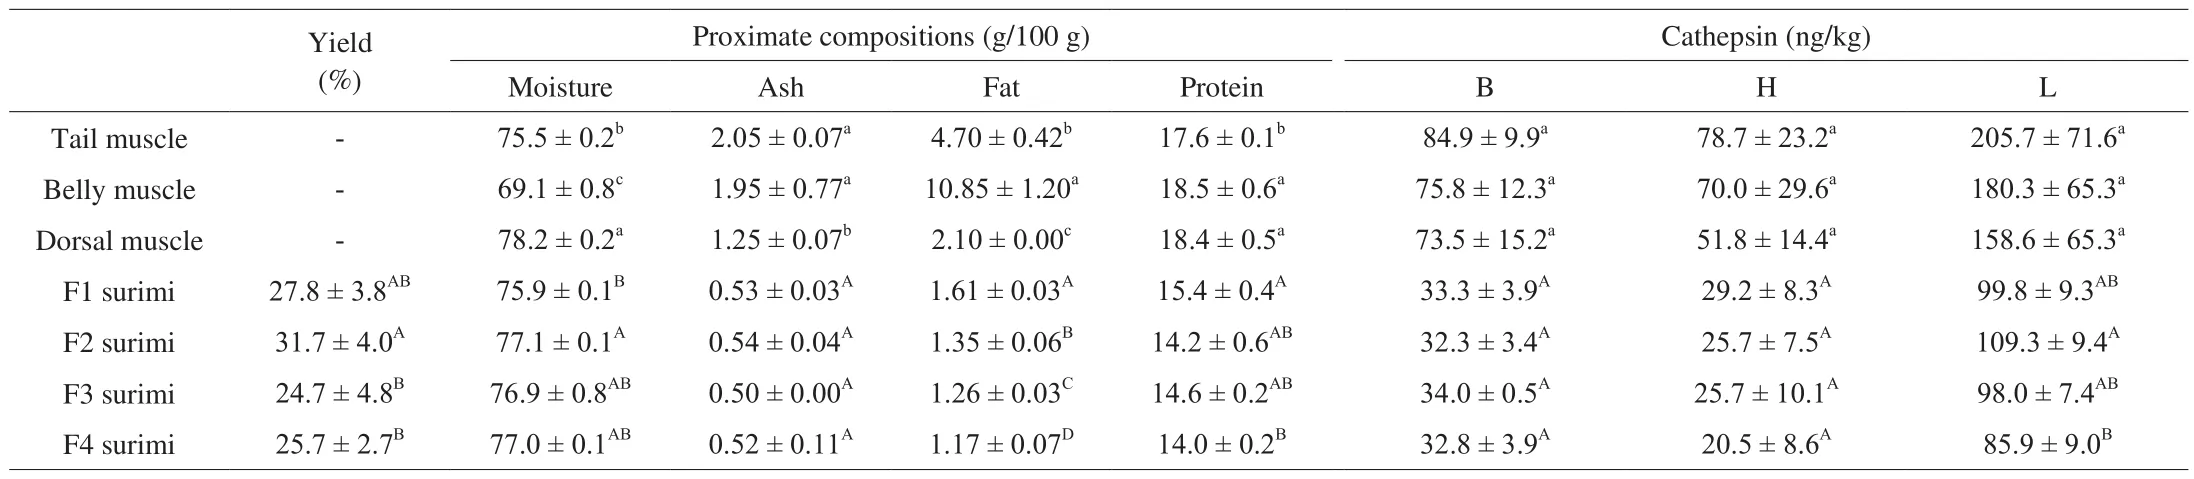
Table 1Proximate compositions and cathepsin contents offish muscle and surimi under 4 kinds of filleting methods.
Moisture contents and protein contents of the surimi made by different filleting methods were slightly different (P< 0.05), while ash content was not different (P< 0.05). F1 surimi showed the highest fat content (1.61%), followed by F2 surimi (1.35%) and F3 surimi(1.28%); that F4 surimi exhibited the lowest one (1.17%). Cutting off tail and/or belly significantly (P< 0.05) decreased the fat content, which may be explained by the relative higher (P< 0.05) fat contents of the tail and belly muscles with respect to the dorsal muscle (Table 1).
It has been reported that among all the proteinases cathepsin B,H, and L are dominantly responsible for the modern phenomenon of surimi during heating, which are due to their characteristics of heat stability, associating with myofibrils and high activity [8,23,24].As shown in Table 1, contents of cathepsin B, H, and L of dorsal muscle were 73.5, 51.8, and 158.6 ng/kg, respectively. With respect to the dorsal muscle, those cathepsin contents from tail muscle and belly muscle were higher but not significantly different (P> 0.05).Contents of cathepsin B and H among various kinds of surimi samples were not significantly (P> 0.05) different, while cathepsin L from F4 surimi was slightly lower (P< 0.05) than the other three samples.As compared to the dorsal muscle, contents of cathepsin B, H,and L in the F4 surimi decreased by 55.4%, 58.9%, and 45.8%,respectively. Proteinases are water-soluble and therefore can be removed during washing. However, some proteinases are bound to myo fibrils and are not removed completely by washing, posing more severe degradation in surimi [25]. The results indicate that cathepsin L was bound more tightly to myofibrils, which is in agreement with the reports by An et al. [26].
3.2 Protein patterns
Protein composition offish mince (before washing) and surimi(after washing) were analyzed by SDS-PAGE to identify their protein patterns and investigate any changes by filleting method. As shown in Fig. 2, bands in descending intensity order including myosin heavy chain (MHC), actin (AC), tropomyosin (TM), troponin-T (TN T), and myosin light chains (MLC) were clearly visible for all the samples in the SDS-PAGE gel, which are typical patterns offish proteins according to the previous reports [5,13]. Numerous proteins bands with molecular weights ranging between 40 and 200 kDa were also observed in the SDSPAGE gel. It was noticed that intensities of MHC, AC, and TM were obviously increased after washing, while TN T, MLC 2, and bands with molecular weight of around 60, 50 (enolase), and 39-41 kDa (a double band assumed to be creatine kinase and aldolase) [27] were decreased.The reason may be that the majority of water-soluble sarcoplasmic proteins and a small portion of water-insoluble myofibrillar proteins were washed away during washing process, resulting in the concentration of most myofibrillar proteins while the dilution of sarcoplasmic proteins [1].Intensities of the observed bands were not different among the mince or surimi samples under different filleting methods, suggesting the protein pattern of surimi was not affected by the filleting method.

Fig. 2 Protein patterns offish mince under 4 kinds of filleting methods. M:protein markers; MHC: myosin heavy chain; AC: actin; TM: tropomyosin; TN T: troponin-T; MLC 1: myosin light chain 1; MLC 2: myosin light chain 2;MLC 3: myosin light chain 3.
3.3 Mechanical properties and color parameters
Mechanical properties and color parameters of the surimi gel are vital indicators of the surimi quality, which determine customs’acceptance toward the end products. As shown in Fig. 3, the breaking force of gels made from surimi under the filleting methods of F1, F2,F3, and F4 were 235, 274, 223, and 272 g, respectively. Penetration distance were 9.3, 9.6, 9.2, and 10.2 cm, respectively. Breaking force of F2 surimi gel was significantly higher (P< 0.05) than that of F1 surimi gel, penetration distance was slightly higher (P> 0.05). It indicates that cutting off fish tail contributed to the improvement of mechanical properties. The improvement may be due to the removal of fragments or particles generated from fish tail, which improved the integrity of surimi gel.
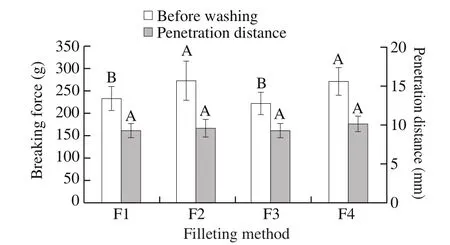
Fig. 3 Breaking force and penetration distance of surimi gels under 4 kinds of filleting methods. Different letters indicate significant difference (P < 0.05)among samples under 4 kinds of filleting methods.
Breaking force and penetration distance were not different(P> 0.05) between F3 surimi and F1 surimi, indicating cutting off fish belly had no impact on the mechanical properties. It has been reported that fat incorporation into surimi gel induced the oxidation reaction and disrupted the microstructure of protein gel, thereby decreasing the gel strength [9,28]. Fat content decreased by cutting off fish belly(Table 1). However, in this study, mechanical properties of surimi gel were not affected by the fat content, which is inconsistent to previous reports [9,28]. The reason could be attributed to a much narrower variable scope of fat content (1.17%-1.61%) [9,28], which thus might have hardly any effect on the oxidation of protein and disruption of gel matrix (Fig. 4). As compared with F1 surimi gel, breaking force and penetration distance of F4 surimi increased by 15.7% and 9.6%,respectively.
Color parameters ofL* anda* were not different (P> 0.05)among all the surimi gel samples (Table 2). The value ofb*significantly (P< 0.05) decreased by cutting off belly or tail. It may be attributed to the reduction of fat content and heme proteins (hemoglobin and myoglobin), respectively, in surimi [8,9]. Cutting off belly or tail increased (P< 0.05) the value ofWof surimi gel. TheWwas increased from 67.21 to 69.17 when both belly and tail were cut off.

Table 2Color parameters of gels made from surimi under 4 kinds of filleting methods.

Fig. 4 MRI of gels made from surimi under 4 kinds of filleting methods. Color bar is used to scale the density of protons from various water molecules: red color indicates the higher density of protons and blue color indicates the lower density.
3.4 MRI images
MRI is a rapid and non-invasive technique which has been increasingly applied in food product to analyze the water distribution and as well as internal (macrostructure) structure by mapping the density and mobility of proton spins [29]. The proton density weighted images of the gels made from surimi under different filleting methods are shown in Fig. 4. The images of all the 4 samples showed green background which corresponded to the water immobilized in gel matrix [30]. Numerous pixels in red and orange (white arrow) were well noticed in the images of the F1 and F3 surimi gels, suggesting high levels of free water distributed in local areas [18]. However,neither red nor yellow pixels were observed in the images of F2 and F4 surimi gels. Plenty of pixels with dark-blue color, variable size, and irregular shape (black arrow) were distributed in all the images randomly. The number and size of the dark-blue pixels were larger in the images of the F1 and F3 surimi gels. Upon heating the unfolded myofibrillar proteins aggregate to form a three-dimensional gel network which entraps water and other ingredients [8]. The observed pixels in the gels (Fig. 4) were related to the incorporation of fragments or particles generated from fish tail, resulting in the formation of free water (red or orange pixels) and voids (dark-blue pixels) at local area [17,31]. Results suggest that cutting off tail was favor for the formation of a homogeneous gel macrostructure.
3.5 Microstructure
Microstructure of gels made from surimi under different filleting methods was studied using scanning electron microscopy (SEM).As shown in Fig. 5, fibrous matrix, which is a characteristic of heatinduced protein gel [17,32], was clearly observed in all the surimi gels. The fibrous matrix was uniform and compact, indicating fish myofibrillar proteins were moderately unfolded and subsequently well cross-linked to form gels [17,33]. The matrix of all the surimi gels was quite similar. Fractal dimension (Df) has been successfully used for objectively quantifying the heterogeneity or complexity of the matrix images of protein gels [20]. Dfvalues for the 4 samples were comprised between 2.81 and 2.85, con firming filleting method had no effect on microstructure of the grass carp surimi gel.
However, in different gel samples, it was well noticed that fat droplets with varied sizes (0.1-2 μg) and numbers were distributed within the continuous phase of gel matrix (yellow arrow). The fat droplets were the largest in the F1 surimi gel. As compared with the F1 surimi gel, the fat droplets observed in the F2 surimi gel were smaller in size while almost the same in number. Whereas much fewer and smaller fat droplets were observed in the F3 and F4 surimi gels.Basically, the number and size of the fat droplets was proportional to the fat content of surimi samples (Table 1). It is in agreement with the report by Zhou et al. [34] that with the increase of camellia tea oil concentrations from 0% to 8%, the number of oil droplets observed in the surimi gel continuously increased.
3.6 Aroma pro file
Radar map (Fig. 6a) derived from E-nose signal was developed to compare the aroma profiles of surimi under different filleting methods. As shown in Fig. 6a, the sensor S6 (broad methane)contributed the most to the surimi samples, meaning the surimi contained more of these volatile compounds with methyl group. An et al. [35] and Zhang et al. [10] reported that aldehydes were the most predominant compounds in carp surimi, followed by alcohols,alkanes, and esters. Except for S6 and S8 sensors, sensor signals of different surimi samples were overlapped. The results indicate that surimi prepared under 4 different filleting methods had similar aroma profiles.
Linear discriminant analysis (LDA), a supervised pattern recognition method that maximizes the ratio of between-class variance and minimizes the ratio of within-class variance, has been widely used to construct discriminant model for distinguishing food flavor with clear separation [36]. According to the LDA diagram in Fig. 6b,the contribution rates of the first linear discriminate (LD 1) and the second linear discriminate (LD 2) was 71.5% and 11.7%, respectively.The cumulative contribution of the first two linear discriminates was 86.2%, suggesting that they could well represent the total variances of the aroma pro file. The spatial regions of the 4 samples were clearly separated. As mentioned previously, fat contents of surimi under different filleting method were significantly different (Table 1). Zhang et al. [10] reported that oxidization of fatty acids had significant effect on volatile compounds composition of grass carp surimi. Our results con firm the ability of the electronic nose to differentiate aroma pro file in surimi prepared under 4 different filleting methods.

Fig. 5 Scanning electron microscopy (SEM) images (left) and corresponding binary images (right) of gels made from surimi under 4 kinds of filleting methods.

Fig. 6 Radar map (a) and LDA (b) of surimi under 4 kinds of filleting methods. S1: aromatic compounds, S2: broad range, S3: ammonia used as an aromatic compound sensor, S4: hydrogen, S5: aromatic-aliph, S6: broad methane, S7: sulfate-organic, S8: broad alcohol, S9: sulfate-chloride, and S10:methane-aliph.
4 Conclusion
Fish filleting method affected yield, composition, gelation properties and aroma profile of grass carp surimi. Yield slightly increased from 27.8% to 31.7% by cutting tail off, while decreased to 24.7% by cutting belly off. Breaking force of surimi gel significantly increased by cutting tail off, which may be mainly due to the improvement on integrity of surimi gel. Cutting off tail or belly significantly increased whiteness which was mainly attributed to the reduction on fat content. Cutting both tail and belly off resulted in the reduction of yield by 7.5%, but significant improved gel texture and whiteness. Aroma profiles in surimi prepared under 4 different filleting methods were able to be distinguished by electronic nose,possibly owing to varied fat contents in different samples. Our results con firm that cutting tail off led to the improvements on both the yield and quality of grass carp surimi. Cutting belly off might be a beneficial operation in the production of grass carp surimi,on the condition that the belly could be well utilized for other commercialized products.
Declaration of Competing Interests
The authors declare no conflicts of interests.
Acknowledgment
Authors gratefully acknowledge financial support from the National Key R & D Program of China (2018YFD0901003), China Agricultural Research System (CARS-45-28).

- 食品科学与人类健康(英文)的其它文章
- Moringa oleifera Lam. leaf extract mitigates carbon tetrachloride-mediated hepatic inflammation and apoptosis via targeting oxidative stress and toll-like receptor 4/nuclear factor kappa B pathway in mice
- Potential of peptides and phytochemicals in attenuating different phases of islet amyloid polypeptide fibrillation for type 2 diabetes management
- Zein as a structural protein in gluten-free systems: an overview
- Spectrum-effect relationship of immunologic activity of Ganoderma lucidum by UPLC-MS/MS and component knock-out method
- A red pomegranate fruit extract-based formula ameliorates anxiety/depression-like behaviors via enhancing serotonin (5-HT) synthesis in C57BL/6 male mice
- Purification, characterization and hypoglycemic activity of glycoproteins obtained from pea (Pisum sativum L.)