Spectrum-effect relationship of immunologic activity of Ganoderma lucidum by UPLC-MS/MS and component knock-out method
Chngqin Li, Yiping Cui, Jie Lu, Lijun Meng, Chngyng M,b,c,Zhenhu Liu,b,c,*, Yn Zhng*, Wenyi Kng,b,c,*
a National R & D Center for Edible Fungus Processing Technology, Henan University, Kaifeng 475004, China
b Functional Food Engineering Technology Research Center, Henan Province, Kaifeng, 475004, China
c Joint International Research Laboratory of Food & Medicine Resource Function, Henan Province, Henan University, Kaifeng 475004, China
d Hebei Food Inspection and Research Institute, Shijiazhuang 050091, China
Keywords:
Ganoderma lucidum
RAW 264.7 cell
Spectrum-effect relationships
Component knock-out
BP neural network
ABSTRACT
This study was designed to elucidate the immunoregulation of Ganoderma lucidum. HPLC fingerprint and spectrum-effect relationship of G. lucidum were established to predict the active compounds and BP neural network model was established to predict the efficacy. Then the target compounds were identified by high resolution mass spectrometry. The results indicated that there are both enhanced immunity and immunosuppressive components in G. lucidum. BP neural network was trained with the common peak area and immune efficacy index of G. lucidum fingerprint as samples, and a combined evaluation system of G.lucidum fingerprint efficacy was established. The correlation coefficient R of BP network model was 0.986 43,and the error of pharmacodynamic prediction results was in the ideal range. Eight compounds were identified by high resolution mass spectrometry. The compounds related to immune activity in G. lucidum were determined in this study.
1. Introduction
The dry fruiting body of Ganoderma lucidum (Curtis: Fr.) P.Karst, has been used for over 1000 years as food and traditional Chinese medicine (TCM) [1,2]. G. lucidum is a widely used as a dietary supplement and medicinal herb in China and other eastern countries [3]. It is one of the most highly used medicinal fungi around the world [3]. In the past, Lingzhi is regard as an elixir of life for the promotion of health and longevity [4]. It has a wide variety of biological activities, including anti-microbial [5], immunemodulating [6-8], anti-cancer [9-11], anti-inflammatory [12], antioxidant [13,14] and hypoglycemic [15]. At present, G. lucidum has been used in preventing and treating various diseases, such as cancer[16,17], hepatopathy [18], hypertersion [19] and diabetes [20,21]. The treatment of various diseases are due to various active compounds,such as triterpenes, polysaccharides, sterols, alkaloids, nucleotides,proteins and lectins [22,23].
To date, over 150 triterpenoids have been isolated and identified from G. lucidum, such as ganoderic acids A, B, C D, and AM1 [24] as the main medicinal components [25-28]. So, these triterpenoids are used as representative components to evaluate the quality of G. lucidum.
The therapeutic effects of TCM are based on the complex interactions of complicated chemical constituents as a whole system, so methods are needed to control the quality of the complex system [29]. In this case, HPLC fingerprints of key components provide a new approach for quality control of TCM. The advanced stage of fingerprints analysis is used to correlate the fingerprints of characteristic peaks with the results of pharmacodynamics by mathematical statistics and analysis, so as to clarify the material basis of the efficacy of TCM and establish an evaluation method that truly reflects the inherent quality of TCM [30].
In this paper, the accuracy of spectrum-effect relationship was established to reveal the interaction between the active components of enhancing immunity inG. lucidum. The key chromatographic peaks were identified by high-resolution liquid mass spectrometry, and the components of enhancing immunity were determined as the active index compounds inG. lucidum, which might improve the quality standard ofG. lucidum.
2. Materials and methods
2.1 Materials
The LC-20AT high performance liquid chromatography system(Shimadzu, Kyoto, Japan) was used in this study, which equipped with a degasser, a quaternary gradient low pressure pump, the CTO-20A column oven, SPD-M20AUV-detector, an SIL-20A auto sampler. The mass spectrometer contained Q-Exactive four stage rodorbit trap LC-MS/MS system which purchased from Thermo Fisher Scientific (Waltham, MA, USA) and Thermo Ultimate 3000 UHPLC system was applied.
Acetonitrile was chromatographic grade. Glacial acetic acid was analytical grade. The pure water was purchased from Hangzhou Wahaha Baili Food Co., Ltd., (Hangzhou, China).
Dulbecco’s modified eagle’s medium (DMEM) and neutral red were purchased from Solarbio (Beijing, China). Fetal bovine serum(FBS) was purchased from Gibco (Grand Island, NY, USA). MTT:1 × 10⁴cells/well. Nitric oxide (NO), ELISA:MTT: 1 × 10⁵cells/well.
2.2 Plant materials
Fourteen batches ofG. lucidumwere collected and listed in Table 1. All of the samples were identified by Professor Changqin Li(Joint International Research Laboratory of Medicine & Food, Henan Province, Henan University).
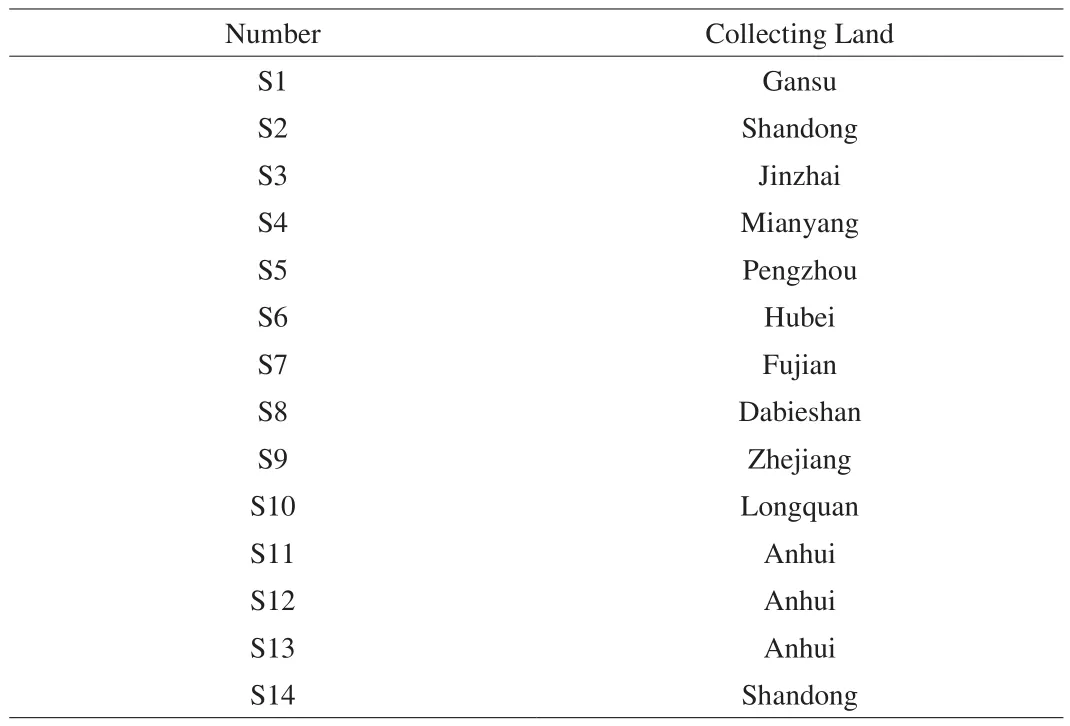
Table 1Information about the collected G. lucidum.
2.3 Extraction
The 14 batches ofG. lucidumwere crushed, and 20 times amount of 95% ethanol (m/V) was added and extracted by maceration for three times, 72, 72, and 72 h. The filtrates were dried, and then methanol solution was added to get the concentration of 2 g/mL equivalent to the amount of raw medicinal herbs.
2.4 HPLC analysis
Chromatographic conditions were set as follows: separation column, Agilent Eclipse XDB-C18(4.6 mm × 250 mm, 5 μm). The mobile phase was a mixture of acetonitrile (A) and 0.04% acetic acid water (B). The flow rate was set at 0.8 mL/min and the column temperature was 25 °C. The UV detection wavelength was set at 254 nm with the sample volume of 10 μL. The gradient elution steps were set as shown in Table 2. All of the solutions were filtered through the 0.22 μm microporous membrane before they were injected into the HPLC system. The HPLC chromatograms of the sample extract were shown in Fig. 1.

Table 2The time program of gradient elution (A, acetonitrile, B, 0.04% acetic acid water).

Fig. 1 Chromatogram of ethanol extract of Ganoderma lucidum.
2.5 NO determination
Cells/well cultured in a carbon dioxide cell incubator for 24 h, then the supernatant liquid was discarded. 200 μg/mLG. lucidumextract was added, the blank control group was added with complete culture solution, and the positive control group was added with 1 μg/mL LPS. After 24 h, the supernatant liquid was collected. The content of NO was measured in accordance with the NO kit instructions.
2.6 Knock-out method
According to the condition of section 2.4,G. lucidumextract was prepared at 0.5 g/mL equivalent to raw medicinal herbs. Injection volume was 25 μL every time. The chromatogram at 254 nm was recorded. The eluent solution of the target component and negative solution without the target component were collected according to the peak retention time from the spectrum-effect relationship analysis, respectively. Each component was prepared and eluted in a 5-fold series. Target component solution and negative solution were combined, respectively dissolved with 0.5 mL of methanol,and filtered through 0.22 μm microporous membrane. The filtrated solution contained the target component (denoted as Px+) and the corresponding negative sample (denoted as Px-).
2.7 Data analysis
2.7.1 Partial least squares analysis
Chinese traditional medicine chromatographic fingerprint similarity evaluation system (2004, 1.0 A Edition) was used to quantitatively determine the chromatographic peaks. DPS7.05 analysis software was used, the partial least squares regression equation was established. UPLC-MS/MS was used for identification of the 46 peaks.
2.7.2 BP neural network model
Artificial neural network (ANNs) is an information processing system based on simulating brain function, which can simulate and predict data information quickly and accurately [31]. BP neural network is the most typical in nonlinear function fitting [32]. As long as selecting the appropriate number of neurons in the hidden layer, BP neural network can approach nonlinear function with any precision.Therefore, three-layer neural network was used in this experiment.MATLAB software was used to complete the analysis and modeling of test data.
2.8 Mass spectrometry analysis
Waters BEH C18column (2.1 mm × 50 mm, 1.7 μm; Waters) was the chromatographic column. The mobile phases were acetonitrile(A) and 0.1% formic acid-water (B), with gradient elution as follows:0-5 min, 10% A; 5-30 min, 10%-95% A; 30-55 min, 95% A; 55-56 min,95%-10% A; and, 56-61 min, 10% A. The flow rate was 0.3 mL/min with the injection volume as 0.2 μL.
Compounds were analyzed with the full scan data in negative ion modes with: sheath gas flow rate, 35 arb; auxiliary gas flow rate, 10 arb; spray voltage, 3.5 kV; capillary temperature, 320 °C, a scan range from 50 m/z to 800 m/z, and a resolving power, 70 000. The automatic gain control (AGC) was set at 3e6. The maximum injection time was 50 ms with the isolation window of 4.0 m/z. Collision energy was set at 30 eV.
3. Results and discussion
3.1 Spectrum-effect relationships
3.1.1 Quantitative determination of chromatographic peaks
HPLC has the characteristics of high separation efficiency,detection sensitivity, fast analysis speed, high selectivity and wide application. So, most of the components of TCM can be detected and analyzed by HPLC [33,34].
The chromatographic profile must be representative of all the samples and have the features of integrity and fuzziness. By analyzing the mutual pattern of chromatograms, the identification and authentication of the samples can be conducted well even if the amounts of some chemical constituents are different from the others.
Chinese traditional medicine chromatographic fingerprint similarity evaluation system (2004, 1.0 A Edition) was used to quantitatively determine the chromatographic peaks. Multi-point correction of chromatographic peak position was performed based on chromatographic peaks. A contrast chromatogram was generated by the average method.The matching chromatograms were shown in Fig. 2.

Fig. 2 Overlaid HPLC chromatograms of samples from No. S1-S14. The common pattern (marked R) was obtained by Similarity Evaluation System(SES) for chromatographic fingerprint.
The conclusion can be drawn from the results that the similarities of different chromatograms compared with the common pattern were all above 0.800 except for samples S2, S13, S14 which indicated that the chemical constituents of different samples were not influenced highly by sources. The common pattern was a very positive identification for the samples of G. lucidum. Chromatographic fingerprints were obtained by calibration of the common peaks in each batch of samples, so they have integrity and fuzziness. There are some differences in the area of common peaks in each batch of samples, so the similarity of each batch of samples is not completely equal. However, the fingerprints could not identify each compound in the sample, and the differences of compounds in each batch of samples may also lead to the difference of their activity.
3.1.2 Immune activity of G. lucidum
The effective information of pharmacodynamics was obtained by in vitro or in vivo experimental models [35]. Macrophages played an important role in innate immunity. When the body’s immunity was low, foreign drugs were needed to stimulate innate and acquired immune responses. RAW264.7 cells were selected as the immunological research model because RAW264.7 cells could stimulate the immune response of macrophages in vivo when cultured in vitro [36].
As can be seen in Fig. 3, compared with the blank control group, the positive control group LPS significantly increased the ability of RAW264.7 cells to release NO (P < 0.001). The extracts of S1, S2, S3, S4, S5, S6, S9, S11 and S12 from G.lucidum could significantly increase the NO content released by RAW264.7 cells at a concentration of 200 μg/mL, thereby improving the immune regulatory function of macrophages, with significant difference (P < 0.001).
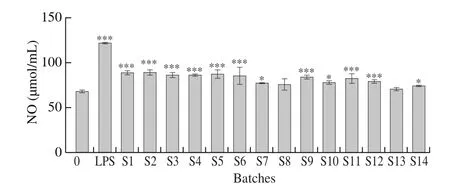
Fig. 3 The NO content released by RAW264.7 cells of 14 batches of G.lucidum extracts.
3.1.3 Regression equation of partial least squares regression analysis
The data processing methods including principal component analysis (PCA), canonical correlation analysis (CCA), partial least squares regression analysis (PLSR), and grey relational analysis (GRDA)were most commonly used [37]. The PLSR method can contain all the original fingerprint peaks, of which, the information about the reaction is more comprehensive, so PLSR is practical and stable [38].
In this paper, the areas of quantitative chromatographic peaks were set as the independent variable (X), the NO content released by RAW264.7 cells was taken as the dependent variable (Y). Then,DPS 7.05 statistical software was used for the mean of the data processing and the partial least squares regression analysis. The result showed that when the potential factor reached 12, the R2reached the maximum, and the variance of the explanatory variable was 91.18%.The regression equation was expressed as follows:
Y1= 0.000 004 - 0.083 151 X1+ 0.067 035 X2- 0.123 265 X3+0.044 384 X4+ 0.045 917 X5- 0.030 222 X6+ 0.164 025 X7+0.165 882 X8- 0.061 226 X9+ 0.034 383 X10+ 0.086 202 X11+ 0.051 931 X12+0.141 340 X13+ 0.098 068 X14+ 0.009 592 X15- 0.012 099 X16+0.096 936 X17- 0.057 032 X18- 0.026 833 X19+ 0.033 800 X20-0.006 073 X21+ 0.171 578 X22+ 0.093 082 X23- 0.034 106 X24-0.028 456 X25+ 0.137 400 X26- 0.058 857 X27+ 0.153 285 X28-0.050 018 X29- 0.088 001 X30+ 0.133 299 X31+ 0.258 026 X32+0.088 658 X33- 0.128 820 X34+ 0.027 552 X35- 0.012 998 X36+0.035 003 X37- 0.072 021 X38- 0.143 370 X39- 0.063 029 X40+0.132 375 X41- 0.027 121 X42- 0.105 959 X43+ 0.061 666 X44+0.104 796 X45- 0.042 625 X46
The regression coefficients of the partial least squares regression equation was shown in Fig. 4. P7, P8, P13, P14, P17, P22, P23, P26,P28, P31, P32, P33, P41 and P45 were positively correlated with enhanced immune activity. P3, P34, P39 and P43 were negatively correlated with enhanced immune activity.

Fig. 4 Standardization regression coefficients of PLSR equations of G. lucidum.
3.1.4 ANN model development
The traditional multivariate statistical modeling methods can not reflect the complex nonlinear relationship between the spectrum effects of TCM. So it is difficult to accurately predict the efficacy of TCM. Therefore, it could not evaluate the internal quality of TCM.BP neural network can deal with nonlinear, fuzzy, random, low precision and large flux information. Its nonlinear fitting ability can solve the problems of complex pattern recognition, such as unclear knowledge background and unclear reasoning rules. Therefore,BP neural network is used to correlate the fingerprint of complex compounds with biological activity in this study, to further clarify the spectral efficiency relationship.
Li et al. [39] established the neural network model of the antiulcer effect of Qizhiweitong granule with the 20 peak areas as input items, which determining the peak area of the target component can calculate the efficacy result of the component. Through the establishment of spectrum-effect relationship, two different drug evaluation models were integrated to achieve the comprehensive evaluation of the TCM from different aspects. Wang et al. [40]established the correlation between the chromatographic data of 57 samples and their antioxidant activities and hyaluronidase activity data by PLS firstly, then BP neural network was used to further clarify the spectral efficiency relationship.
In this study, BP neural network was trained by APP neural net fitting, which was the toolbox of MATLAB. The network model was calculated automatically by standardizing the input data and output data, with setting them to the format specified in the toolbox. The Levenberg-Marquardt back-propagation algorithm “trainlm” was used for the network. The experimental data were randomly divided into three categories (70% for training, 15% for testing, and 15%for verification) and then used to develop a neural network model.The input variables were the peak area of 46 common peaks in the fingerprint. The evaluation index of immune efficacy value was used as an output variable.
When the number of hidden layer nodes is 12, the trained model has the minimum mean squared error (MSE) and the maximum correlation coefficient (R). Therefore, 12 neurons were selected for the optimal performance of neural network model. In Fig. 5, the plotting of MSE versus the epochs number for optimal ANN models was presented. Fig. 6 illustrated a comparison between experimental and predicted results for the fitting in the different stages by the optimum number of hidden layer nodes. The R of the line representing the fitting goodness between the model and the experimental data was 0.986 43. These results showed that the BP neural network model has high prediction accuracy and good generalization ability, which can be used for the prediction of immune efficacy value.

Fig. 5 MSE versus the number of epochs.

Fig. 6 BP neural network model parameters.
The trained neural network was used to simulate the data of immune efficacy, which are shown in Table 3. In Table 3, the prediction results was less than 8.36%, which fully showed that BP neural network model could predict the immune efficacy value according to chromatographic fingerprint. It indicated that BP neural network model can evaluate the efficacy ofGanodermaby measuring its chromatographic fingerprint.
BP neural network can not only consider the change of quantity,but also fully consider the relationship and interaction between variables when analyzing the spectral efficiency relationship.Therefore, BP neural network has better fitting ability and prediction ability for the nonlinear mapping model of chemical information and pharmacodynamics of fingerprint in spectral efficiency relationship.
However, there were some errors between the predicted value and the actual value of the neural network. The sample values used for network training and prediction were given by experiments, which inevitably led to measurement errors. The training sample size was small and the data distribution was uneven, so it had a great influence on the prediction. The network itself could not accurately reflect the complex pharmacological process.

Table 3The predicted results of BP neural network model.
3.2 Identification of the compounds present
3.2.1 HPLC chromatogram of knock-out components and negative samples
The target components and negative samples were prepared by high performance liquid chromatography in Fig. 7. The purity of each target component was higher than 80% and the separation was good.The negative sample did not contain the target component.
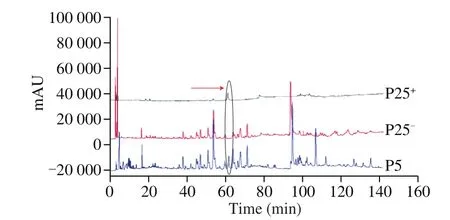
Fig. 7 HPLC chromatogram of ethanol extract of G. lucidum; a component(PX+) and negative samples (PX-) HPLC chromatogram.
3.2.2. Component identification
Compared with the negative ion model, the positive ion model is more suitable for the identification of compounds inG. lucidum.The structure and decomposition pathway of the compound were determined by high resolution mass spectrometry analysis of knockout components and the comparison data of molecular ion peaks and ion fragments in reference [3-5, 41-44]. The detailed results are shown in the Table 4 and Fig. 8.
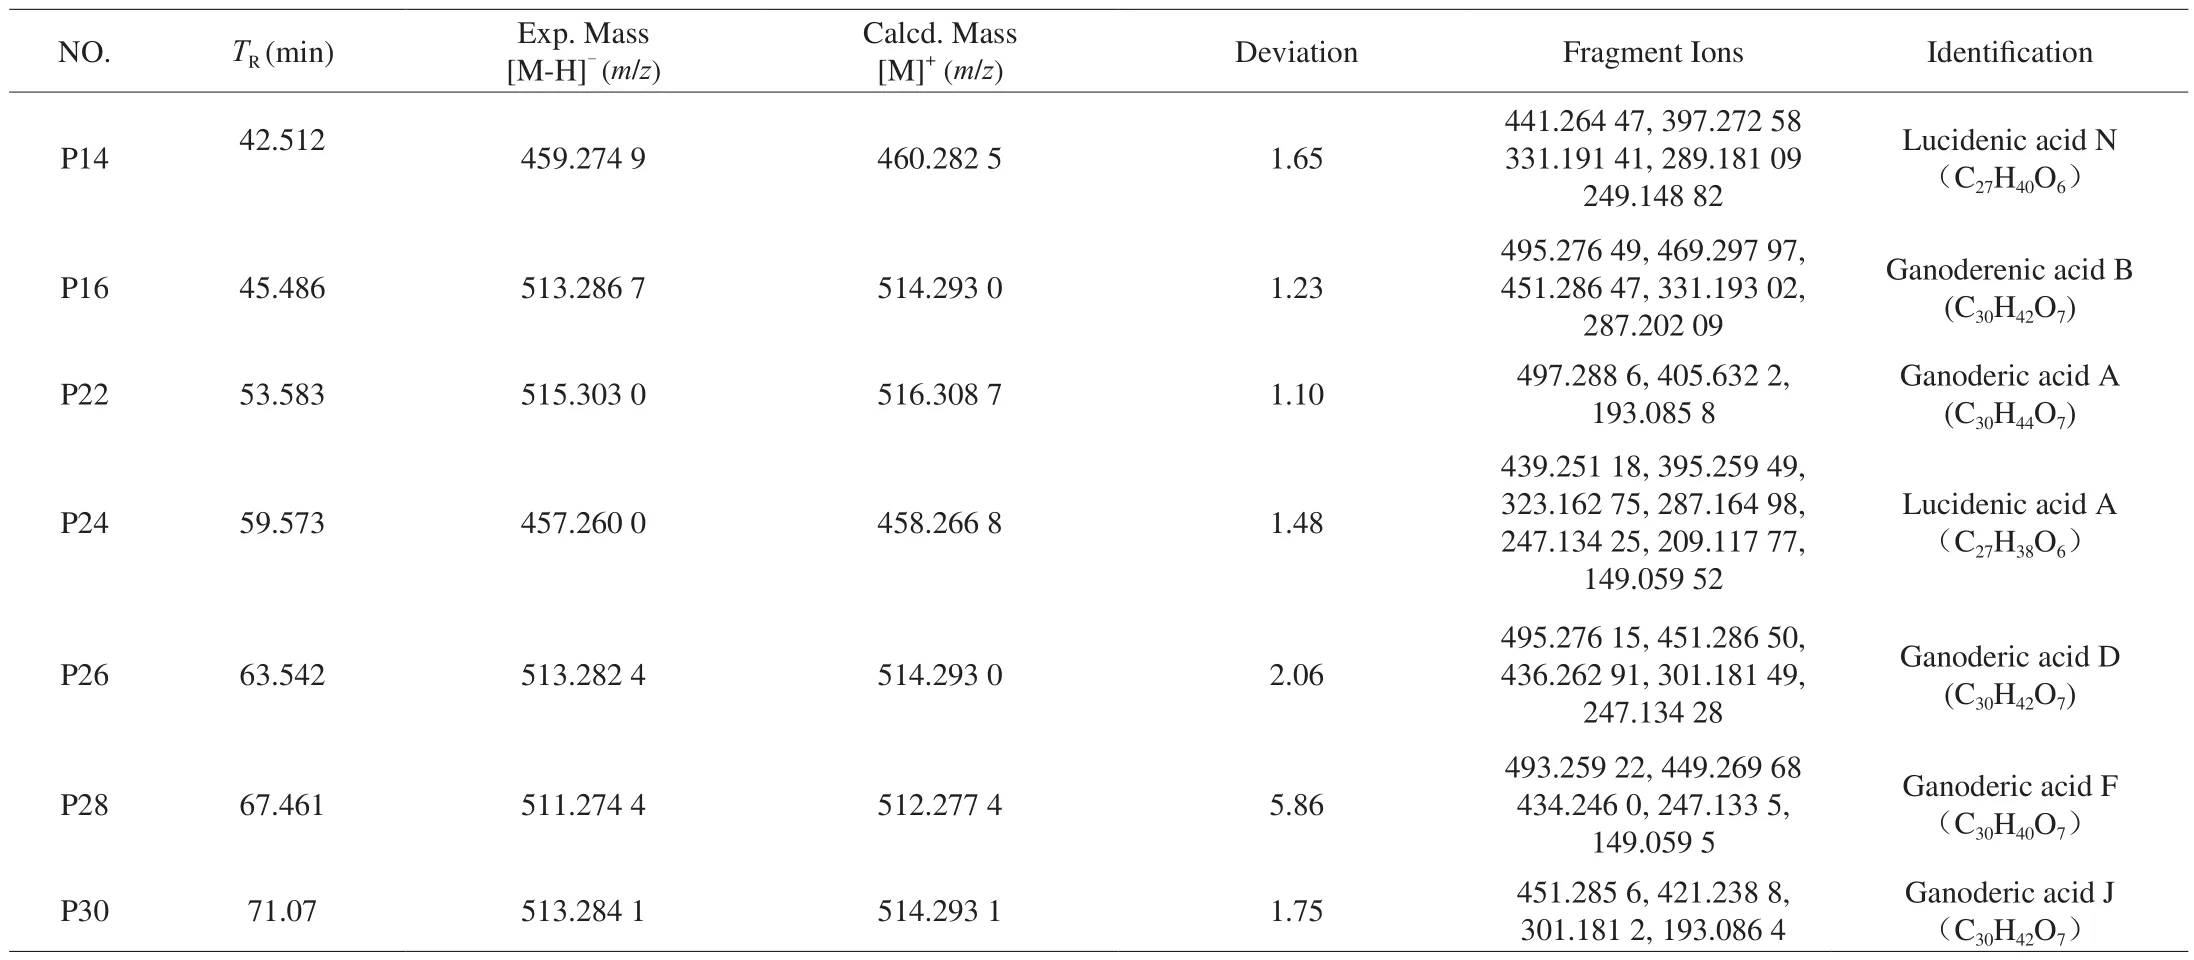
Table 4The UPLC-MS/MS data and identification of the 8 peaks.
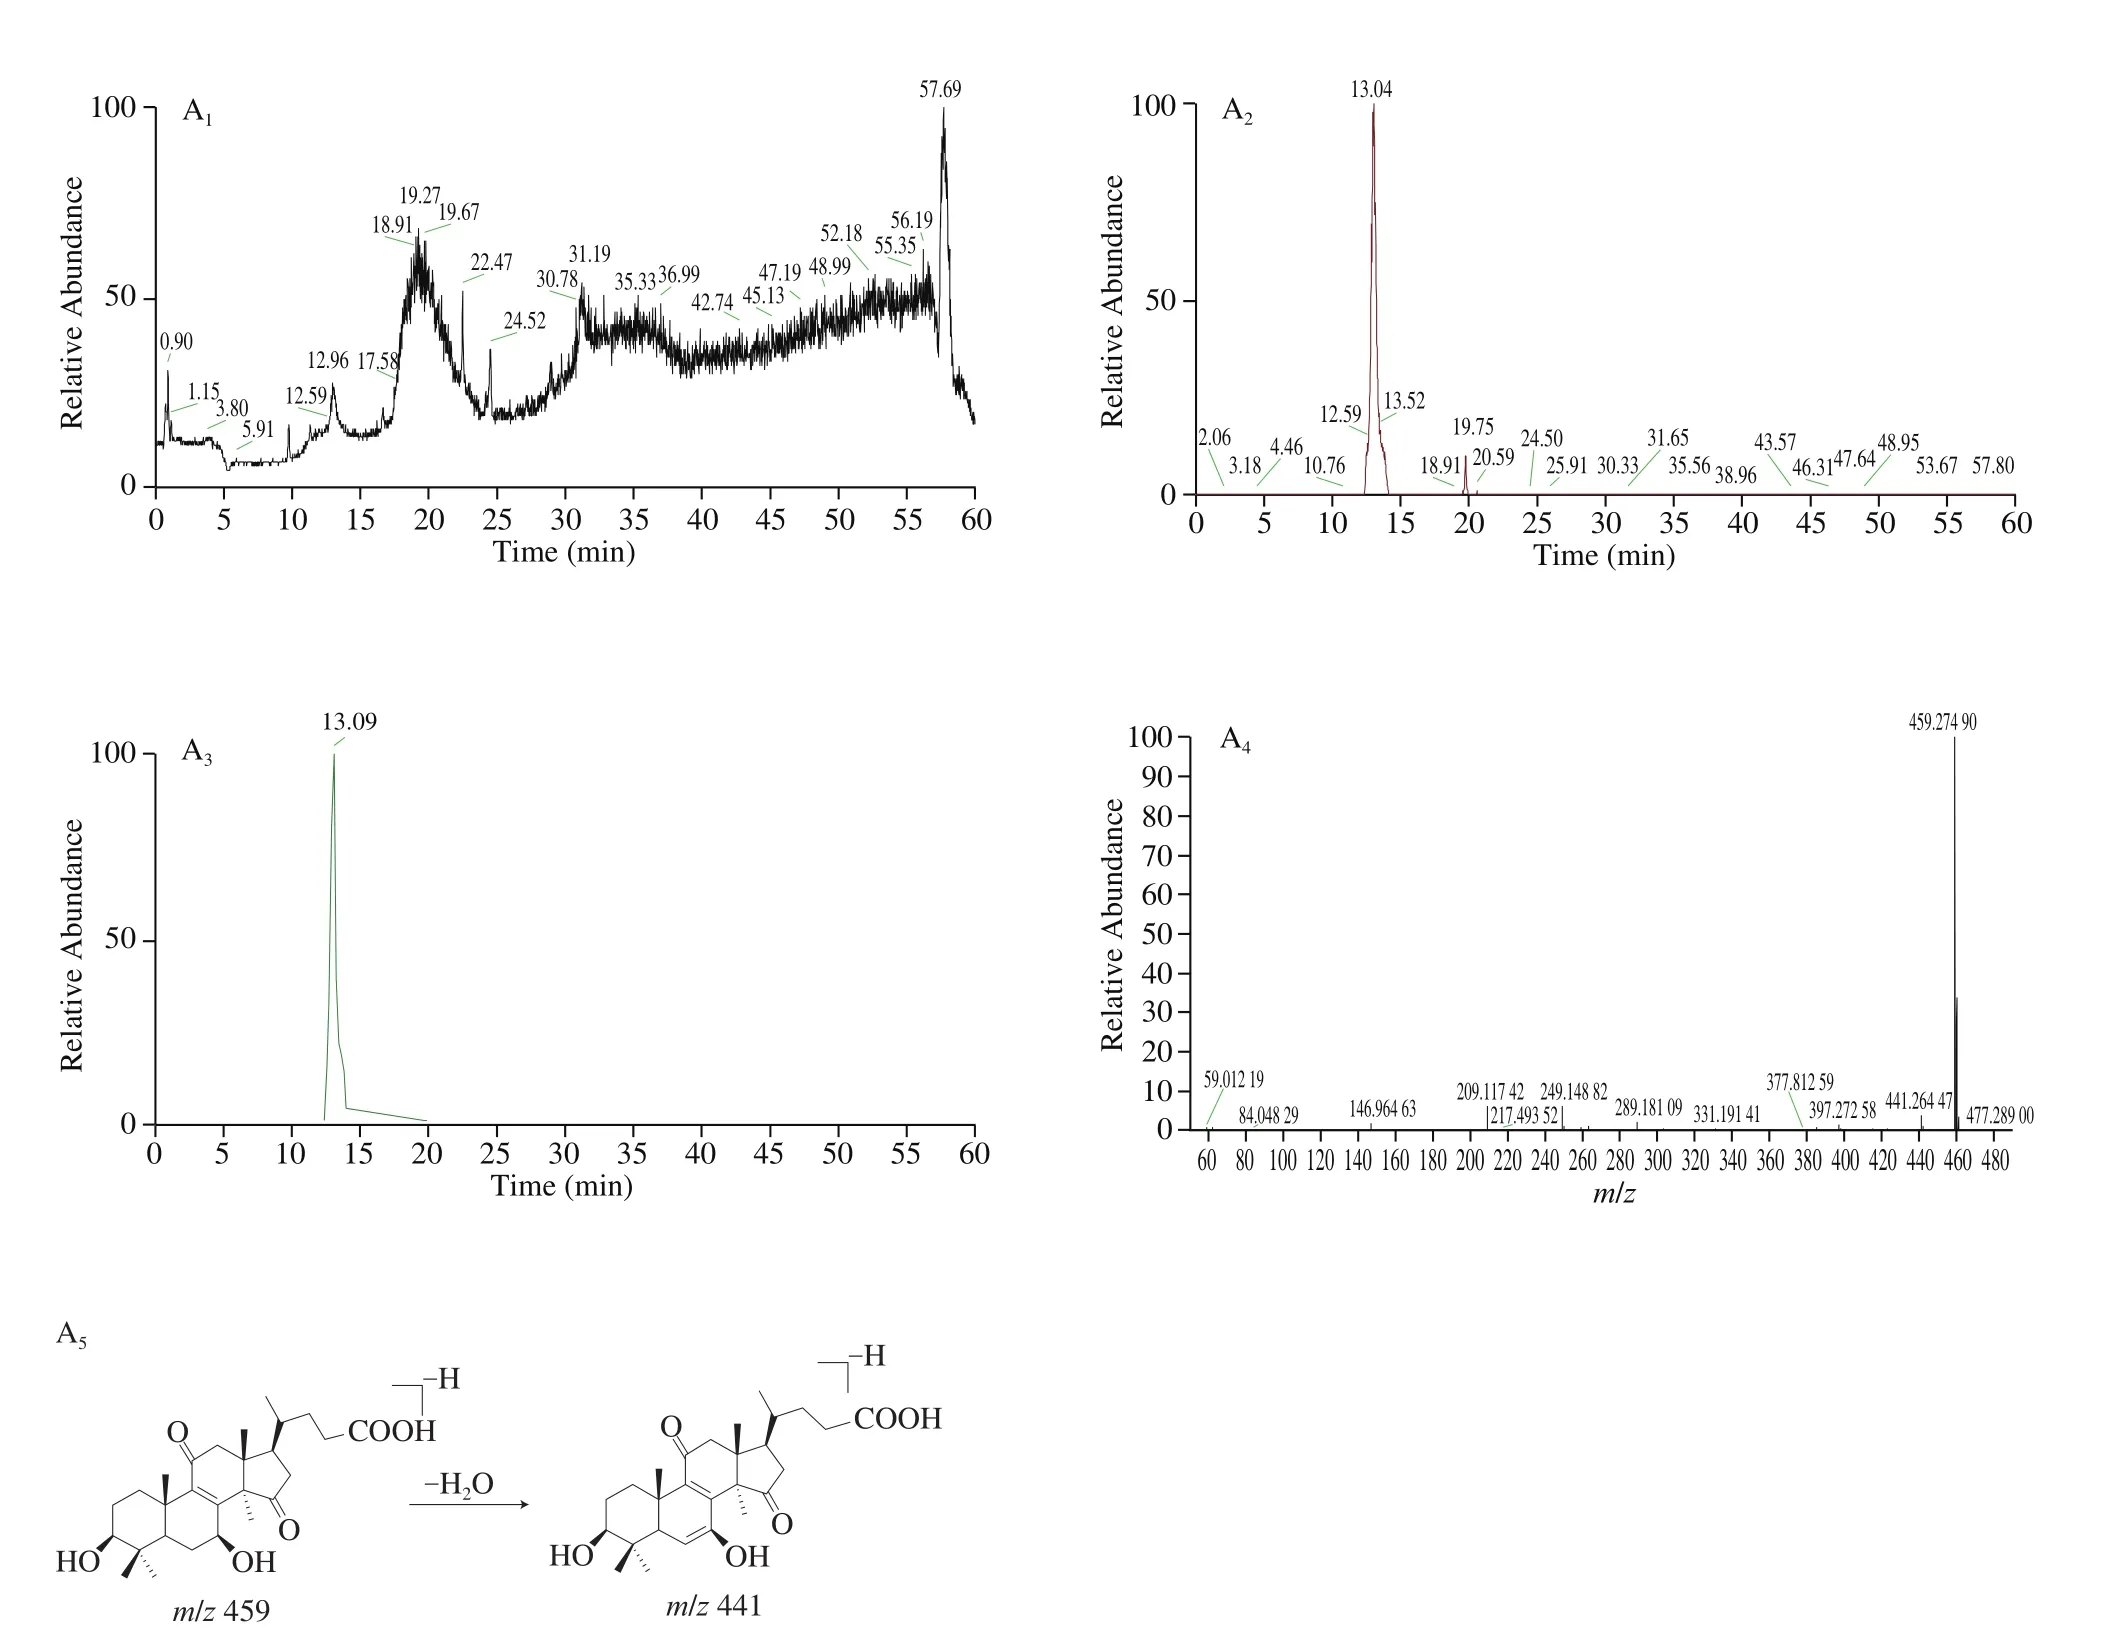
Fig. 8 The knocked-out components and proposed fragmentation pathways of (a) Lucidenic acid N, (b) Ganoderenic acid B, (c) Ganoderic acid A, (d) Lucidenic acid A, (e) Ganoderic acid D, (f) Ganoderic acid J.

Fig. 8. (Continued)

Fig. 8. (Continued)

Fig. 8. (Continued)
3.3 Synergistic/antagonistic effects of knockout components and negative samples on NO production in RAW264.7 cells
In Fig. 9a, the target components of P24, P30, P38, P42, and P43 inhibited the NO content released on RAW264.7 cells, and the negative samples increased the NO content. However, the sum of the NO contents of the target component and the negative sample was higher than that of the original solution. This phenomenon may be due to the presence of components in the negative sample inhibiting NO production in RAW264.7 cells. These components play a synergistic role in inhibiting NO production in RAW264.7 cells.
In Fig. 9b, the target components of P12, P14, P16, P18, P19,P21, P22, P26, P28, P46 and their negative samples could enhance immunity, which was consistent with the original solution. The sum of the NO contents of these target components and the negative sample RAW264.7 cells was higher than that of the original solution.It indicated that there might be an antagonistic effect between the target component knocked out and its negative sample.

Fig. 9 Analysis of synergistic (a) and antagonistic (b) effects between knockout components of G. lucidum extract and negative samples.
4. Conclusion
In this paper, spectrum effect relationship of G. lucidum was established by PLSR, and BP neural network was used to establish combination model of spectrum and effect to predict immune efficacy value. Component knock-out and UPLC-MS/MS were used to determine the compounds with immunologic activities. All these clarified the material basis of G. lucidum on immunologic activity.
Finally, P14, P16, P18, P22, P24, P26, P28 and P30 were identified as Lucidenic acid N, Ganoderenic acid B, Ganoderic acid A, Lucidenic acid A, Ganoderic acid D and Ganoderic acid J by high resolution mass spectrometry. When the concentration of the sample was equal to 200 μg/mL of the original medicine, Lucidenic acid N,Ganoderenic acid B, Ganoderic acid A and Ganoderic acid D were the active components in G. lucidum to activate RAW264.7 cells.Lucidenic acid A and Ganoderic acid J were the active components in G. lucidum to inhibit RAW264.7 cells.
BP neural network was trained with the common peak area and immune efficacy index of G. lucidum fingerprint as samples, and a combined evaluation system of G. lucidum fingerprint efficacy was established. The R of BP network model is 0.986 43. The results of pharmacodynamic prediction show that the model is reliable and the errors are in the ideal range. The evaluation system of G. lucidum spectrum-effect combination was established.
conflicts of Interest
All authors declare that there are no conflicts of interest regarding this study.
Acknowledgments
This work was funded by the National Key R&D Program of China (2018YFD0400200), Key Project in Science and Technology Agency of Kaifeng City (1906006), Major Public Welfare Projects in Henan Province (201300110200).
- 食品科学与人类健康(英文)的其它文章
- Moringa oleifera Lam. leaf extract mitigates carbon tetrachloride-mediated hepatic inflammation and apoptosis via targeting oxidative stress and toll-like receptor 4/nuclear factor kappa B pathway in mice
- Potential of peptides and phytochemicals in attenuating different phases of islet amyloid polypeptide fibrillation for type 2 diabetes management
- Zein as a structural protein in gluten-free systems: an overview
- A red pomegranate fruit extract-based formula ameliorates anxiety/depression-like behaviors via enhancing serotonin (5-HT) synthesis in C57BL/6 male mice
- Purification, characterization and hypoglycemic activity of glycoproteins obtained from pea (Pisum sativum L.)
- Effects of filleting methods on composition, gelling properties and aroma pro file of grass carp surimi

