
Pile foundation of high-speed railway undergoing repeated groundwater reductions*
2021-04-15 00:11XuechengBIANLeiFUChuangZHAOYunminCHEN
Xue-cheng BIAN, Lei FU, Chuang ZHAO, Yun-min CHEN
Pile foundation of high-speed railway undergoing repeated groundwater reductions*
Xue-cheng BIAN, Lei FU, Chuang ZHAO†‡, Yun-min CHEN
†E-mail: zhaochuang@zju.edu.cn
Long-pile groups of railway foundation undergo excessive settlements after groundwater reductions, which may exceed the settlement limit and threaten the safe operation of high-speed trains. However, the effect of groundwater reduction on a long-pile group (greater than 20 m in length) has not been fully understood, especially in respect of repeated reductions. In this study, a centrifuge test was conducted to investigate the responses of pile groups in silty soils subjected to repeated falls in the water table. The behavior of the piles was discussed based both on the test and on 3D numerical analyses. With the derived coefficientfor the axial force evaluation of the pile, the effect of lowering the water table on the railway pile foundation could be seen. Results of the tests and numerical analyses indicated that the water table decline significantly increased the down-drag and axial force of the pile, causing significant settlement. A longer pile presented a larger axial force at the neutral point. Nevertheless, the incremental percentage of the axial force decreased with increasing pile length with the same water table reduction. Because of group effect, the displacement of soil next to the center pile was smaller than that near the corner piles and showed a similar trend as the axial force of the pile. As the water table fell, the static load ratio affecting the progress of pile settlement increased disadvantageously, possibly inducing excessive pile settlement. A design method for railway pile foundations taking account of lowering groundwater was proposed with an example application, which provided a reference for similar projects.
High-speed railway; Pile foundation settlement; Centrifuge testing; Numerical modelling; Groundwater declining; Drag load
1 Introduction
To avoid adverse settlement of the foundation of high-speed railway, long-pile groups have been widely constructed in the field, especially in soft soil ground. In China, for the safe operation of trains at speeds close to 350 km/h, the permitted ultimate settlements of ballasted and ballastless tracks are set at 30 mm and 20 mm, respectively (NRA, 2014). Under such strict requirements, any factors that may increase foundation settlement during long-term service need to be carefully addressed. Recently, the threat of a rising water table after persistent heavy rain has attracted the attention of researchers because trains may have to limit speed once large settlements of track occur (Jiang et al., 2015, 2016). On the other hand, massive use of groundwater has induced excessive ground settlements (Zhu et al., 2015) in developed regions, where there is usually a dense high-speed railway network. Field studies have confirmed large-scale settlement of pile foundations caused by lowering groundwater levels (Omer, 2012; Dong et al., 2016). However, the effect of groundwater decline on the responses of long-pile groups has not been fully understood, in particular for piles with a length greater than 20 m.
Groundwater decline induces reconsolidation of soils, which further affects the behavior of piles embedded in those soils. It is similar to the reconsolidation of soil induced by applying an additional load, but different in nature, because the processes of changes and distributions in effective stress differ significantly. The latter has been extensively investigated over the past decades through numerical and experimental approaches. It can cause the axial force of an end-bearing pile to exceed its capacity and can induce large additional settlement in a floating pile (Wong and Teh, 1995; Lee et al., 2002). Moreover, the induced negative skin frictions significantly affect the behavior of the pile foundations (Fellenius, 1972, 2006; Indraratna et al., 1992; Jeong et al., 2014; Hong et al., 2016). In the theoretical analyses, the negative skin friction was conventionally calculated according to elasticity theory and continuous assumption so that slippage between pile and soil caused incorrect evaluations of pile behavior (Teh and Wong, 1995; Lee et al., 2002). Afterwards, a numerical approach considering the slippage was proposed, in which a rational friction model was employed to analyze the pile’s response under additional loads (Lee et al., 2002, 2006; Lee and Ng, 2004; Comodromos and Bareka, 2005; Liu et al., 2012; El-Mossallamy et al., 2013). The results obtained showed that soil consolidation under additional loads caused a negative skin friction, which increased the axial force and pile settlement. The modulus and type of pile, the properties of the soil, and the additional load were the main factors affecting behavior of the pile. As stated earlier, the stress condition caused by additional load is different from that caused by lowering groundwater, whose effect on the pile should be further investigated.
Centrifuge modeling, which can reproduce the in-situ ground stress condition, has been widely used to study the interaction mechanism between soil and pile during consolidation to substitute for costly full-scale model tests and in-situ tests. For example, Ng et al. (2008) conducted centrifuge tests to investigate the variation of negative skin frictions along the pile when an additional load was applied to the ground. The different responses between the center pile and the corner pile were investigated sequentially. Tests and numerical results showed that the skin friction in the pile group was smaller than that on the single pile. Lam et al. (2009) applied axial forces to the end-bearing pile and floating pile in centrifuge tests to investigate their effect on the development of negative skin friction, already induced under the additional load. The results showed that the applied axial forces reduced and even eliminated negative skin friction along the pile. In addition, the critical axial force was associated with the stiffness of the bearing soil layer.
However, most experimental and numerical studies have focused on the responses of the piles subjected to additional loading (Bransby and Springman, 1996, 1997; Jeong et al., 2004, 2009; Wang et al., 2015). Even though some numerical research has been carried out to investigate the behavior of pile and pile group to groundwater fall, there is a grave lack of related experimental studies, especially on long piles greater than 20 m in length, subjected to repeated falls in the water table. For example, Lee and Chen (2003) conducted a single lowering of groundwater in a centrifuge test to investigate the responses of single piles and pile groups (22.5 m in length in the prototype). Negative skin friction was confirmed during the water level lowering, the effect of which on the center pile was smaller than on the external pile. Also, the large spacing of the piles in the pile group affected the amplitudes of the negative skin frictions, indicating a group effect. Nevertheless, a single water table fall is not enough to quantify the development of axial forces of piles as encountered in practice. To deal with repeated groundwater decline, more experimental studies are needed.
This study aims at evaluating the effect of repeated falls of groundwater level on the responses of both single long-pile (40 m) and pile groups (20 m, 30 m, and 40 m), which are then further considered in the design of the pile foundation of the high-speed railway. First, a centrifuge test was conducted in which the water table within a soil sample was lowered three times using a designed water table control system. The centrifuge test was then back analyzed by 3D numerical modeling. The variations of friction and axial forces along the piles and the induced settlements were illustrated for the deformed soils. Through the derived coefficientof the long-pile group, the effect of groundwater lowering on railway pile foundation was quantitatively discussed based on a real case. Afterwards, a design method for railway pile foundations considering both groundwater fall and cyclic train load was proposed.
2 Three-dimensional centrifuge modeling
2.1 Experimental facilities
The centrifuge tests were undertaken at the Geotechnical Centrifuge Facility (GCF) of Zhejiang University, China. The centrifuge shown in Fig. 1a has a payload capacity of 400·t and a radius of 4.5 m from the axis to the base of the swinging platform (Zhou et al., 2019), whereis the gravitational acceleration of the earth. The maximum centrifugal acceleration reaches 150. Therefore, under the target gravitational acceleration, the same weight stress as that of the prototype could be reproduced in the centrifuge test by observing the scaling laws specified in Table 1 (Garnier et al., 2007; Wong et al., 2012). The internal dimensions of the sample container are 700 mm (width)×850 mm (length)×750 mm (depth).
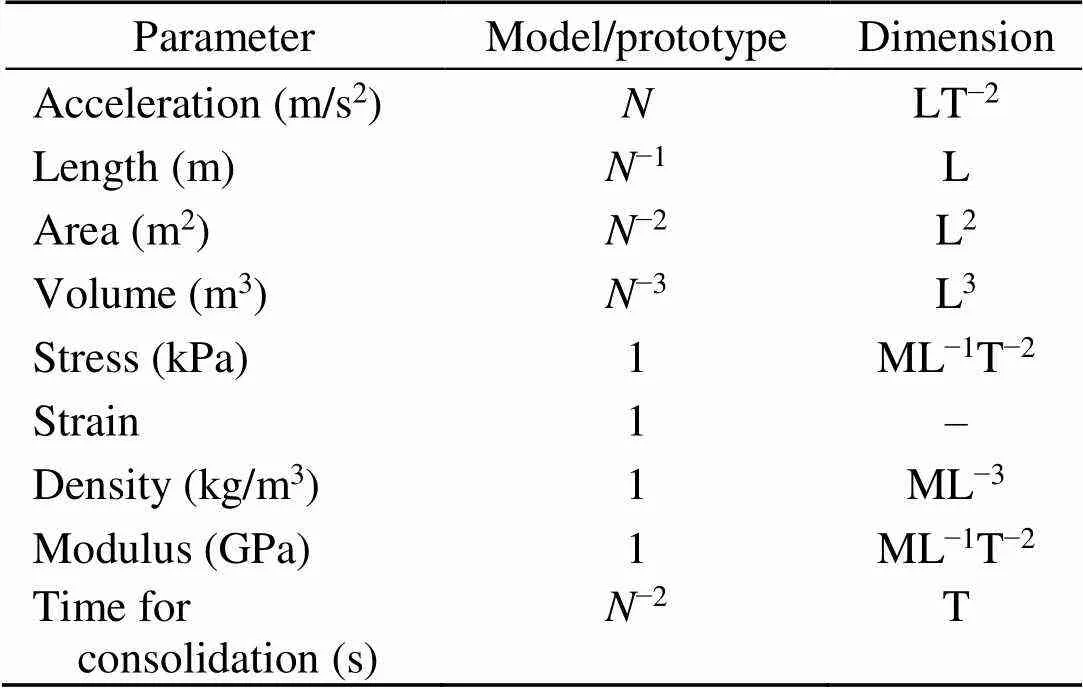
Table 1 Scaling laws related to centrifuge test
: scaling factor; L: dimension of length; T: dimension of time; M: dimension of mass
An apparatus schematically shown in Fig. 1b was designed to adjust the water table in the soil sample. A water tank was linked to the soil sample via a pipe in which a pressure sensor was installed for real-time monitoring of the water pressure. An air pressure sensor was also installed at the top of the tank to continuously measure the water level in the tank. The water table could be regulated as required by smoothly decreasing or increasing the air pressure in the tank, thus adjusting the water pressure equilibrium between the water tank and the soil sample. The inner diameter and the height of the water tank were approximately 30 cm and 70 cm, respectively. Through filling with an appropriate amount of water, the water table in the soil sample could be significantly adjusted.
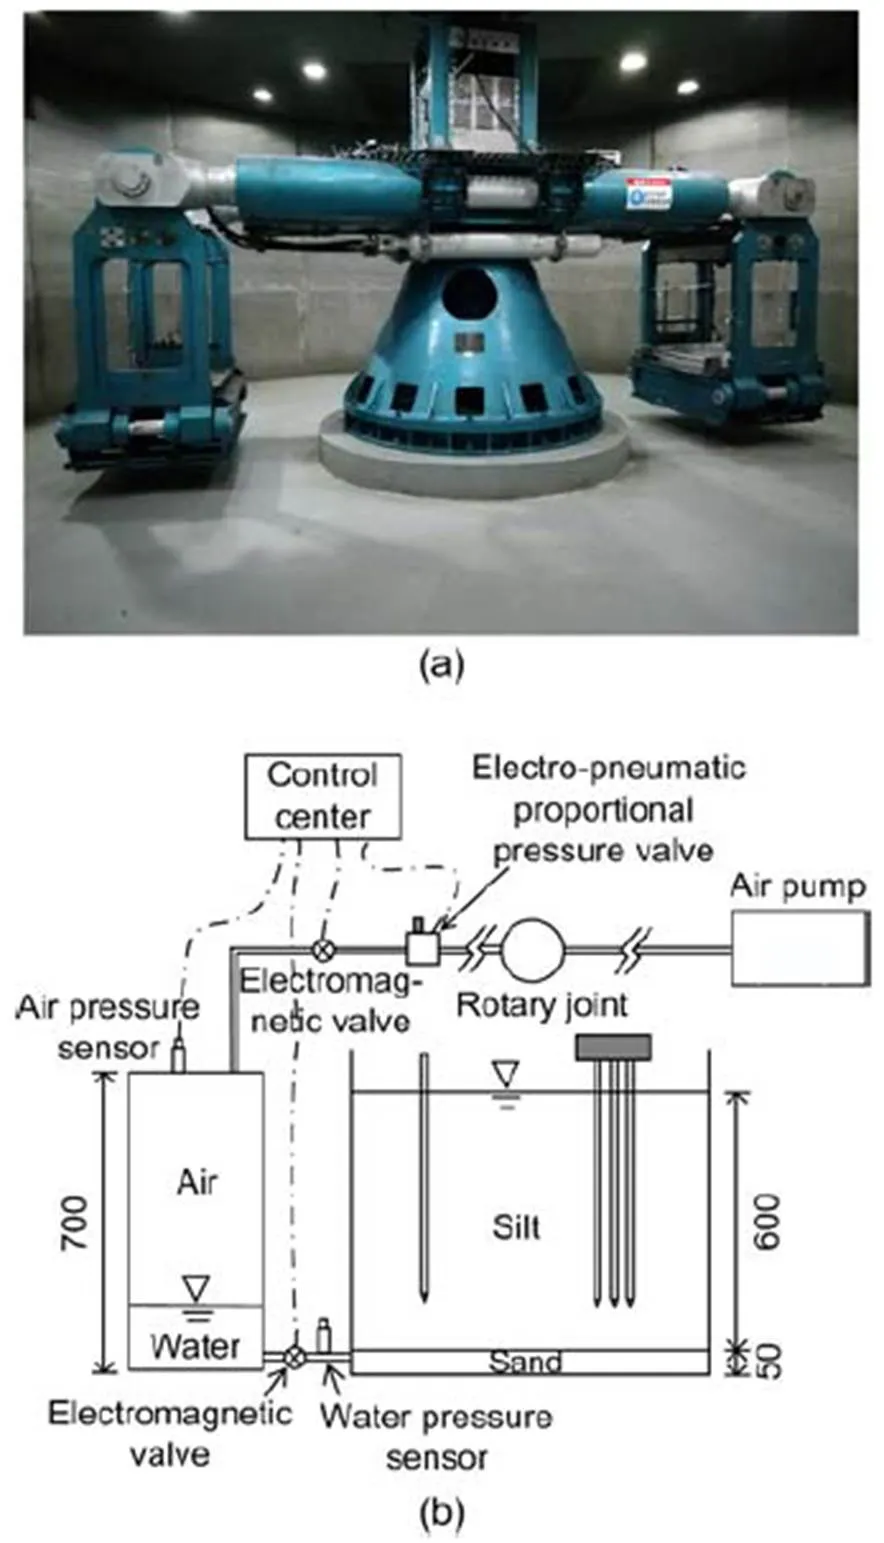
Fig. 1 Photo of centrifuge facility (a) and schematic diagram of water table control system (b) (unit: mm)
2.2 Soil sample preparation
The experimental material used herein was silty soil, originally collected from Qiantang River in Hangzhou, China. According to the test method specified in the standard (SBQTS and MOHURD, 1999), the specific gravity was tested to be 2.68, the liquid limit was 30.8%, the plastic limit was 20.8%, and the plasticity index was 10.
Before sample preparation, a sand layer with a thickness of 50 mm was laid at the bottom of the sample container. The sand was Fujian sand, widely used in China for research purposes (Ishikawa et al., 2015; Wang et al., 2018; Zhu et al., 2019). The sand layer was prepared by sand pluviation in air under a constant drop height to a relative density of 60%, which served as a drainage boundary during sample saturation. Then, an approximately 3 mm thick geotextile sample was used to cover the sand layer and function as a filtration system. Silicon grease was applied to the inside of the sample container to eliminate the friction force between the soil sample and the container. As shown in Fig. 2, the dimensions of the soil sample, excluding the sand layer, were 700 mm (width)×850 mm (length)×600 mm (depth). To prepare a uniform sample, the sample was divided evenly into 12 layers and prepared in sequence. For a dry bulk density of 1.6×10³kg/m3, the weight of each layer was set at 47.6 kg with an initial water content of 6%. Each layer was compacted by a compacting machine and the top layer was smoothly scratched to avoid soil heterogeneity and infiltration during testing. At a target gravitational acceleration of 83, the dimensions of the modeled soil sample were 58.1 m (width)×70.5 m (length)×49.8 m (depth) on a prototype.
After sample preparation, the soil sample was placed in a sealed box as shown in Fig. 3 for saturation. A vacuum of about 80 kPa was applied to the sealed box for almost 24 h. Then, the same vacuum pressure (80 kPa) was applied to a tank filled with de-aired water and connected to the bottom sand layer of the soil sample. The de-aired water gradually flowed into the sample from the bottom to the top, and the air in the soil voids flattened under an appropriate water head. The soil sample was assumed to be fully saturated when water emerged on its surface.
2.3 Model pile preparation
Since this study focused on the effect of falling groundwater on the axial force and pile settlement, the tensile rigidity (EA) of the pile in the centrifuge test must follow the scaling law specified in Table 1 and the following equation:
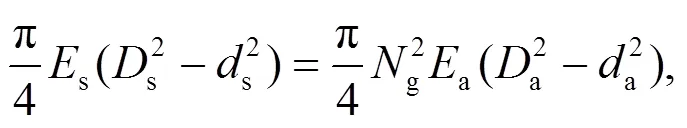
wheregis the gravitational acceleration that was set at 83;sis Young’s modulus of the precast concrete pile of about 30 GPa;sandsare the outer and inner diameters of the concrete pile, 1.2 m and 0.0 m, respectively. This concrete pile was modeled with a hollow aluminum pipe with an outer diameter (a) of 14 mm, an inner diameter (a) of 9 mm, and an elasticity modulus (a) of 68.9 GPa. Moreover, all the pile ends were sealed by conical aluminum alloy blocks.
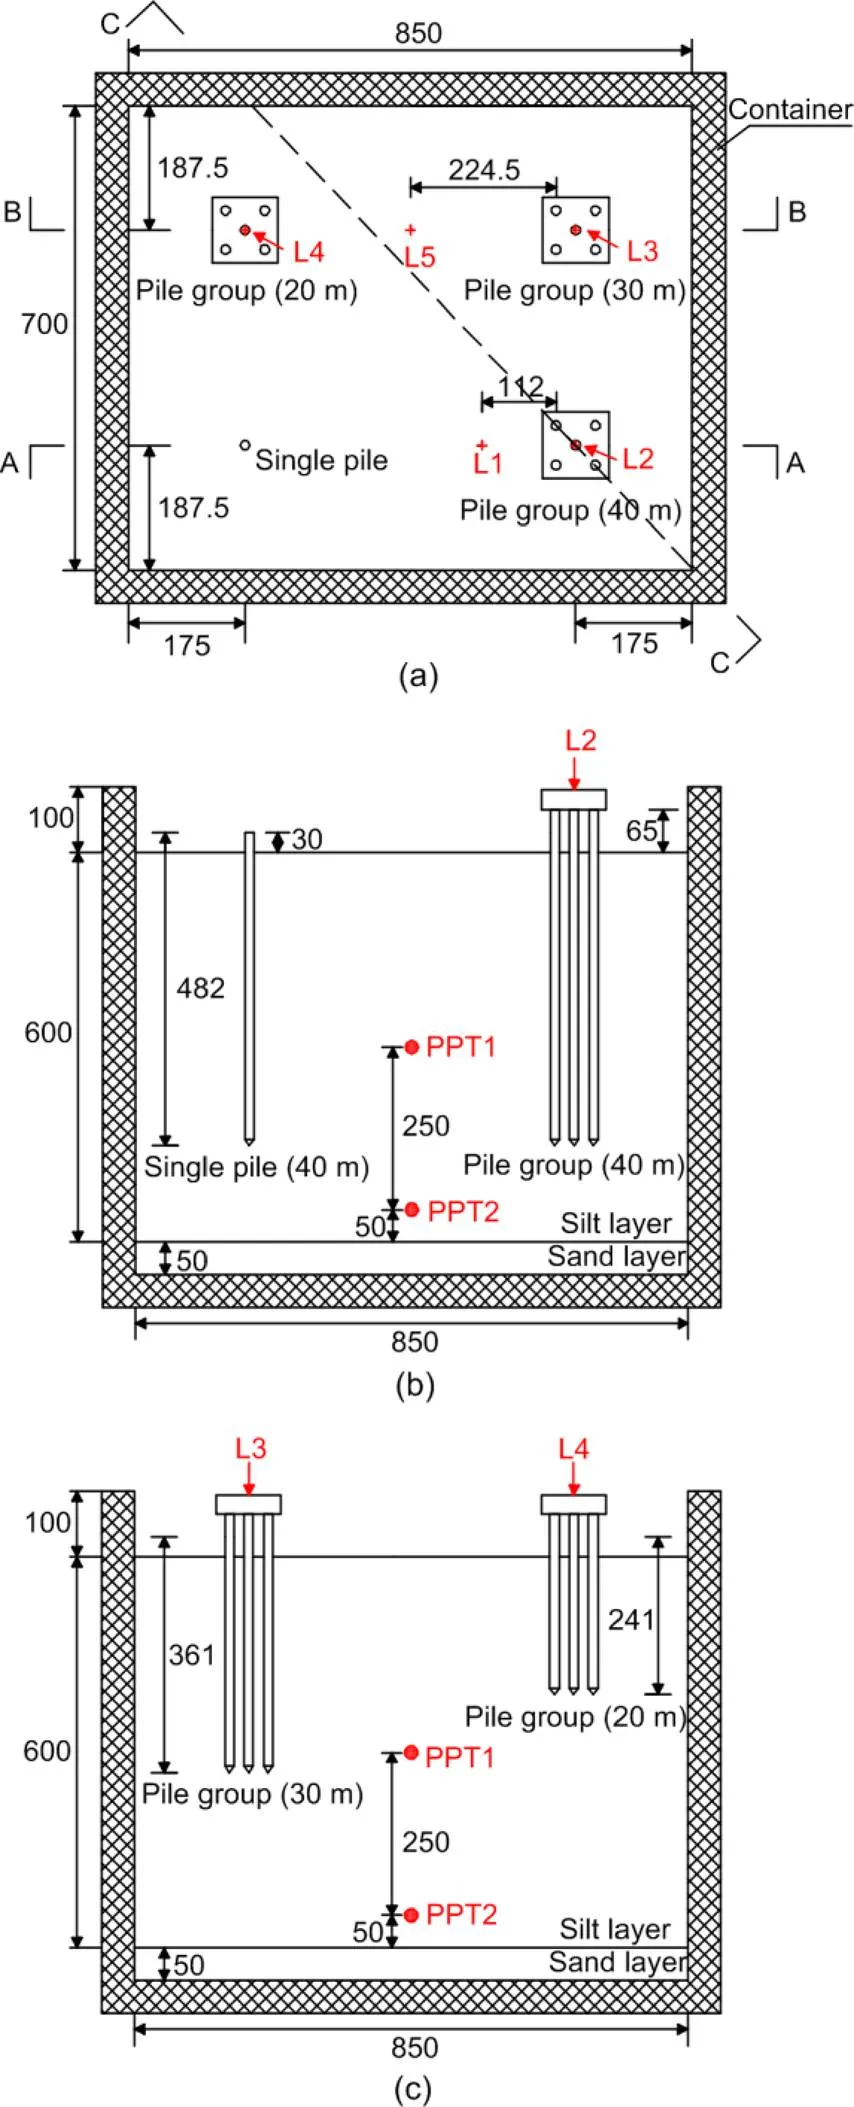
Fig. 2 Schematic diagram of the centrifuge model: (a) top view of the sample; (b) vertical cross section A-A; (c) vertical cross section B-B (unit: mm)
L1–L5 are laser displacement sensors (LDSs); PPT1 and PPT2 are pore pressure transducers
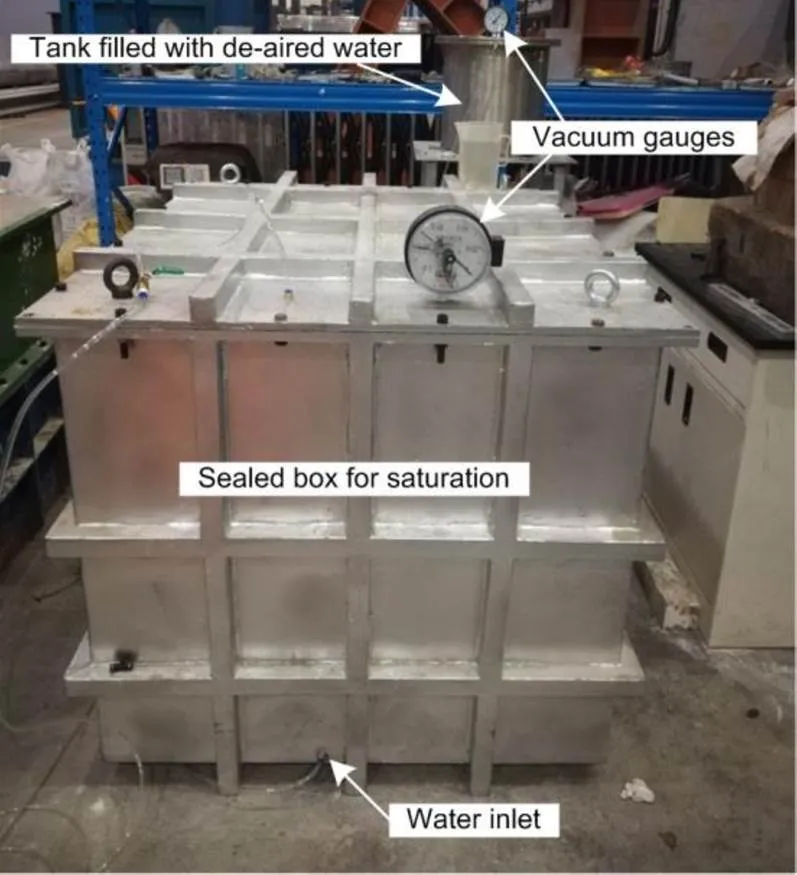
Fig. 3 Sealed box for sample saturation
As shown in Fig. 2, five piles constituted a pile group at 42 mm intervals. These five piles were fixed by a 30-mm thick aluminum cap weighing 483 g. The different piles differed only in length, and remained constant in diameter. Overall, a single pile and three pile groups were penetrated at the specified locations. The length on the model scale was indicated accordingly, and the values in parentheses corresponded to the values on the prototype scale. The distance between the pile and the container boundary was 12 times the pile diameter. Therefore, based on previous study (Chen and Poulos, 1993), the boundary effect was considered negligible. In addition, the minimum distance between the centers of the pile groups was 27 times the pile diameter. As a result, the impact between pile groups was also deemed negligible.
2.4 Instruments
As shown in Fig. 4, to monitor the axial forces six full-bridge strain gauges were secured along each center pile of the 20-m, 30-m, and 40-m pile groups, the 40-m single pile, and the corner pile of the 40-m pile group. All the piles were coated with 1-mm thick epoxy to protect the strain gauges from water and penetration damage. The signal wires of the strain gauges were passed through the sample through the hollow piles. The axial forces of the other piles were not measured.
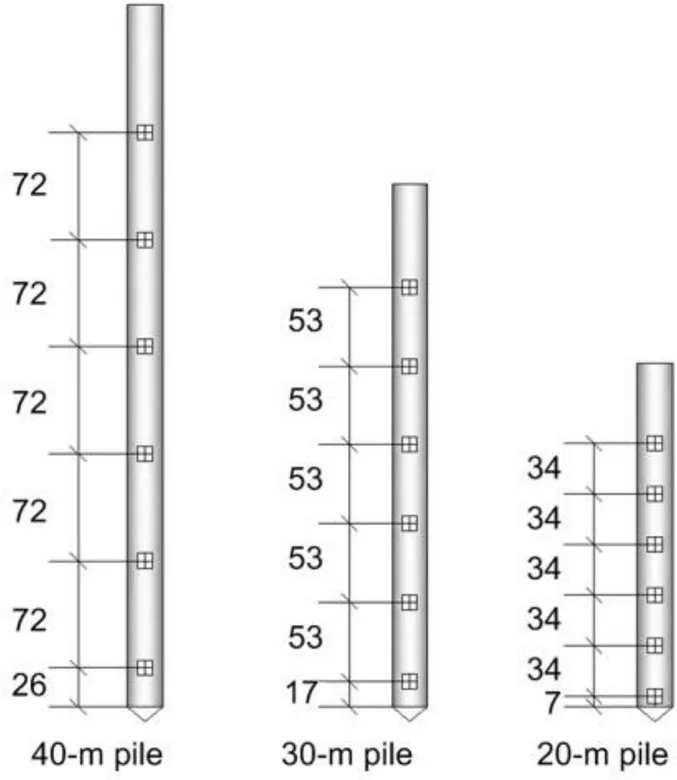
Fig. 4 Schematic diagram of the arrangement of strain gauges (unit: mm)
As shown in Fig. 2, five laser displacement sensors (LDSs) (L1–L5) were used to monitor the settlements of the piles and two positions of the sample surface. These sensors were attached to a reaction frame fixed to the sample container. L1 was placed 96 mm away from the boundary of the 40-m pile group, while L5 was placed halfway between the 20-m and 30-m pile groups. The two pore pressure transducers (PPT1 and PPT2) with capacities of 300 kPa and 700 kPa, respectively, were placed approximately 300 mm and 50 mm perpendicular to the center line of the sample container.
2.5 Test procedure
After sample saturation, the soil sample and container were fixed to the centrifuge basket and spun up to the target gravitational acceleration of 83for consolidation, which was completed when the water pressures monitored by PPT1 and PPT2 became stable. The gravitational acceleration was lowered to 1to install the piles to the specified depths as shown in Fig. 2 by a motor-controlled compression apparatus. Subsequently, the reaction frame and LDSs were installed at the specified positions as shown in Fig. 5. The water tank of the water table control system was also fixed to the centrifuge basket beside the sample container. Before starting the test, the tank was filled with de-aired water to a height of 150 mm. The gravitational acceleration was then increased to 83for reconsolidation to eliminate the influence of pile penetration. Once the water pressures monitored by the PPTs stabilized, 382 kPa air pressure was applied to the water tank to maintain the water pressure at the bottom of the water tank almost equal to that at the bottom of the sample container. Then, the magnetic valve between the water tank and the sample container was opened to balance the possibly unequal pressure. This state was maintained until the readings of PPT1 and PPT2 became constant.
Three stages were designed to periodically reduce the height of the water table by 3 m (prototype scale) during each stage. First, the air pressure in the water tank was lowered smoothly from 382.0 kPa to 296.5 kPa and was maintained until the water pressures stabilized. Then, the air pressure was lowered to 213.7 kPa in the second stage. Similarly, the air pressure was lowered to 132.0 kPa in the third stage. Gravitational acceleration was gradually lowered to 1after the settlements of pile and soil samples reached stable values.
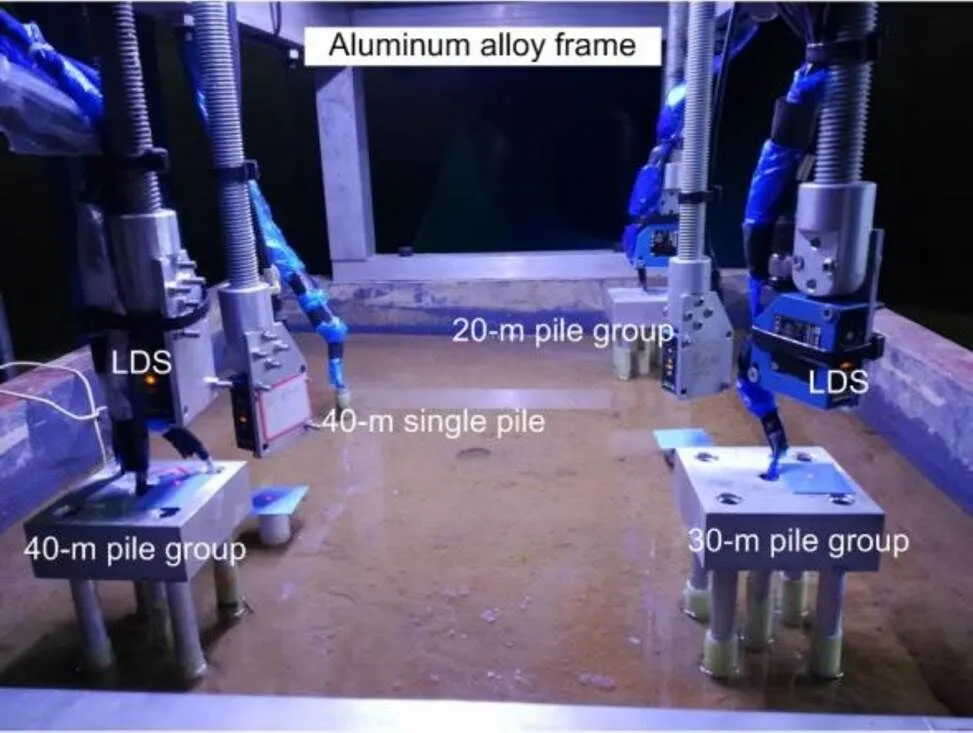
Fig. 5 Overall appearance of the centrifuge model
3 Interpretation of centrifuge test results
In the description that follows, all results are presented on a prototype scale unless otherwise noted.
3.1 Response of pore water pressure
Groundwater level locations were back calculated by monitoring water pressure using PPT1 and PPT2. Fig. 6 shows their time histories, where the horizontal axis represents the elapsed time. Initially, the water pressure increased in proportion to the gravitational acceleration. Also, at the end of the increase in acceleration, an excess pore pressure of about 25 kPa occurred, which rapidly dissipated when the acceleration was maintained. Subsequently, slight fluctuations were observed when the valve between the water tank and the sample container was opened. Because of the large size of the sample, it was difficult to precisely adjust the groundwater table as specified. During each test, pore pressure recovered to some extent after reaching the target values, as pore water flowing during operation consumed a part of the water head. In fact, the water table declined by 3.2 m in the first stage (S1), 3.1 m in the second stage (S2), and 2.6 m in the third stage (S3). It should be noted that the permeability coefficient of silty soil was approximately 1.45×10⁻⁶m/s in the prototype scale, and the averaged drawdown speed in the first stage was about 6.59×10⁻⁷m/s with consideration of the centrifuge scaling law. Under such a condition, the seepage force was quite small compared to the geo-stress. Therefore, its influence on the soil and pile’s behavior was not considered.
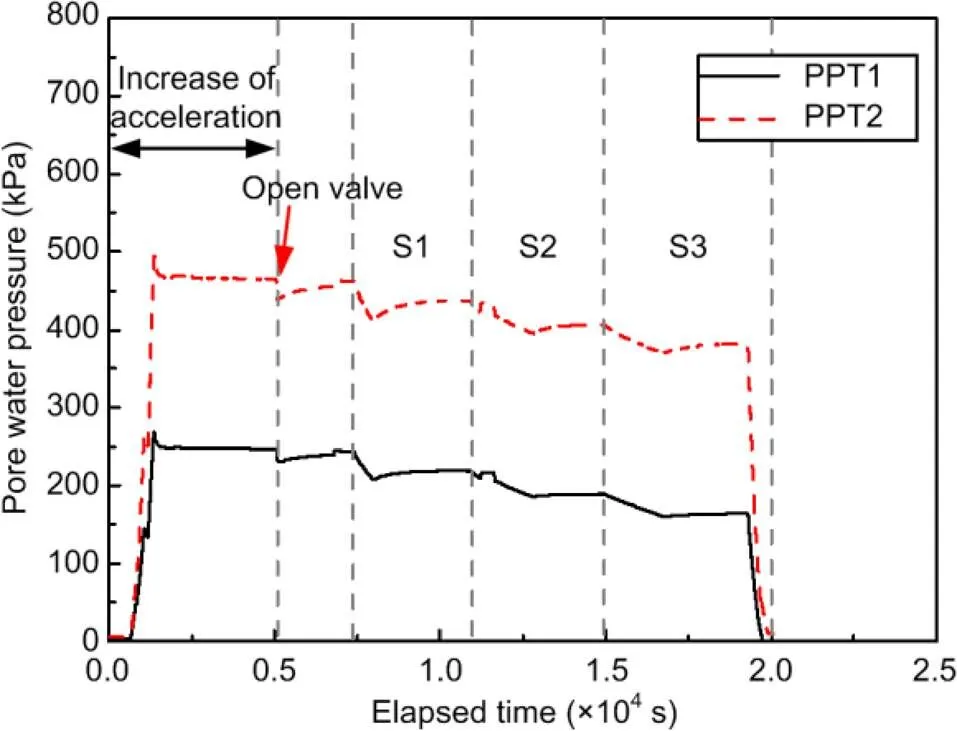
Fig. 6 Time histories of pore water pressure monitored by PPT1 and PPT2
3.2 Pile behavior during groundwater decline
Groundwater lowering increased in response to the effective stress, resulting in foundation settlement. In addition, the downward displacement of the soil relative to the pile and the increase in effective stress caused additional settlement and axial force on the pile. Fig. 7 shows the axial forces monitored along the 40-m single pile, center piles of the 20-m, 30-m, and 40-m pile groups, and the corner pile of the 40-m pile group as the water table fell. From a global viewpoint, a longer pile presented a larger maximum axial force. Moreover, the axial forces gradually increased with the amplitude of the fall. However, the incremental percentage of the maximum axial force decreased as pile length increased. Specifically, after the third stage, the maximum axial forces of the 40-m single pile and the center piles of the 20-m, 30-m, and 40-m pile groups increased by 32.9%, 40.3%, 36.3%, and 27.4%, respectively. In addition, the different behaviors between the 40-m single pile and the center pile of the 40-m pile group confirmed the group effect.
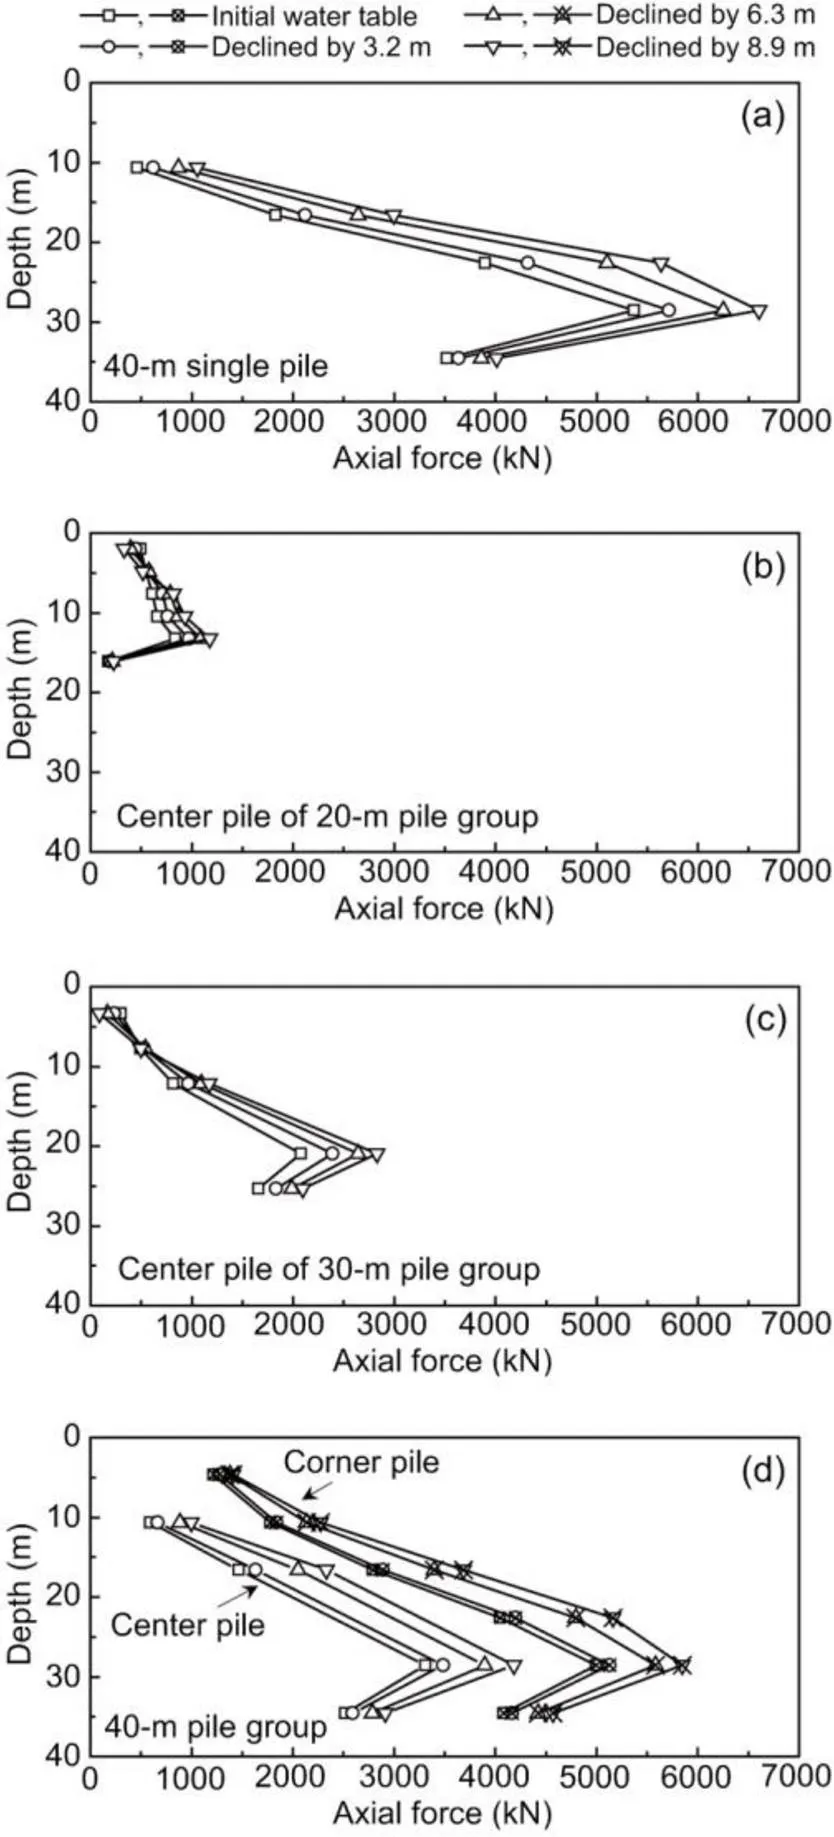
Fig. 7 Axial forces monitored along the piles after groundwater decline: (a) 40-m single pile; (b) 20-m pile group; (c) 30-m pile group; (d) 40-m pile group
Fig. 7d shows a comparison of the axial forces along the center and corner piles in the 40-m pile group. During each period of groundwater decline, the axial forces along the center pile and their increments were always smaller than those along the corner pile. It was probably because, owing to the group effect (Xia et al., 2012), the soil settlements near the corner pile were larger than those near the center pile. Moreover, the tip resistance and skin friction of the pile involved in determining a pile’s axial force were also affected by the variation of effective stress. These factors interacted with each other, eventually resulting in the different axial forces of the center and corner piles (Shen, 2008). In short, the position of a pile in a pile group affects its behavior during groundwater decline. The center pile presents a relatively small drag load.
Settlement is a comprehensive indicator of pile status and is especially important for the safety of high-speed railway. Fig. 8 shows the development of pile and ground settlements versus the amplitude of groundwater decline. After the third stage, the settlements of 20-m, 30-m, and 40-m pile groups were 95.7, 61.8, and 38.7 mm, respectively, which notably exceeded the maximum acceptable (i.e. 20 mm) for high-speed railway (NRA, 2014). Nevertheless, the rate of increase of pile settlement lessened as the groundwater level fell. In other words, at lower groundwater levels, the impact of groundwater decline on pile settlement was less. On the other hand, groundwater decline significantly increased pile settlement at higher water levels. The settlement of the sample surface monitored by L5 indicated in Fig. 2 was slightly greater than that monitored by L1, which was closer to the 40-m pile group. This 40-m pile group played a significant role in constraining soil settlement.
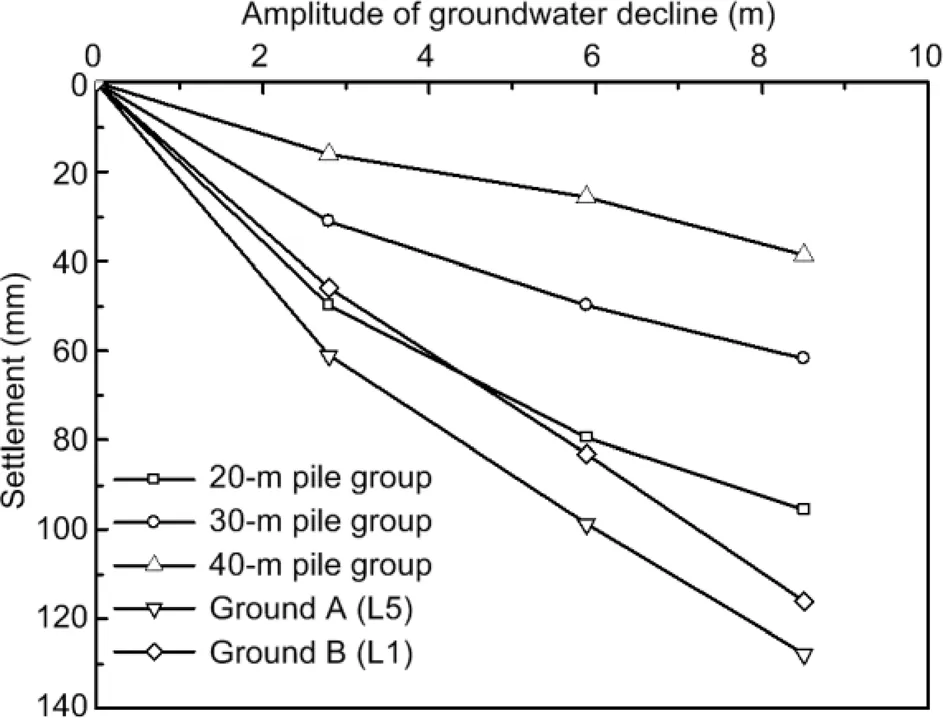
Fig. 8 Development of sample surface and pile settlement versus the amplitude of groundwater decline
3.3 Skin friction of pile
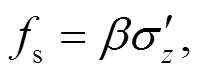
The skin friction (s) of a pile is usually evaluated based on the vertical effective stress (′) of soil and the coefficientusing Eq. (2). The coefficienthas been shown to be insensitive to soil properties (Johannessen and Bjerrum, 1965; Burland, 1973). Using Eqs. (3) and (4), this approach was further employed in this study to calculate the axial forces of the pile (F) due to the groundwater lowering.
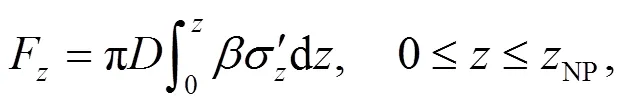
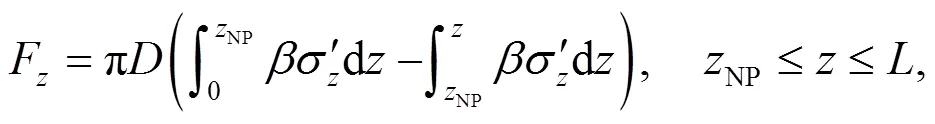
whereis the depth, andNPis the depth of the neutral point at which there is no relative displacement between the soil and the pile.andare the length and diameter of the pile, respectively. The effective stress′of soil was calculated according to the actual gravitational acceleration applied to the soil, taking into account the depth of the soil in the centrifuge test. Fig. 9a shows the fitted values ofand the calculated axial forces along the 40-m single pile during groundwater lowering. At the initial groundwater level, the ground sank due to the increased gravitational acceleration. The coefficientwas fitted to be 0.37 above the neutral point and 0.28 below the neutral point. After 3.2-m water table decline, the coefficientabove the neutral point increased to 0.40 and the coefficientbelow the neutral point reached 0.32. After the next two stages of groundwater decline, the coefficientabove the neutral point was 0.42 and 0.43, respectively, and the coefficientbelow the neutral point was 0.37 and 0.41, respectively. As summarized in Fig. 9b, the coefficientgradually increased with the amplitude of the water table decline. In short, the coefficientranged from 0.25 to 0.50 as suggested by Fellenius (2004, 2006) for silty soils, showing the validity of the approach employed.
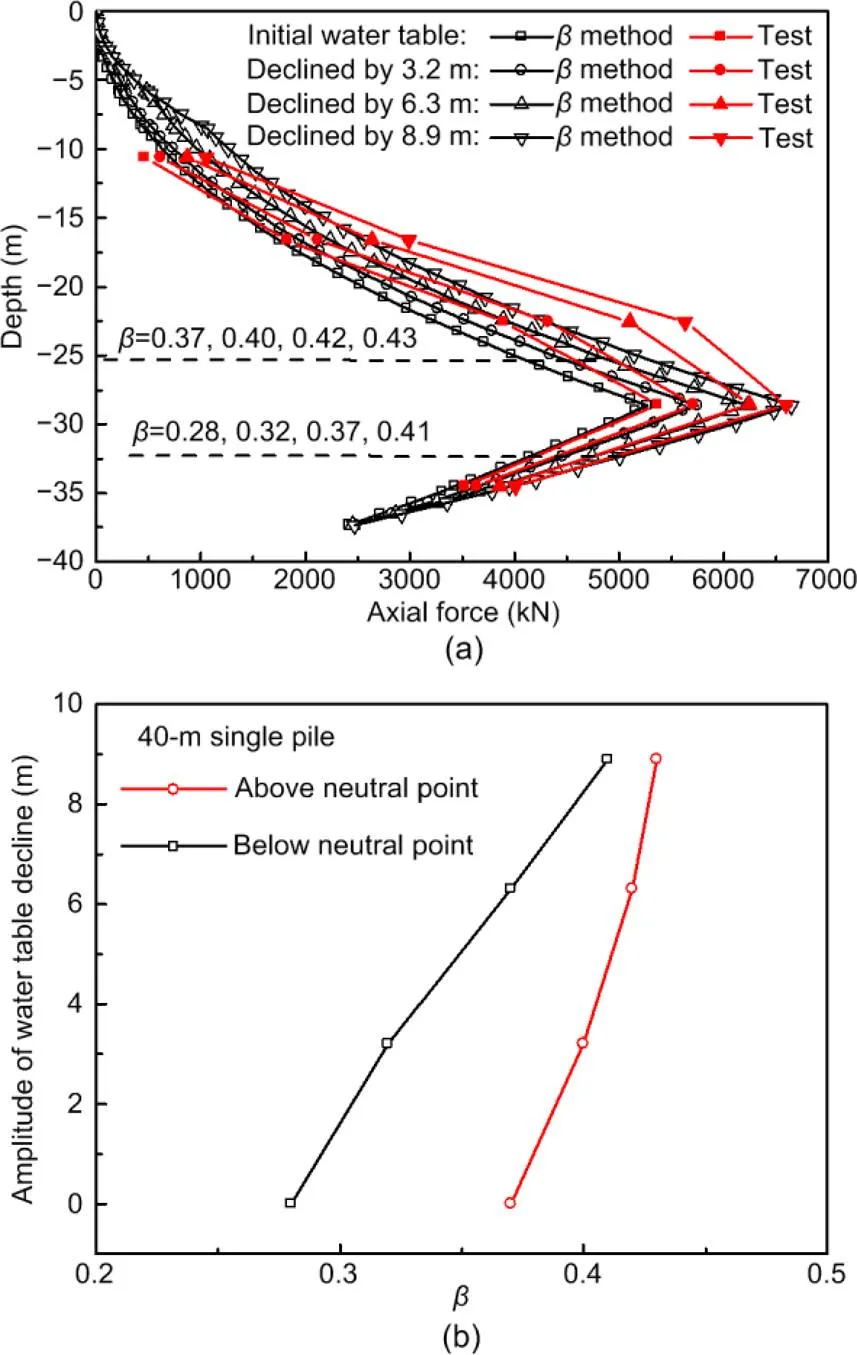
Fig. 9 Distributions of axial forces along the 40-m single pile (a) and the relationship between the amplitude of water table decline and the coefficient β (b)
4 Finite element analysis
4.1 Numerical modeling and boundary conditions
To further investigate the effect of groundwater lowering on the behavior of a pile, a 3D numerical analysis was performed to mitigate the deficiencies of the centrifuge test such as averaged and discrete measurements. Fig. 10 shows an overview of the 3D numerical mesh using the PLAXIS 3D software (Brinkgreve and Swolfs, 2007). The dimensions are identical to those specified in Fig. 2. The soil mesh near the piles has been improved for a more precise assessment of pile behavior. The total number of elements was 68 600 and the total number of nodes was 95 003. Displacements perpendicular to the outer boundaries were limited. The base surface was also fixed in all directions. The water table was set at the upper surface of the soil sample.
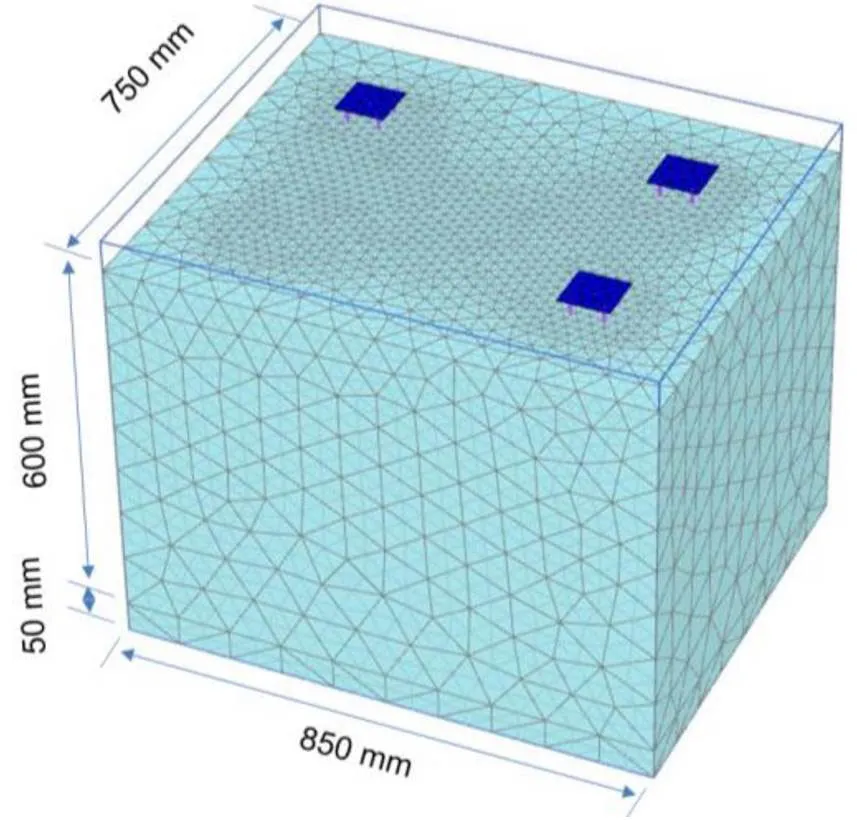
Fig. 10 Three-dimensional finite element mesh
4.2 Constitutive model and parameters
The deformation behavior of silty soil was reproduced by a hardening soil (HS) model (Brinkgreve and Vermeer, 1998; Schanz et al., 1999; Surarak et al., 2012), and the deformation behavior of the sand at the bottom of the container was described by a bilinear elastic stress-strain model according to the Mohr-Coulomb failure criterion (Chai et al., 2015). In Table 2, all the parameters for the silty layer were deduced from a series of laboratory tests whilst those for the sand layer were determined by reference to previous study (Zhu et al., 2013). Young’s modulus for the sand layer was 55 MPa based on triaxial tests under a relative density of 60% and a confining stress of 100 kPa (Liu et al., 2015). In addition, the behavior of the pile was modeled using the PLAXIS ‘embedded pile’, which has been widely adopted in previous studies (Springman, 1989; Kelesoglu and Springman, 2011). As suggested, the piles were considered as beam elements without volume, interacting virtually with nearby soils by means of skin and foot interfaces. An equivalent dimension of soil at the positions of the piles was assumed to behave elastically. The soil-pile interaction was achieved using interface elements, of which the interfacial friction angle (i) was calculated to be 19.4° based on the empirical Eq. (5) (Randolph and Wroth, 1981; Ng et al., 2008; Lam et al., 2009). The cohesion of the interface element (i) was calculated by Eq. (7) (Brinkgreve and Swolfs, 2007). In addition, the pile cap was modeled by a linear elastic plate element. Under such circumstances, the reproducibility of the behavior of the piles can be ensured.
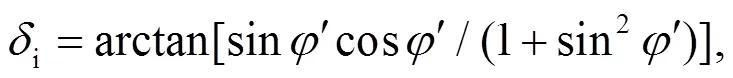
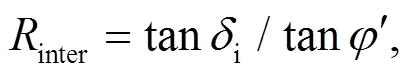
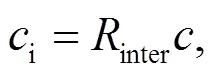
whereandare the friction angle and cohesion of the silty soil, respectively. The strength reduction factor of the PLAXIS interface (inter) was back analyzed to be 0.5 by Eq. (6).
The unit weight of aluminum for the pile and pile cap is about 27 kN/m3. However, the piles used in the centrifuge tests were made of hollow pipes and differ from the solid cylinder in the numerical model. As shown in Table 3, the unit weight and elastic modulus of the piles in the numerical model were back analyzed based on equivalent unit weight and tensile rigidity requirements. Therefore, the scaling law in the pile weight and axial stiffness can be guaranteed.
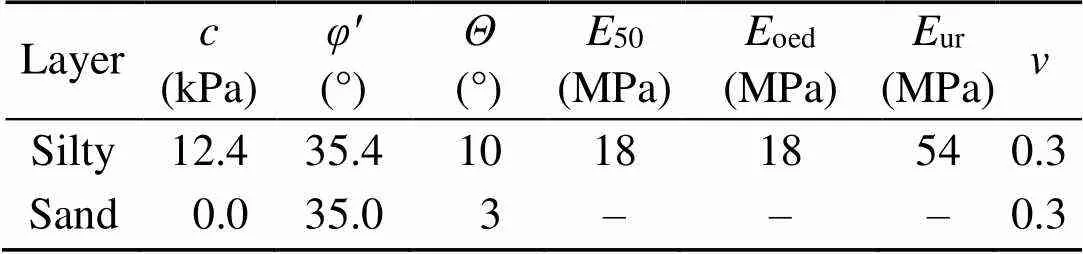
Table 2 Material parameters used in the numerical modeling
is the dilatancy angle;50is the secant modulus from triaxial test;oedis the tangent modulus from oedometer test;uris the modulus from unload and load tests;is Poisson’s ratio from unload and load tests
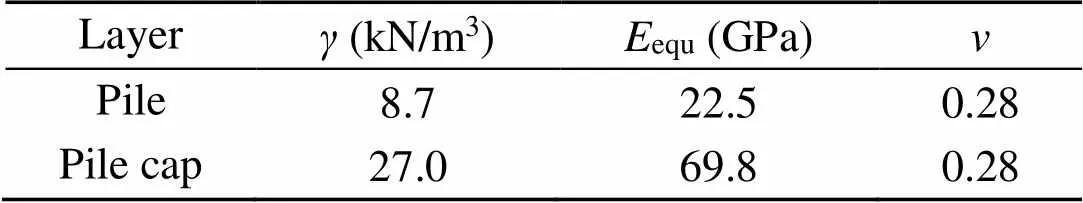
Table 3 Parameters for pile
is the unit weight;equis the equivalent modulus
4.3 Numerical modeling analysis
In the first step, the soil sample was consolidated under0condition and the pile and pile cap were subsequently activated. An increase in gravitational acceleration was achieved by replacing according soil properties so that equivalent stress condition as the centrifuge test was generated. The water table gradually declined by 3.2 m, 3.1 m, and 2.6 m in every sequential 319 d, which was set identically to the centrifuge test. Therefore, the stress conditions in the centrifuge test were well reproduced by numerical modeling.
4.3.1 Validation of numerical modeling
The behavior of piles is closely related to the deformation characteristics of the soil nearby, and these are mainly governed by the variation of the effective stress during groundwater fall. Therefore, precise assessment of the effective stress is crucial. Fig. 11 shows the distribution of effective stress along the depth after the groundwater falls at each stage. The dashed lines are from the theoretical derivation while the symbols are from numerical analysis. The coincident results prove that the variation in effective stress due to groundwater decline is well reproduced in the numerical analysis. Fig. 12 shows the comparisons of sample surface settlements by numerical modeling and by the centrifuge test. The settlement at the center of the sample surface obtained from the numerical analysis is slightly smaller than that from the test monitored by L5. The settlement to the 40-m pile group at 8aposition is slightly greater than that of the test monitored by L1. From a global perspective, these similar developments of settlements during groundwater decline validate the applied numerical model and parameters.
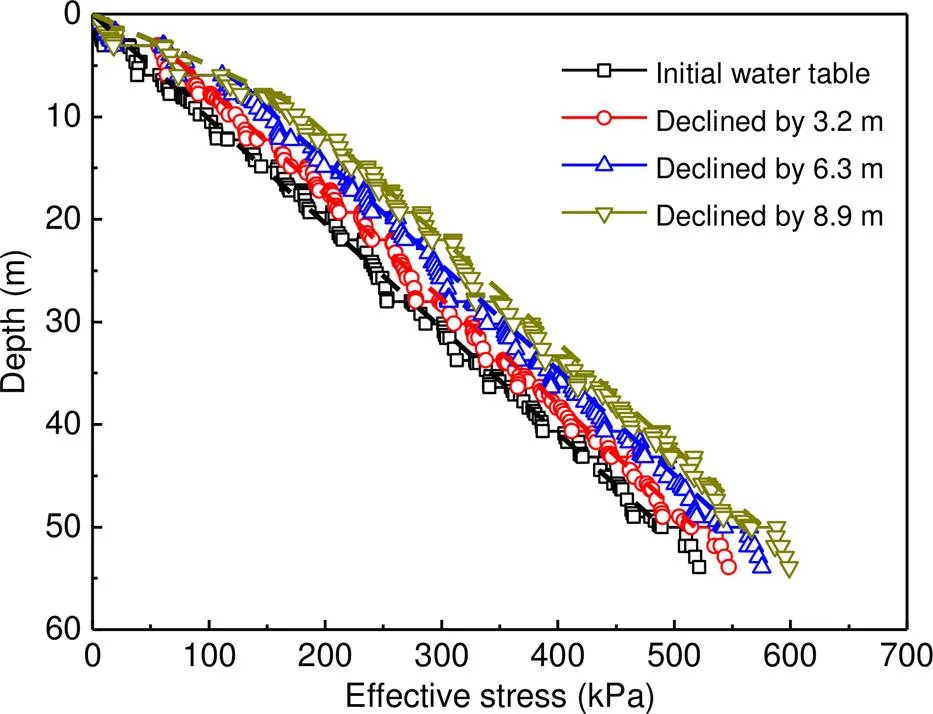
Fig. 11 Comparison of effective stress from numerical and theoretical analyses
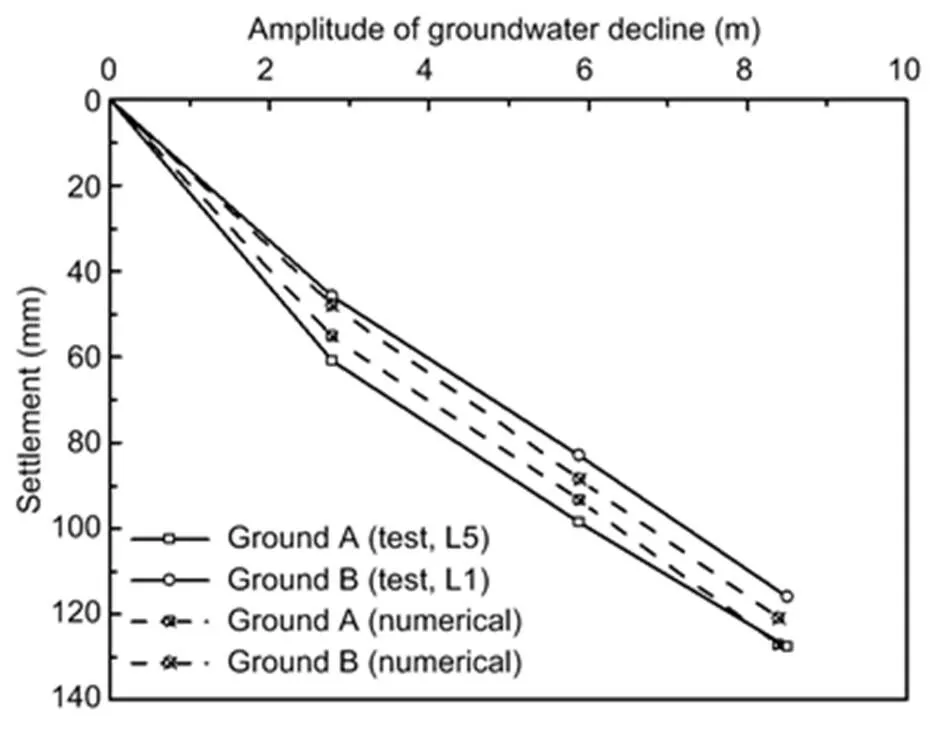
Fig. 12 Comparisons of surface settlement from numerical analysis and centrifuge test
Pile settlement is an important indicator of the effect of soil-pile interaction as the groundwater falls. The developments of settlements in the pile groups against the amplitude of groundwater decline in the numerical analysis and centrifuge test are shown in Fig. 13. The settlement developments of the 20-m and 30-m pile groups from numerical analysis agree broadly with those monitored in test. Nevertheless, the settlement of the 40-m pile group from the numerical analysis is slightly larger than the test result and less than the 40-m single pile settlement. As discussed, the piles settled as the downward skin frictions increased as the groundwater level fell. Fig. 14 shows the distributions of axial forces along the piles in different pile groups from both the numerical analysis and the test. The axial forces varied following a fold line regardless of the pile length. The maximum forces at the neutral point increased with the pile length and the amplitude of water table decline. Moreover, the position of a pile’s neutral point was not sensitive to the groundwater decline and remained at a depth of 0.7 times of the pile length. In each pile group, the corner pile presented larger axial forces than the center pile. Compared with the 40-m single pile, the maximum axial force of the corner pile of the 40-m pile group decreased by approximately 15% due to the group effect. Similar evaluation of coefficientas shown in Fig. 9b was conducted based on the distributions of axial forces in Fig. 14. The developments of coefficientagainst the amplitude of water table decline are shown in Fig. 15. Similarly, the coefficientabove the neutral point of each pile was larger than that below the neutral point and increased gradually with declining water table. Above the neutral point, the coefficientof the corner pile was evidently larger than that of the center pile and decreased with increasing pile length. However, such features were not observed below the neutral point.
Overall, the monitored forces were well reproduced by the numerical analysis, except for the center pile of the 20-m pile group ranging from −8 m to −14 m. Errors might happen to the sensors during pile penetration. In conclusion, based on the comparisons of effective stress of soil, pile and ground settlements, and pile axial forces, the adopted numerical model and parameters were valid as a basis for further investigation of the soil-pile interaction.
4.3.2 Soil-pile interaction
Based on the numerical model and parameters, the settlement distributions of sample surface and pile groups at the initial state (immediately after consolidation) and after the 6.3-m fall of the water table are obtained as shown in Fig. 16. The settlements of the piles were clearly less than that of the sample surface, which was away from the piles. Particularly, as the distance to the pile increased, the surface settlement increased and showed a concentric circular distribution. Therefore, the pile had a positive impact on constraining the settlement of surrounding soils. In addition, different settlements between the 40-m single pile and the surrounding soil were more distinct than the 20-m pile group. In other words, the 20-m pile group exhibited greater settlements that matched the surrounding soil. The shorter piles were ineffective in controlling ground settlement caused by groundwater decline.
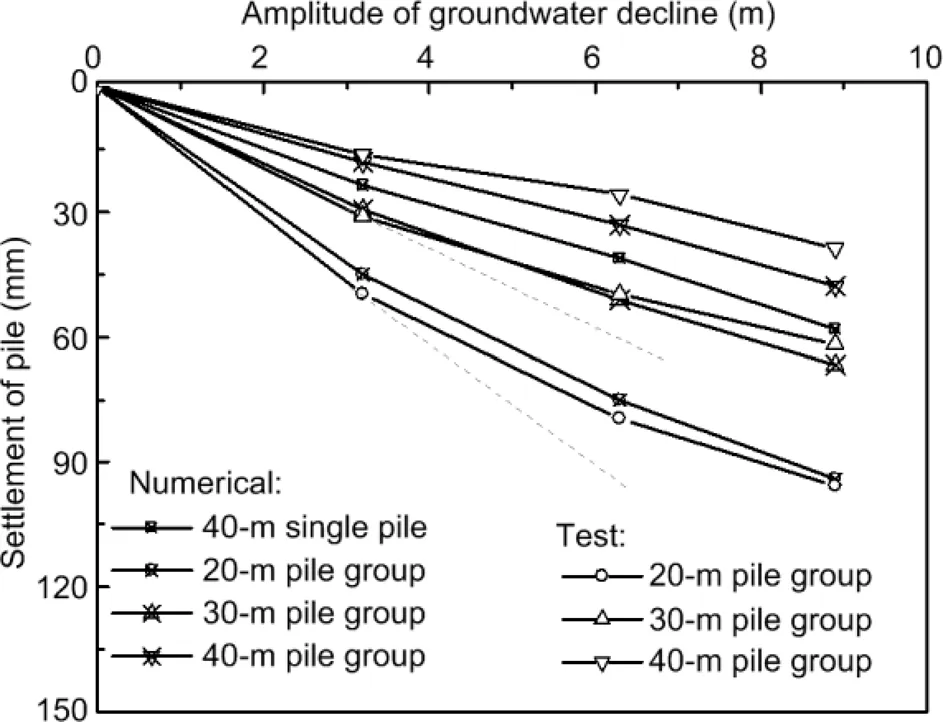
Fig. 13 Settlement comparisons of pile groups from numerical analysis and centrifuge test
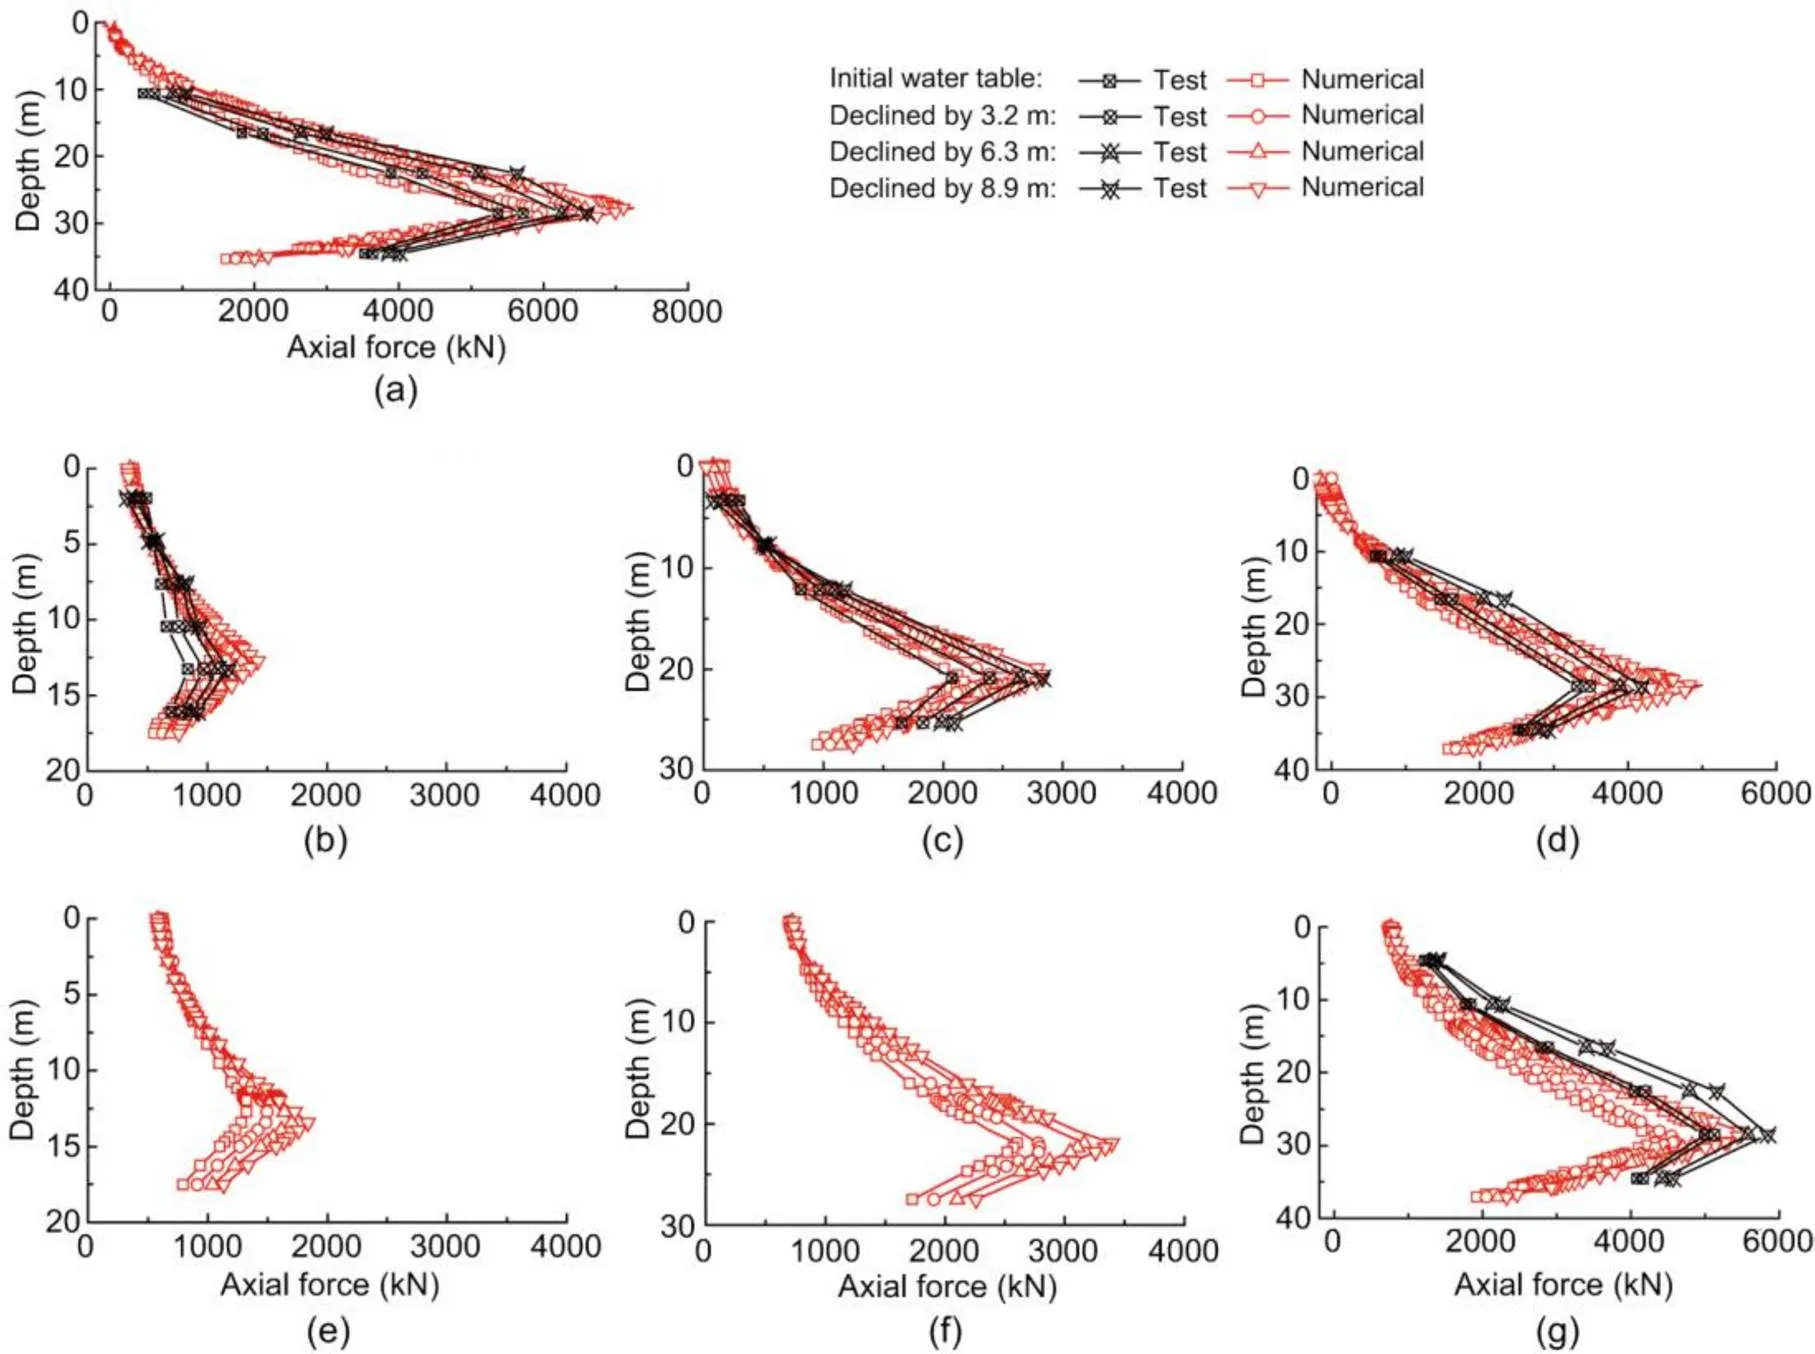
Fig. 14 Comparisons of the axial forces along piles from numerical analysis and centrifuge test: (a) 40-m single pile; (b) center pile of the 20-m pile group; (c) corner pile of the 20-m pile group; (d) center pile of the 30-m pile group; (e) corner pile of the 30-m pile group; (f) center pile of the 40-m pile group; (g) corner pile of the 40-m pile group
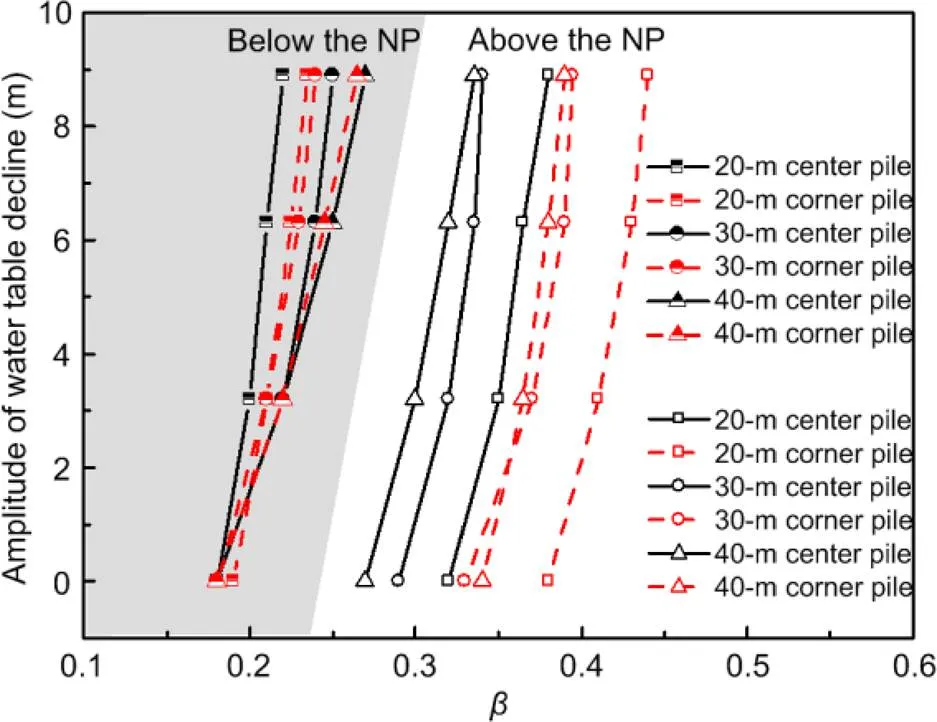
Fig. 15 Relationships between the coefficient β and amplitude of water table decline for the corner and center piles in each pile group (NP: neutral point)
The relative settlement of the soil to the pile was the main reason for the downward settlement of the pile because the amount of this relative settlement determines the development of the skin frictions along the piles. The settlement distributions of the ground along cross section A-A indicated in Fig. 2 are shown in Fig. 17 in the initial state and after a water table decline of 6.3 m. At different water levels along the pile, soil settlement was clearly affected by the single pile and pile group. Specifically, the soil was effectively constrained by the pile in the upper layer above the neutral point. However, such effect decreased gradually from the sample surface to the neutral point. Below the neutral point, an opposite behavior was observed. The induced settlement of the pile significantly increased the settlement of the soil beneath the pile.
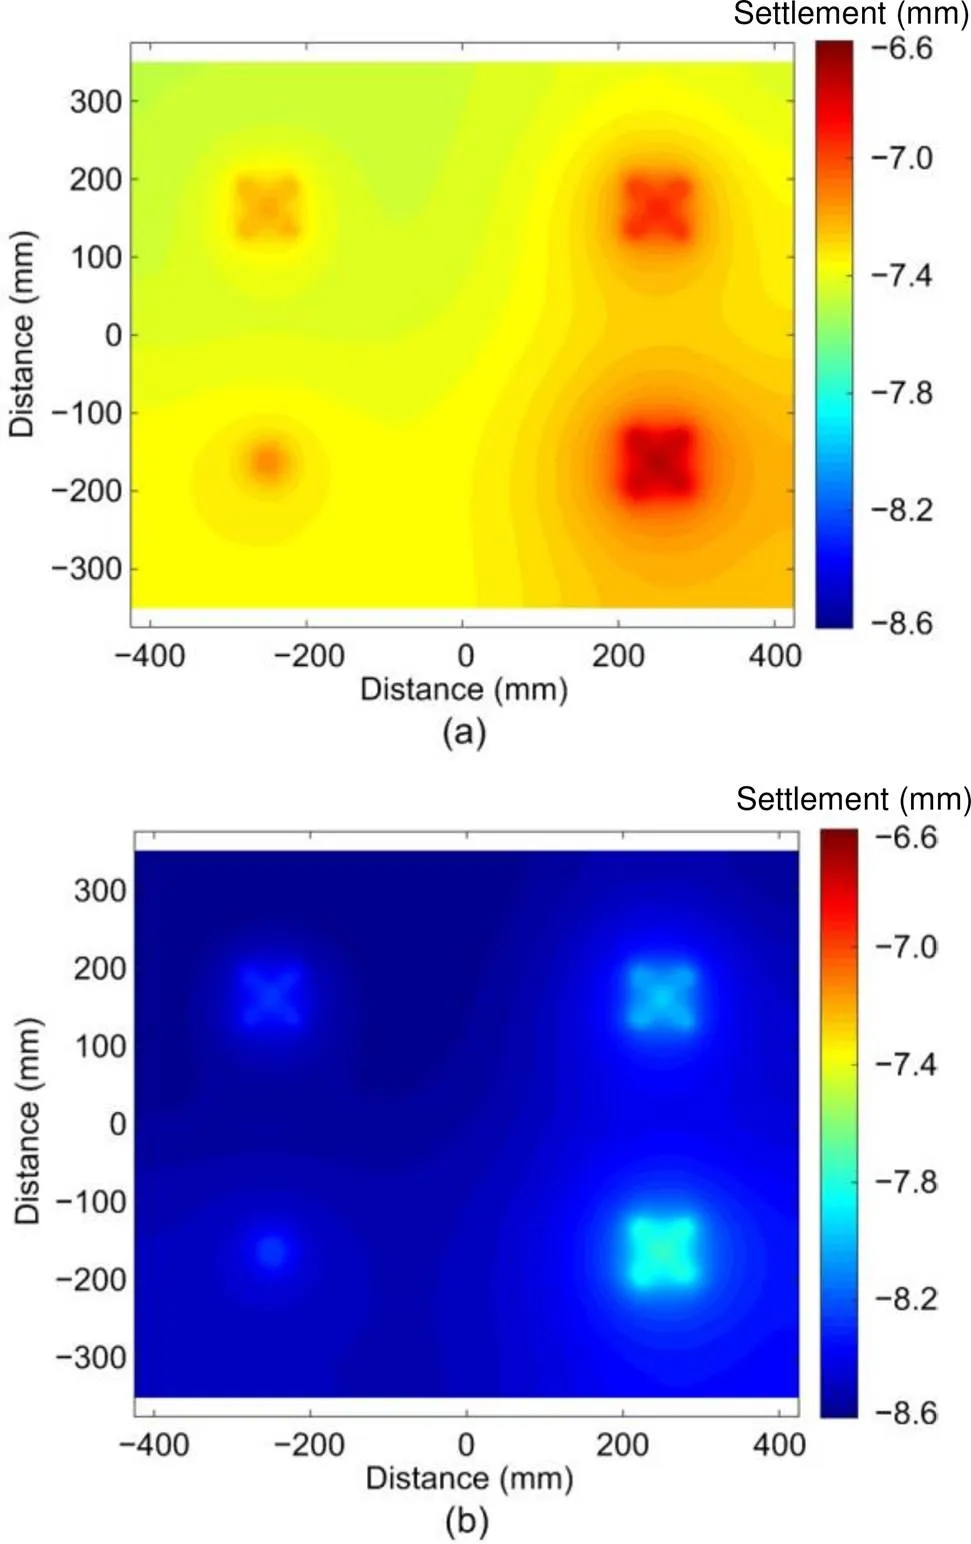
Fig. 16 Settlement distributions of ground surface and piles from the top view: (a) under the initial water table; (b) after water table decline by 6.3 m. References to color refer to the online version of this figure
A detailed comparison of the settlements between the 40-m single pile and the surrounding soil is shown in Fig. 18. The settlement of the soil before groundwater decline was smaller than that of the pile in the lower position. Particularly, an 82-mm settlement difference was observed at the bottom of the pile. However, in the upper position, the settlement of the soil was significantly greater. After water table decline was initiated, pile and soil settlements gradually increased. Most importantly, the settlement difference between the pile and soil increased and resulted in the rise of downward skin friction. As the water table decreased to 8.9 m, the settlement difference between the pile bottom and the soil increased to 96 mm. These results are consistent with the gradual increase in the axial force of piles shown in Fig. 14.
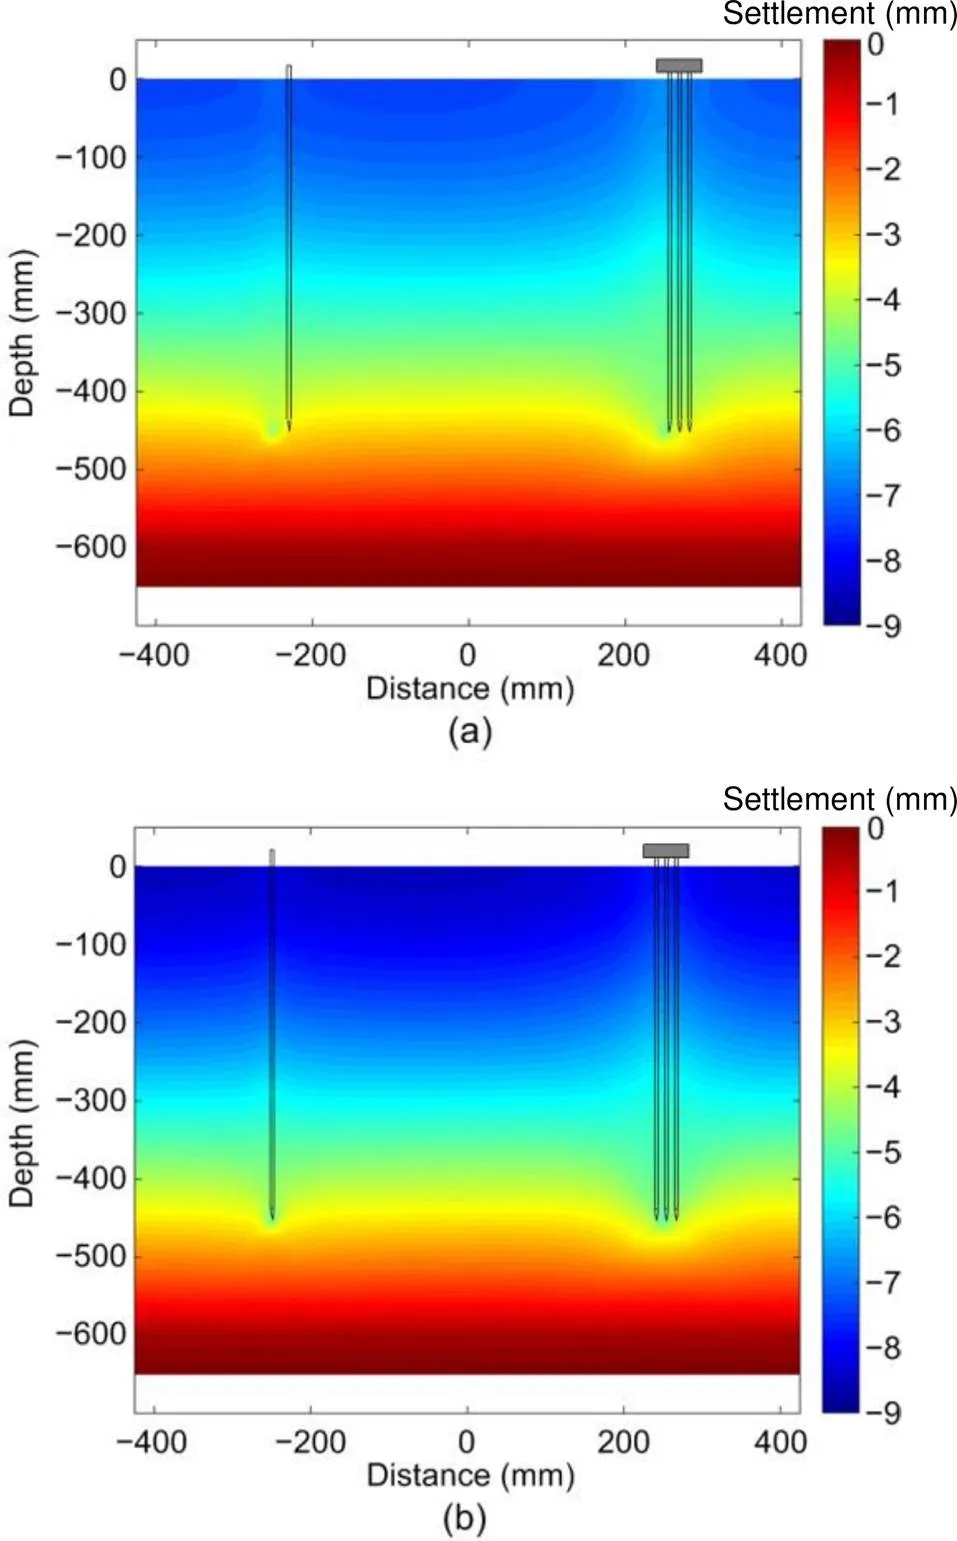
Fig. 17 Ground settlement distributions along cross section A-A: (a) under the initial water table; (b) after water table decline by 6.3 m.References to color refer to the online version of this figure
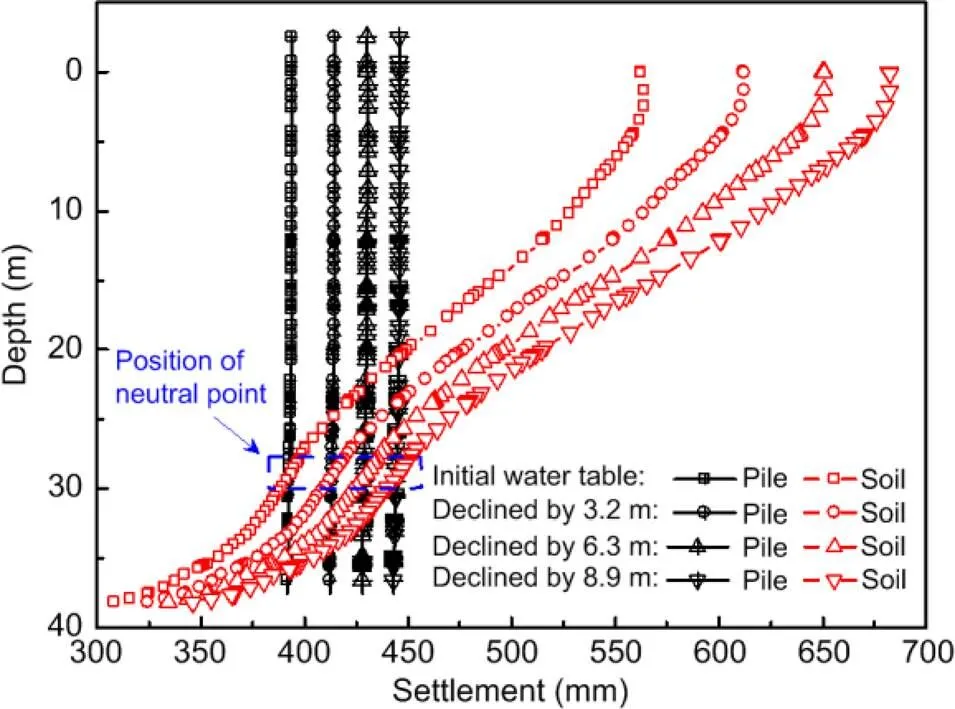
Fig. 18 Settlement comparisons of 40-m single pile and surrounding soil
The ground settlement distribution along cross section C-C indicated in Fig. 2 is shown in Fig. 19 when the groundwater level declined by 6.3 m. Combined with the distributions in Fig. 17, the soil settlement was constrained by the pile foundation to a certain degree. The effect diameter was found to be about 12 m, which was 10 times the pile diameter. The different settlements gradually increased as the water table declined, reaching a maximum of 40 mm. Meanwhile, the settlement of the soil in the pile group was not identical, and the settlement of the soil near the center pile was distinctly smaller than that near the corner pile. Since the relative settlement of the soil to the center pile was relatively small, the skin friction generated along the center pile was evidently less than that generated along the corner pile. This explains the axial forces along the center pile, which were significantly less than those along the corner pile, as shown in Figs. 7d and 14.
As explained earlier, the variation in axial force was caused by a change in skin friction along the pile. Fig. 20 shows the distribution pattern of friction forces along the 40-m single pile, with the coincident trend of axial force shown in Fig. 14a. The maximum axial force was distributed at the neutral point, above which the skin friction was negative skin friction (in the downward direction). The amplitude of negative skin friction increased almost linearly with the depth and sharply reversed when approaching the neutral point. These negative skin frictions dragged the pile downward. In addition, the direction of skin friction was reversed upward below the neutral point due to the upward relative deformation of soil to the pile. It increased rapidly to 200 kPa and presented notable fluctuations because the pile penetrated into stiffer soil layers. In addition, the amplitudes of skin friction along the pile increased with the amplitude of water table decline. This was consistent with the increasing relative displacement between the soil and the pile, as shown in Fig. 18.
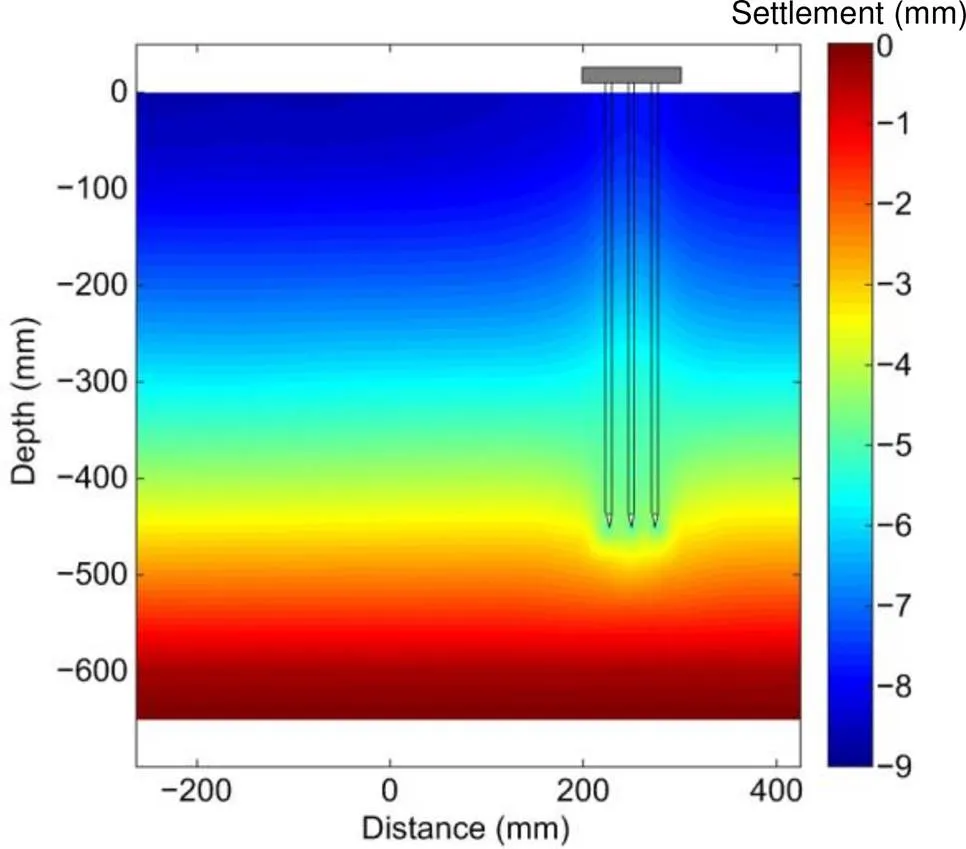
Fig. 19 Ground settlement distribution along cross section C-C. References to color refer to the online version of this figure
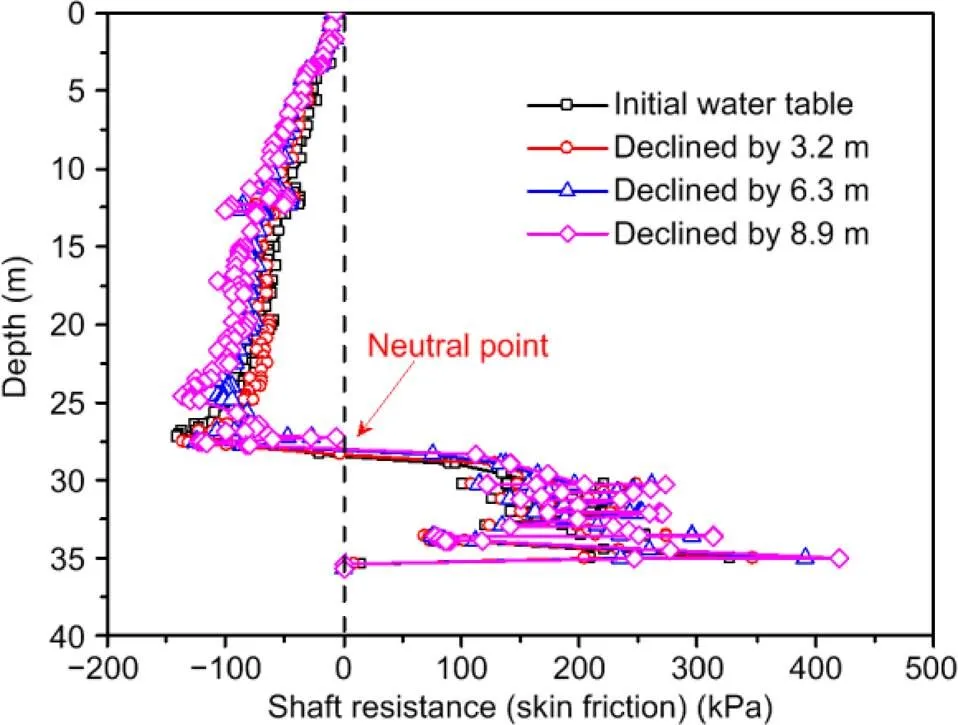
Fig. 20 Distributions of friction forces along the 40-m single pile
5 Design of railway pile foundation
5.1 Design method for piles subjected to cyclic train load
The settlement of the railway pile foundation gradually accumulates due to the cyclic train load during operation. Previous studies have argued that the accumulated settlements follow three typical development models: a stability model, a continuous increase model, and a rapid increase model (Chen RP et al., 2015; Chen YM et al., 2021). In addition, the development model proved to be determined by the cyclic load ratio (CLR) and static load ratio (SLR). As shown in Fig. 21, based on the time history of pile load (()), CLR is defined as the cyclic load amplitude (c) divided by the bearing capacity (u) of the pile foundation, while SLR is computed by the static load (s) divided by the bearing capacity (u). The static load is evaluated from the weight of the upper structures. As summarized in Fig. 22, by setting the SLR as the horizontal axis and the CLR as the vertical axis, the development model for accumulated settlement can be assessed accordingly. Given the known weight of the upper structure on the pile and the train load, the minimum bearing capacity of the pile that will maintain the accumulated settlement within a safe range can be calculated.
The results obtained in this study showed that groundwater decline increased pile friction and axial forces, which further increased thesfor pile settlement. Based on previous study (Poulos, 2008), theuof pile was not affected by the negative skin frictions. In addition, the amplitude of cyclic load derived from the train also remained during long-term operation. Therefore, SLR would increase withs, making the position (SLR, CLR) in Fig. 22 move to the right. In a worst case, the development model for settlement will be changed, for example, from stability model (zone I) to continuous increase model (zone II). Under this circumstance, the effects of groundwater declining on pile settlement need to be properly addressed at the design stage. Otherwise, a massive settlement can occur when the water table declines due to some practical problems.
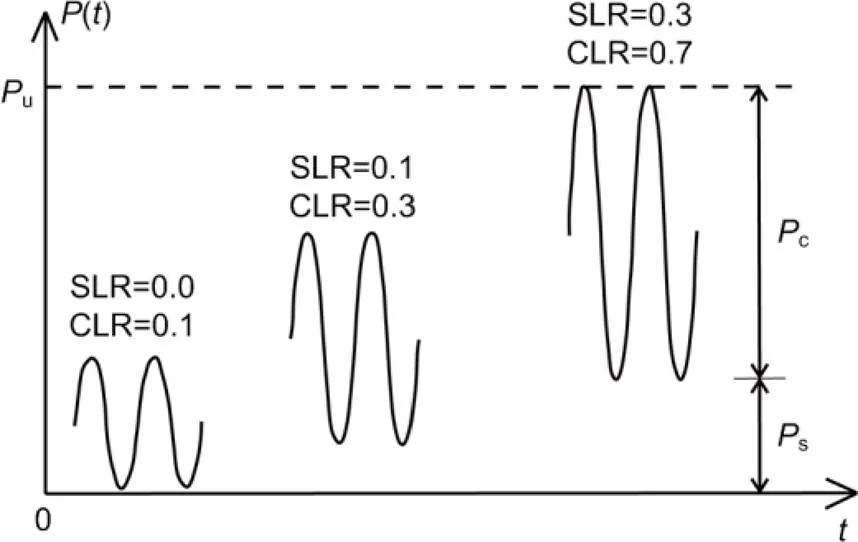
Fig. 21 Definitions of CLR and SLR for deciding the development model of accumulated settlement
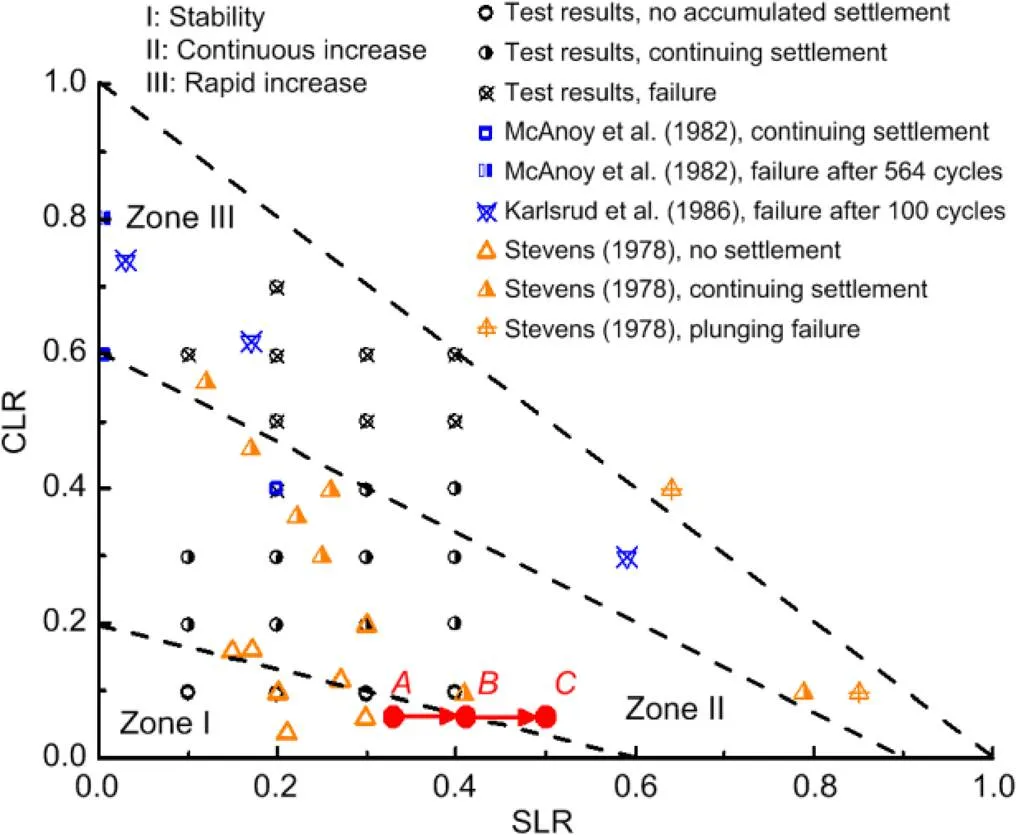
Fig. 22 Development model of accumulated settlement of a pile foundation
5.2 Design method for piles subjected to water table fall
A design method considering falling groundwater was proposed based on the obtained results and previous studies, as shown in Fig. 23. This method was developed on a pile foundation design method using the coefficient of friction(Fellenius, 1989, 2004). Using the initial pile length and diameter, the ultimate tip resistance of the pile was determined. Based on the probable amplitude of the groundwater drop, the distributions of effective stress, ultimate load, and drag load were obtained, with the total drag load and updated static load evaluated in sequence. Based on the known train load, the SLR and CLR values for settlement development were checked to ensure if the stable conditions were met. For a “no” response, the pile length and diameter need to be redesigned. For a “yes” response, the pile strength and settlement can be verified by field tests.
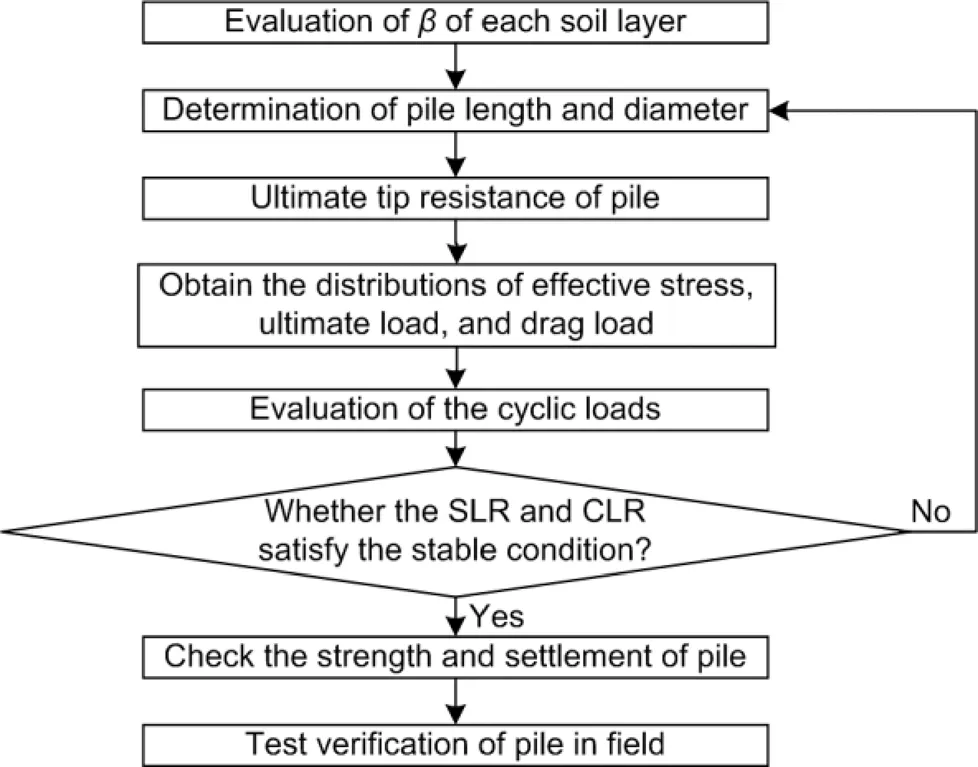
Fig. 23 Flow chart of designing the pile foundation considering falling groundwater
This approach was applied in an actual case of high-speed railway foundation to investigate the effect of groundwater decline. As schematically shown in Fig. 24, the pile group consisted of 10 piles, the dimensions of which are indicated as appropriate. Meanwhile, the pile lengthwas 49.0 m. After constructing the upper piers and bridge, the static load was about 15 645 kN. If the water table dropped 2.0 m,was assumed to be 0.338 according to the results shown in Fig. 15. Before the lowering of the water table, the maximum axial force was calculated to be 2440 kN. Based on the results obtained, the maximum axial force increased to 3978 kN at a depth of about 30 m (0.6–0.7) from the surface after the 2-m drop in the water table. Based on site monitoring, the amplitude of cyclic loads from train operation ranged from 200 kN to 350 kN, and was also affected by the span of the bridge (Nie et al., 2017). According to previous research, the cyclic load of the pile foundation is about 191 kN (Bian et al., 2014). In this study, the cyclic load was set at 300 kN, which is nearly the maximum value encountered in the field. Because of the stringent requirements on the pile foundation settlement of high-speed railway, its development should follow a stable model that stays in Zone I, satisfying0<15CLR+5SLR<3, as shown in Fig. 22 (Chen et al., 2015). Therefore, the SLR and CLR should be less than 0.585 and 0.005, respectively. The bearing capacity of the pile must be greater than 6780 kN. If groundwater decline is not considered,umust be greater than 4214 kN. Therefore, the minimum bearing capacity under groundwater decline is about 60.9% higher than that without water table decline. As a result, groundwater decline has a significant effect on the condition of the pile foundation during operation, and that must be adequately considered in design. However, it should be noted that a value forof 0.338 was evaluated based on the 40-m pile group in Fig. 15, which should be larger than that of the 49-m pile group according to the relationship ofwith to the length of the pile. It indicated that the 60.9% was overestimated but is nevertheless beneficial to the design.
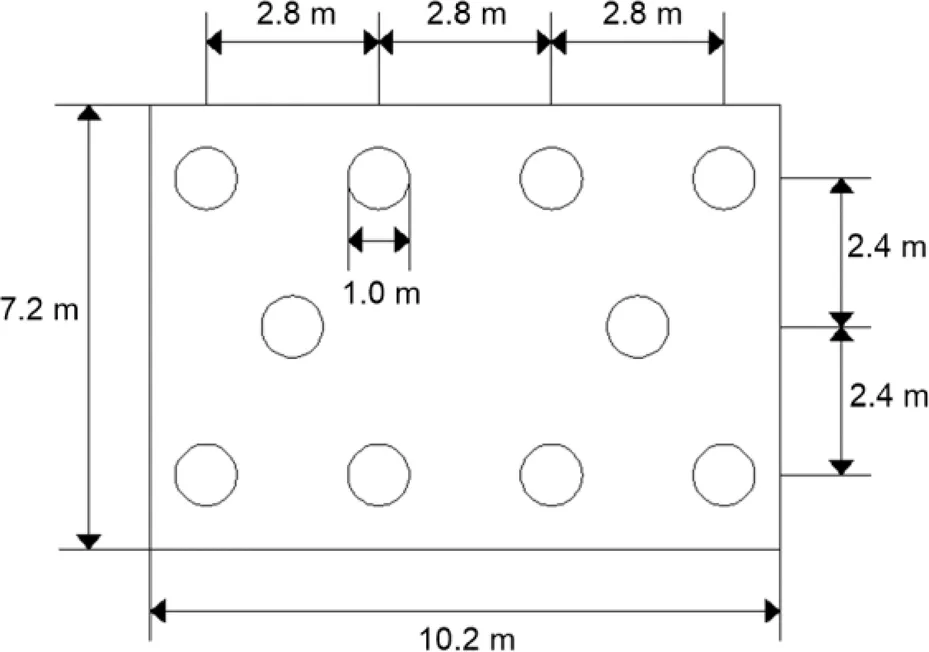
Fig. 24 A schematic diagram showing the dimensions of the pile group foundation of high-speed railway
It should be noted that the skin friction along a pile is not always constant. For example, when a train is loaded, the skin frictions already induced will be reduced by the subsequent groundwater decline, and the static load is reduced accordingly. In practice, when the amplitude of the cyclic load is greater than 30% of the skin friction, the cyclic load would obviously reduce the static load. More specific analyses are needed. The amplitude of the cyclic load of the high-speed trains in China ranges from 200 kN to 350 kN whilst the static load exceeds 15 000 kN. In addition, the skin frictions induced by groundwater decline are usually greater than 15% of the static load. Therefore, the cyclic load is considered negligible compared to the skin friction and has no further effect on the friction load. However, the friction forces due to groundwater decline can increase the static load of the pile and change the development model of pile settlement.
6 Conclusions
Centrifuge tests and numerical modeling were performed to investigate the behavior of piles in silty soils when subjected to groundwater decline. The results obtained were further considered in the design of a railway pile foundation. Based on the results, the following conclusions can be drawn:
1. As the water table declined, the inconsistent displacement of the soil relative to the pile resulted in a rise in skin friction on the pile, which increased the pile settlement and axial forces accordingly.
2. The position of the neutral point of the pile was not sensitive to groundwater decline and remained at a depth of 0.7 times the pile length. A longer pile presented a larger maximum axial force at the neutral point, and the coefficientfor evaluating the pile’s axial force decreased with increasing pile length.
3. Nevertheless, the incremental percentage of the maximum axial force decreased as pile length increased. Specifically, after 8.9 m of groundwater decline, the maximum axial forces of the center piles in the 20-m, 30-m, and 40-m pile groups increased by 40.3%, 36.3%, and 27.4%, respectively.
4. Soil settlement varied significantly in the annular area of 10 times pile diameter around the pile group, which increased with the distance to the pile group under the same groundwater decline.
5. The CLR and SLR determined the settlement development of a railway pile foundation during a long-term service period. The drop in groundwater level not only caused additional settlement due to soil reconsolidation, but also increased the SLR to influence the settlement development disadvantageously.
6. A design method of railway pile foundation considering groundwater decline was proposed and applied to an actual case. According to the change inversus the water table decline from the centrifuge test, the minimum bearing capacity of pile was approximately 60.9% larger than that without consideration of 2-m groundwater decline.
To sum up, based on the systematic discussion of the response of piles subjected to repeated groundwater decline and the application in the design of railway pile foundation, this study provided an approach to consider analogous issues encountered in practice. Engineers could obtain the coefficientof a specific soil when subjected to the probable amplitude of groundwater decline by means of laboratory tests. The increment of static load on the pile could be calculated accordingly and further considered in the design of the type and dimensions of piles. However, more efforts are still required to propose a practical standard that could be implemented in the field. For example, an advanced interface element is needed to take the non-linear response between pile and soil into account. A well-monitored in-situ test is also necessary to verify laboratory testing and numerical modeling to avoid scale effects.
Contributors
Xue-cheng BIAN and Yun-min CHEN designed the research. Lei FU and Chuang ZHAO processed the corresponding data and wrote the first draft of the manuscript. Xue-cheng BIAN and Chuang ZHAO revised and edited the final version.
Conflict of interest
Xue-cheng BIAN, Lei FU, Chuang ZHAO, and Yun-min CHEN declare that they have no conflict of interest.
Bian XC, Jiang HG, Cheng C, et al., 2014. Full-scale model testing on a ballastless high-speed railway under simulated train moving loads., 66:368-384. https://doi.org/10.1016/j.soildyn.2014.08.003
Bransby MF, Springman SM, 1996. 3-D finite element modelling of pile groups adjacent to surcharge loads., 19(4):301-324. https://doi.org/10.1016/0266-352X(95)00001-Q
Bransby MF, Springman SM, 1997. Centrifuge modelling of pile groups adjacent to surcharge loads., 37(2):39-49. https://doi.org/10.3208/sandf.37.2_39
Brinkgreve RB, Vermeer PA, 1998. PLAXIS Finite Element Code for Soil and Rocks Analysis, 8th Edition. Brookfield, Rotterdam, the Netherlands.
Brinkgreve RBJ, Swolfs WMBL, 2007. PLAXIS 3D Foundation Material Models Manual, 2nd Edition. PLAXIS BV, Delft, the Netherlands.
Burland JB, 1973. Shaft friction of piles in clay–a simple fundamental approach., 6(3):30-42.
Chai JC, Shrestha S, Hino T, et al., 2015. 2D and 3D analyses of an embankment on clay improved by soil–cement columns., 68:28-37. https://doi.org/10.1016/j.compgeo.2015.03.014
Chen L, Poulos HG, 1993. Analysis of pile-soil interaction under lateral loading using infinite and finite elements., 15(4):189-220. https://doi.org/10.1016/0266-352X(93)90001-N
Chen RP, Ren Y, Chen YM, 2015. Design method for piles subjected to cyclic axial loading for control of permanent accumulated settlement., 37(4):622-628 (in Chinese). https://doi.org/10.11779/CJGE201504007
Chen YM, Ma SN, Ren Y, et al., 2021. Experimental study on cyclic settlement of piles in silt soil and its application in high-speed railway design., 27:100496. https://doi.org/10.1016/j.trgeo.2020.100496
Comodromos EM, Bareka SV, 2005. Evaluation of negative skin friction effects in pile foundations using 3D nonlinear analysis., 32(3):210-221. https://doi.org/10.1016/j.compgeo.2005.01.006
Dong L, Niu B, Hu ST, et al., 2016. Research on the influence law of bridge foundation settlement with seasonal underground water level change on high speed railway., 2(39):1407-1411. https://doi.org/10.3208/jgssp.CHN-30
El-Mossallamy YM, Hefny AM, Demerdash MA, et al., 2013. Numerical analysis of negative skin friction on piles in soft clay., 9(1):68-76. https://doi.org/10.1016/j.hbrcj.2013.02.006
Fellenius BH, 1972. Down-drag on piles in clay due to negative skin friction., 9(4): 323-337. https://doi.org/10.1139/t72-037
Fellenius BH, 1989. Unified design of piles and pile groups., 1169:75-82.
Fellenius BH, 2004. Unified design of piled foundations with emphasis on settlement analysis. American Society of Civil Engineers Contributions in Honor of George G. Gobel, p.253-275. https://doi.org/10.1061/40743(142)15
Fellenius BH, 2006. Results from long-term measurement in piles of drag load and downdrag., 43(4):409-430. https://doi.org/10.1139/t06-009
Garnier J, Gaudin C, Springman SM, et al., 2007. Catalogue of scaling laws and similitude questions in geotechnical centrifuge modelling., 7(3):1-23. https://doi.org/10.1680/ijpmg.2007.070301
Hong Y, Ng CWW, Chen YM, et al., 2016. Field study of downdrag and dragload of bored piles in consolidating ground., 30(3):04015050. https://doi.org/10.1061/(ASCE)CF.1943-5509.0000790
Indraratna B, Balasubramaniam AS, Phamvan P, et al., 1992. Development of negative skin friction on driven piles in soft Bangkok clay., 29(3):393-404. https://doi.org/10.1139/t92-044
Ishikawa A, Zhou YG, Shamoto Y, et al., 2015. Observation of post-liquefaction progressive failure of shallow foundation in centrifuge model tests., 55(6):1501-1511. https://doi.org/10.1016/j.sandf.2015.10.014
Jeong S, Seo D, Lee J, et al., 2004. Time-dependent behavior of pile groups by staged construction of an adjacent embankment on soft clay., 41(4):644-656. https://doi.org/10.1139/t04-024
Jeong S, Seo D, Kim Y, 2009. Numerical analysis of passive pile groups in offshore soft deposits., 36(7):1164-1175. https://doi.org/10.1016/j.compgeo.2009.05.003
Jeong S, Ko JY, Lee C, et al., 2014. Response of single piles in marine deposits to negative skin friction from long-term field monitoring., 32(3):239-263. https://doi.org/10.1080/1064119X.2012.735344
Jiang HG, Bian XC, Chen YM, et al., 2015. Impact of water level rise on the behaviors of railway track structure and substructure: full-scale experimental investigation., 2476(1):15-22. https://doi.org/10.3141/2476-03
Jiang HG, Bian XC, Jiang JQ, et al., 2016. Dynamic performance of high-speed railway formation with the rise of water table., 206:18-32. https://doi.org/10.1016/j.enggeo.2016.03.002
Johannessen IJ, Bjerrum L, 1965. Measurement of the compression of a steel pile to rock due to settlement of the surrounding clay. Proceedings of the Soil Mechnics & Foundaton Engineering Conference, p.261-264.
Karlsrud K, Nadim F, Haugen T, 1986. Piles in clay under cyclic axial loading-field tests and computational modeling. Proceedings of the 3rd International Conference on Numerical Methods in Offshore Piling.
Kelesoglu MK, Springman SM, 2011. Analytical and 3D numerical modelling of full-height bridge abutments constructed on pile foundations through soft soils., 38(8):934-948. https://doi.org/10.1016/j.compgeo.2011.07.011
Lam SY, Ng CWW, Leung CF, et al., 2009. Centrifuge and numerical modeling of axial load effects on piles in consolidating ground., 46(1):10-24. https://doi.org/10.1139/T08-095
Lee CJ, Chen CR, 2003. Negative skin friction on piles due to lowering of groundwater table., 34(1):13-25.
Lee CJ, Ng CWW, 2004. Development of downdrag on piles and pile groups in consolidating soil., 130(9): 905-914. https://doi.org/10.1061/(asce)1090-0241(2004)130:9(905)
Lee CJ, Bolton MD, Al-Tabbaa A, 2002. Numerical modelling of group effects on the distribution of dragloads in pile foundations., 52(5):325-335. https://doi.org/10.1680/geot.2002.52.5.325
Lee CJ, Lee JH, Jeong S, 2006. The influence of soil slip on negative skin friction in pile groups connected to a cap., 56(1):53-56. https://doi.org/10.1680/geot.2006.56.1.53
Liu JC, Xiong G, Zhu B, et al., 2015. Bearing capacity and deflection behaviors of large diameter monopile foundations in sand seabed., 36(2): 591-599 (in Chinese). https://doi.org/10.16285/j.rsm.2015.02.040
Liu JY, Gao HM, Liu HL, 2012. Finite element analyses of negative skin friction on a single pile., 7(3):239-252. https://doi.org/10.1007/s11440-012-0163-x
McAnoy R, Chasman A, Purvis D, 1982. Cyclic tensile testing of a pile in glacial till. Proceedings of the 2nd International Conference on Numerical Methods in Offshore Piling.
Ng CWW, Poulos HG, Chan VSH, et al., 2008. Effects of tip location and shielding on piles in consolidating ground., 134(9):1245-1260. https://doi.org/10.1061/(asce)1090-0241(2008)134:9(1245)
Nie RS, Tang SM, Leng WM, et al., 2017. Field measurement of high-speed train-induced vertical loads on bridge pile foundations., 39(9): 148-154 (in Chinese). https://doi.org/10.3969/j.issn.1001-8360.2017.09.021
NRA (National Railway Administration of the People’s Republic of China), 2014. Code for Design of High Speed Railway, TB 10621-2014. NRA, Beijing, China (in Chinese).
Omer JR, 2012. Integrating finite element and load-transfer analyses in modelling the effects of dewatering on pile settlement behaviour., 49(5):512-521. https://doi.org/10.1139/t2012-013
Poulos HG, 2008. A practical design approach for piles with negative friction., 161(1):19-27. https://doi.org/10.1680/geng.2008.161.1.19
Randolph MF, Wroth CP, 1981. Application of the failure state in undrained simple shear to the shaft capacity of driven piles., 31(1):143-157. https://doi.org/10.1680/geot.1981.31.1.143
SBQTS (The State Bureau of Quality and Technical Supervision), MOHURD (Ministry of Housing and Urban-Rural Development of the People’s Republic of China), 1999. Standard for Soil Test Method, GB/T 50123-1999. Standardization Administration of China, Beijing, China (in Chinese).
Schanz T, Vermeer PA, Bonnier PG, 1999. The hardening soil model: formulation and verification.: Brinkgreve RBJ (Ed.), Beyond 2000 in Computational Geotechnics. Taylor & Francis, London, UK, p.281-296. https://doi.org/10.1201/9781315138206-27
Shen RF, 2008. Negative Skin Friction on Single Piles and Pile Groups. PhD Thesis, National University of Singapore, Kent Ridge, Singapore.
Springman SM, 1989. Lateral Loading on Piles Due to Simulated Embankment Construction. PhD Thesis, University of Cambridge, Cambridge, UK.
Stevens J, 1978. Prediction of pile response to vibratory loads. Proceedings of the 10th Annual Offshore Technology Conference, p.2213-2218.
Surarak C, Likitlersuang S, Wanatowski D, et al., 2012. Stiffness and strength parameters for hardening soil model of soft and stiff Bangkok clays., 52(4):682-697. https://doi.org/10.1016/j.sandf.2012.07.009
Teh CI, Wong KS, 1995. Analysis of downdrag on pile groups., 45(2):191-207. https://doi.org/10.1680/geot.1995.45.2.191
Wang LZ, Chen KX, Hong Y, et al., 2015. Effect of consolidation on responses of a single pile subjected to lateral soil movement., 52(6): 769-782. https://doi.org/10.1139/cgj-2014-0157
Wang LZ, Wang H, Zhu B, et al., 2018. Comparison of monotonic and cyclic lateral response between monopod and tripod bucket foundations in medium dense sand., 155:88-105. https://doi.org/10.1016/j.oceaneng.2017.12.006
Wong KS, Teh CI, 1995. Negative skin friction on piles in layered soil deposits., 121(6):457-465. https://doi.org/10.1061/(asce)0733-9410(1995)121:6(457)
Wong KS, Ng CWW, Chen YM, et al., 2012. Centrifuge and numerical investigation of passive failure of tunnel face in sand., 28:297-303. https://doi.org/10.1016/j.tust.2011.12.004
Xia LN, Miao YD, Tan TQ, 2012. Three-dimensional finite element analysis of negative skin friction behaviors in pile groups with cap., 33(3): 887-891. https://doi.org/10.16285/j.rsm.2012.03.048
Zhou YG, Meng D, Ma Q, et al., 2019. Centrifuge modeling of dynamic response of high fill slope by using generalized scaling law., 260:105213. https://doi.org/10.1016/j.enggeo.2019.105213
Zhu B, Xiong G, Liu JC, et al., 2013. Centrifuge modelling of a large-diameter single pile under lateral loads in sand., 35(10): 1807-1815 (in Chinese).
Zhu B, Wen K, Li T, et al., 2019. Experimental study on lateral pile–soil interaction of offshore tetrapod piled jacket foundations in sand., 56(11):1680-1689. https://doi.org/10.1139/cgj-2018-0292
Zhu L, Gong HL, Li XJ, et al., 2015. Land subsidence due to groundwater withdrawal in the northern Beijing plain, China., 193:243-255. https://doi.org/10.1016/j.enggeo.2015.04.020
https://doi.org/10.1631/jzus.A2000235
TU473
*Project supported by the Basic Science Center Program for Multiphase Evolution in Hypergravity at the National Natural Science Foundation of China (No. 51988101), the Chinese Program of Introducing Talents of Discipline to University (111 Project) (No. B18047), and the Key Research and Development Program of Zhejiang Province (No. 2019C03111), China
May 19, 2020;
Oct. 9, 2020;
Mar. 11, 2021
 Journal of Zhejiang University-Science A(Applied Physics & Engineering)2021年4期
- Journal of Zhejiang University-Science A(Applied Physics & Engineering)的其它文章
- Development of electric construction machinery in China: a review of key technologies and future directions*
- Analytical solutions to ground settlement induced by ground loss and construction loadings during curved shield tunneling*
- Stabilization mechanisms of lifted flames in a supersonic stepped-wall jet combustor*
- A parametric study on unbalanced moment of piston type valve core*