
Response of revegetation to climate change with meso-and micro-scale remote sensing in an arid desert of China
2021-03-25 06:07GuangSongBingYaoWangJingYaoSunYanLiWangXinRongLi
Guang Song,BingYao Wang,JingYao Sun,3,YanLi Wang,3,XinRong Li*
1. Shapotou Desert Research and Experimental Station, Northwest Institute of Eco-Environment and Resources, Chinese Academy of Science,Lanzhou,Gansu 730000,China
2. Key Laboratory of Stress Physiology and Ecology in Cold and Arid Regions of Gansu Province, Northwest Institute of Eco-Environment and Resources,Chinese Academy of Sciences,Lanzhou,Gansu 730000,China
3.University of Chinese Academy of Sciences,Beijing 100049,China
ABSTRACT The revegetation protection system (VPS) on the edge of the Tengger Desert can be referred to as a successful model of sand control technology in China and even the world, and there has been a substantial amount of research on revegetation stability. However, it is unclear how meso- and micro-scale revegetation activity has responded to climatic change over the past decades.To evaluate the relative influence of climatic variables on revegetation activities in a restored desert ecosystem, we analysed the trend of revegetation change from 2002 to 2015 using a satellite-derived normalized difference vegetation index (NDVI) dataset. The time series of the NDVI data were decomposed into trend, seasonal, and random components using a segmented regression method. The results of the segmented regression model indicate a changing trend in the NDVI in the VPS, changing from a decrease (-7×10⁻³/month) before 2005 to an increase (0.3×10⁻³/month)after 2005. We found that precipitation was the most important climatic factor influencing the growing season NDVI(P <0.05), while vegetation growth sensitivity to water and heat varied significantly in different seasons. In the case of precipitation reduction and warming in the study area, the NDVI of the VPS could still maintain an overall slow upward trend(0.04×10⁻³/month), indicating that the ecosystem is sustainable. Our findings suggest that the VPS has been successful in maintaining stability and sustainability under current climate change conditions and that it is possible to introduce the VPS in similar areas as a template for resistance to sand and drought hazards.
Keywords:vegetation activity;climate change;NDVI trend;restored ecosystem;meso-and micro-scale
1 Introduction
Drylands cover more than one-third of the terrestrial land surface (Wang, 2003; Liet al., 2013) and are characterized by the sparse presence of vascular plants due to severe and fragile ecological environment conditions, such as low water availability and low rates of nutrient turnover (Wang, 2003). For example, areas in China that experience wind-blown sand disasters (such as sand storms and farmland desertification), which represents a well-defined region(75°E-125°E, 35°N-50°N), are mainly distributed in drylands. These regions, including desert oases, deserts and desert steppe transition regions,are most seriously affected by desertification and sand hazards and are located west of the Helan Mountains, where annual rainfall is less than 200 mm (Wang, 2003). They are also key areas in China for building non-irrigated vegetation systems and constructing ecological barriers to sand disasters(Liet al.,2013).
To prevent and control wind-blown sand damage(wind erosion and sand burial) in the 40 km subgrade area of Shapotou along the Baotou-Lanzhou Railway and to ensure efficient railway operation, the Chinese Academy of Science (CAS), the Ministry of Railways and other relevant departments began to design and gradually establish a revegetation sand fixation system for the prevention and control of sand hazards in 1956 following three steps:(I)set up high sand fences perpendicular to the main wind direction on the moving sand dunes; (II) establish 1m×1m straw checkerboards behind the sand fences as matrix for sand fixation and plant 2-year-old xerophytic shrub seedlings(mainlyCaragana korshinskiKom,Artemisia ordosicaKrasch.,Hedysarum scoparium,Caragana microphyllaLam.,Calligonum arborescens,andAtraphaxis bracteataA. LOS.) under the condition of no irrigation,with plant and row spacing of 1m×2m and 2m×3m,respectively; and (III) use the same pattern and method to fix sand along the 16 km long area on both sides of the railway (specifically in 1964,1973,1982 and 1992).In different years, the sand fixation revegetation belt is parallel distributed on both sides of the railway, forming a revegetation protective system (VPS) with a width of 500-1,000 m in the north and 200-1,000 m in the south, which not only stops wind-blown sand damage affecting the railway but also the formation of stable revegetation communities(Liet al.,2014).
It is generally known that dryland ecosystems are the most sensitive ecosystem types for increasing atmospheric CO2concentrations and climate change(e.g., temperature and precipitation change) (Chenet al., 2019). The sparse vegetation distribution and harsh natural environment make these ecosystems highly vulnerable (Holmgrenet al., 2006). Taking vegetation restoration into consideration, ecological restoration programmes aim to increase vegetation activities (e.g., vegetation coverage, biomass, leaf area index and net primary productivity) (Tianet al.,2015). Thus, to some extent, the success or failure of a revegetation project can be assessed by increasing or decreasing vegetation activities. The normalized difference vegetation index (NDVI) is often used as a proxy for vegetation activity, and it is one of the key metrics of land degradation (Fensholt and Proud,2012; Boschettiet al., 2013). During the past six decades, the most pronounced warming trend has been found in northern China (Piaoet al., 2010). The VPS along the Baotou-Lanzhou Railway has been subject to an array of natural environmental changes, such as local climate variations, including temperature and precipitation changes (Zhang DHet al., 2016; Zhang ZSet al.,2016).
A key question is whether this VPS has maintained relative stability under both the ecological restoration programme and the influence of climate change over the past decade.Several studies have documented how revegetation responds to climatic changes and human intervention in the VPS. For example,Liet al.(2013)and Huanget al.(2016)found that the revegetation pattern of the VPS gradually changed from a uniform distribution to a patch distribution from 1955-2009 in the revegetation system based on multiyear average precipitation conditions (P= 0.25 mm/d).However, The VPS range (about 16km×1km) is too small for remote sensing; few studies have evaluated the response of the VPS to climate change in the Shapotou region over the past decade. It is unclear how annual,seasonal and monthly revegetation activities have changed across the VPS and whether revegetation activity has increased over the past decade.Therefore, it is necessary to better understand the changes in the NDVI and its climate control within the mid-time scale of different years and seasons.The purpose of this study is to analyse the growth dynamics of revegetation during the growing season in the VPS.We use the newest dataset from 2002 to 2015 to(1) investigate trends in annual, seasonal and monthly revegetation activities in the VPS over the past decade and (2) identify possible reasons for trends in revegetation activity.
2 Materials and methods
2.1 Study area
The VPS is located along the southeastern fringe of the Tengger Desert in the Ningxia Hui autonomous region of northwestern China (Figure 1), with an elevation ranging from 1,300-1,350 m above mean sea level (m a.s.l.).According to the local meteorological station (Shapotou Desert Research and Experiment Station (SDRES, CAS), the annual mean temperature from 1955 to 2016 was 10 °C, and the annual mean precipitation was 186 mm, approximately 80% of which occurred between May and September. However, the annual mean temperature of the current decade was 0.5°C higher than that of the previous decade,while the annual mean precipitation was 4 mm lower than that of the previous decade(Liet al.,2010).
After more than 50 years of evolution,the ecological environment of the study area has been significantly improved, from the revegetation types being dominated by pioneer plants such asAgriophyllum squarrosum(Linn.) Moq. andCorispermum patelliformeIljin to a relatively stable plant community composed of drought-tolerant shrubs, herbs and a biological soil crust (BSC). The main species areCaragana korshinskii,A. ordosica,A. bracteata,Bassia dasyphylla,Eragrostis poaeoidesBeauv andArtemisia capillaries(Songet al., 2020).The VPS promoted the fixation of sand and gradually formed the BSC on the sand surface. After decades of colonization and development,the BSC coverage even exceeded that of the natural vegetation area. In 1956, the BSC coverage of the inter-humus lowlands in the sand-fixing area reached more than 90%(Liet al.,2017).
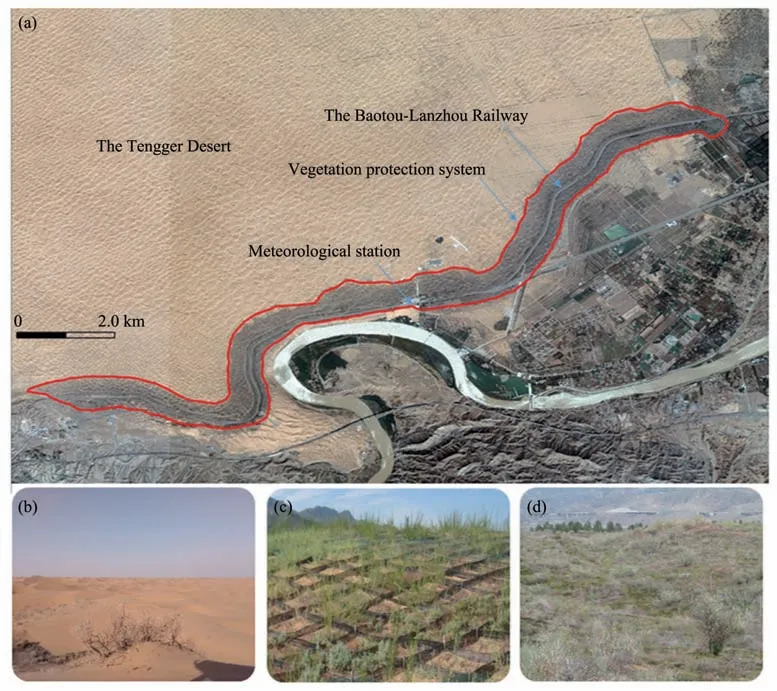
Figure 1 Overview of the study area.(a)Locations of the Tengger Desert(red area),study area(red line area)and Baotou-Lanzhou Railway;(b)landscape of the desert before restoration;(c)vegetation restoration using 1m×1m straw checkerboards combined with drought-tolerant shrubs;(d)the VPS status after more than 50 years of restoration
2.2 Data collection
In this study, we collected 168 Landsat 7 TM/ET+ remote sensing image data of one scene per month from 2002 to 2015.To reduce the impact of clouds on vegetation recognition, we replaced the image data with the image data of an adjacent time period; finally, 168 images are available. First, using the region of interest tool in ENVI5.3 software, we use the vector file of the research area to clip each remote sensing image irregularly. We only need to calculate the NDVI value within the research area to improve the processing efficiency of the software. The images were corrected for the radiative, atmospheric and geometric conditions of the image,and the NDVI was calculated after fusion of the panchromatic image and multispectral image using the NNDiffuse pan sharping method with ENVI5.3 (Xiaet al., 2018). NNDiffuse pan sharping using the Nearest Neighbor Diffusion Pan Sharpening algorithm which can perfectly maintain the spectral information before and after fusion of the same pixel of Landsat images (Xiaet al., 2018). This method can improve the resolution of the multispectral image to 15m×15m and then standardize the image, projecting it to the universal transverse mercator(UTM)zone 33°N with the WGS 1984 projection system using ENVI5.3.
To clearly reflect the interannual change in the revegetation NDVI in the study area, we use maximum value composites to obtain the seasonal NDVI of each grid and then average the seasonal NDVI value of the whole area to obtain the seasonal average NDVI value in the study area; finally,we analyse the interannual change trend of the NDVI in different seasons generated over the time series. The formula for calculating the NDVI is:
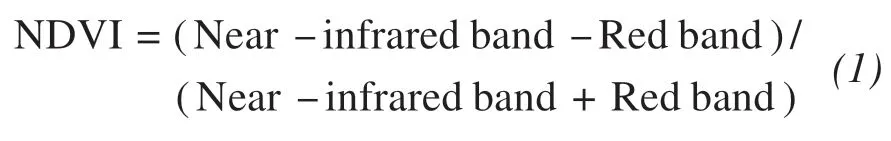
The NDVI values always range between -1 and+1,where negative values reflect the absence of vegetation. The NDVI values of vegetation are generally positive, with higher index values being associated with a greater green leaf area and biomass (Zhanget al.,2014).
Meteorological data from 2002 to 2015 were obtained from the National Ecosystem Research Network of China (http://www.cnern.org/index.action).Daily meteorological data include precipitation (PRE),solar radiation(RAD)and temperature(TEM).The annual and seasonal average values of climatic variables were calculated using daily measurements.
2.3 Data processes
2.3.1 Seasonal decomposition of the NDVI trend
Since the NDVI data in this study are long-term monthly time series data, they have characteristics of seasonal variation. Therefore, to decompose various variation components from the time series and objectively reflect the change pattern of the NDVI in the study period (2002-2015), we used the seasonal decomposition method to decompose the time series of the monthly average NDVI into trend, seasonal and residual components (IBM SPSS software, 20th version,Chicago,USA).The seasonal decomposition method is a filtering process based on a locally weighted scatterplot smoothing method (Yaffee and McGee, 2000). In this method, all kinds of changes in the time series are regarded as three kinds of comprehensive influences,namely, seasonal correction trends, seasonal variations and residuals, which are extracted and analysed; then,the results are integrated to form a general model of the original series, upon which the future situation is predicted.The mathematical expression of the seasonal decomposition model is as follows:

whereTtis the trend component,Stis the seasonal component,Ctis the cyclic variable component, andItis the random component;there are two kinds of functionf: the addition and multiplication models. In the analysis, the cyclic variation component and the longterm trend are generally considered together. The random component is usually assumed to be 0 in the addition model and 1 in the multiplication model.
Then, a change point analysis was used to find time change points decomposed in the long-term trend by the seasonal decomposition method (Killicket al., 2012).This method calculates the optimal positioning and potential number of change points in the dataset.
The average value of the change point analyser detection response variable changes with time, and follows the following steps: (1) in the whole time series,we determine whether there is at least one change point by looking for a time step that increases a change point and leads to a significant reduction in the mean square error; (2) we use the cumulative sum and bootstrapping(1,000 times)to calculate the confidence interval (95%); (3) if the confidence interval of the first change point coincides with the confidence interval of bootstrapping, then we do not consider the time series to have statistically significant change points in an academic sense;(4)otherwise,we use the previous steps to further segment the segment until the confidence interval of the recently added change point overlaps with the guidance time; and (5) finally,we use the reverse iteration method to remove points that are no longer significant after re-estimation (the significance level is 95%). If the data points reported by the CPA violate the assumption of an independent error structure (that is, the change point analyser can average the data points in a certain period of time),the time autocorrelation in the data is adjusted.
2.3.2 NDVI trend analysis
To reduce the impact of snowfall in winter,we analysed only the trend of the NDVI time series in the growing season period and gained insights into the contributions of each season to the change in growing season NDVI. The growing season was divided into three seasons: spring (April-May), summer (June-August) and autumn (September-October). The NDVI values of the growing season and of different seasons were calculated as the average of the NDVI during the corresponding months.
To detect and analyse climate variables and NDVI trends,the linear regression method and segmented regression were applied in data analysis software (OriginPro 2017 OriginLab Corporation, Massachusetts,USA). The slope estimated by the linear regression method indicated the mean temporal change in the studied variable. Positive slopes of the NDVI indicate increasing trends, which also refers to vegetation restoration in this research, while negative slopes indicate decreasing trends, which also refers to vegetation degradation in this research(Piaoet al.,2011;Fensholt and Proud, 2012).The linear regression method is described as follows:
whereyis the NDVI value or climate variable for each year from 2002 to 2015,tis the time period from 2002 to 2015,ais the intercept,bis the slope of the annual NDVI,andeis the random error.
We also used a segmented regression model to analyse trends in the monthly and annual NDVI and climate factors before and after the change point.Segmented regression is a piecewise regression in which the independent variables are partitioned,and a regression line is fit to each segment. Segmented regression analysis was applied to compare the directions of trends and slope values in the partitioned NDVI time series data based on change point analysis and the linear regression method(Kimet al.,2015).
2.3.3 Relationship analysis between climate factors and the NDVI
To analyse the revegetation response to different climatic factors, we established the relationships between the annual NDVI and climate variables by using partial correlation analysis because it measures the degree of association between two variables(e.g.,the NDVI and precipitation) without the influence of the other two climate factors (e.g., temperature and solar radiation)(Wenet al., 2017).Three climate factors(precipitation, temperature, and solar radiation) were considered in this study.The partial correlation coefficient(R)was deemed to be statistically significant at the 95%level. We also calculated the coefficient of determination (R2) to estimate the degree to which a dependent variable could be explained by the independent variables (Xuet al., 2017). To determine the most important climatic factor (MICF) that influenced the NDVI variation,the absolute R values of the three climate factors were ordered, and the factor with the maximum value was chosen as the MICF.
3 Results
3.1 Overall NDVI trend
The analysis of the NDVI time series revealed the trends and seasonality of VPS vegetation. Figure 2 illustrates the temporal variability in the NDVI and its seasonal characteristics in the VPS during 2002-2015.The monthly mean NDVI of the VPS showed one annual peak from July to September,and the pattern coincided with the timing of peak rainfall periods in the study area. The trend of the monthly mean NDVI dropped sharply in one year (2005) and then increased gradually with annual fluctuations (trend in Figure 2).Changes in the mean and variance in October 2005 were detected with change point analysis (change point). Then, the seasonal analysis and simple linear model showed that the monthly mean NDVI showed a slow increasing trend from 2002 to 2015 (0.48×10⁻³/a).However, the segmented regression model showed that the average monthly NDVI presented a slow decreasing trend (-8.4×10⁻³/a) before October 2005, while it changed to an increasing trend (3.6×10⁻³/a) from the next month until the end of the research period. The seasonal component fluctuates within 12 months and is completely consistent every year.The residual component of the NDVI decomposition ranged within 0.0798±0.034 during the entire study period.
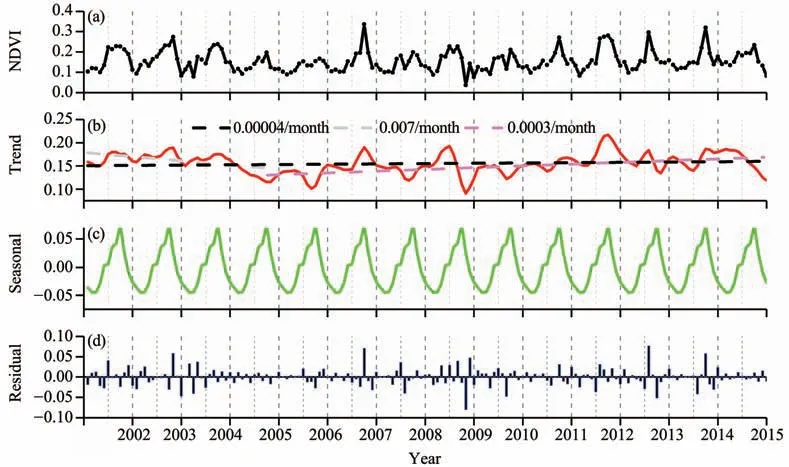
Figure 2 Plot of the monthly mean NDVI and its seasonal correction trend(trend),seasonal variation(seasonal),and residual components.The black dashed line represents a simple linear fit,and the light grey dashed line and the light magenta dashed line represent segmented regression before and after the change point(2005),respectively
3.2 Change point
The results of the change point analysis show that the direction of the cumulative sum control chart changed suddenly in October 2005, indicating a shift or change in the average at this point(Figure 3).Therefore, there was only one significant change point for the shifts in the long-term trend of the monthly NDVI.The change point for the monthly NDVI occurred in October 2005 and marked a shift from a mean value of 0.0033 to a mean value of 0.0076.Therefore,the change point separating the decreasing and increasing state was likely the change point that occurred in October 2005.Change points with confidence level higher than 91%are included, and the corresponding confidence interval is reported (1,000 bootstrap iterations). Changes in average measures the changes between mean values before and after a corresponding change point.
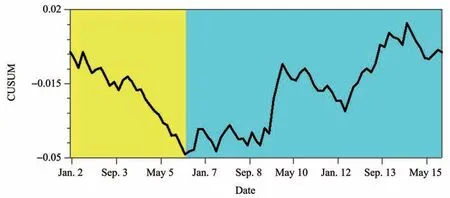
Figure 3 Cumulative sum chart of the NDVI standard deviation.Yellow and light blue represent the areas before and after the change point
3.3 Seasonal NDVI and climate factor trends
The linear regression method showed that the increasing trend in revegetation activity for the four phases of the year was observed over the entire study period, demonstrating that the overall state of revegetation in the area increased from 2002-2015, while the segmented regression model indicated a changing trend from a decrease before 2005 to an increase after 2005 (Figure 4a). The growing season precipitation decreased significantly at a rate of 68.155 mm/a in 2002-2005 but increased in 2005-2015, which was consistent with the growing season NDVI trend during the two periods. However, the overall trend of the NDVI was opposite that of precipitation from 2002 to 2015(Figure 4a).
For the spring NDVI, although it increased over the period 2002-2015,there were two distinct periods with a decelerating spring NDVI trend, which increased before and after 2005 (Figure 4b). First, the spring NDVI increased significantly at a rate of 0.0071/a from 2002 to 2005. Then, the spring NDVI increased slowly by 0.0053/a from 2005 to 2015 (Figure 4b). The spring temperature increased rapidly by 1.025 °C/a from 2002 to 2005 and then decreased by 0.07 °C/a from 2005 to 2015 (Figure 4b). Interannual variations in the spring NDVI were not consistent with those in temperature,precipitation and solar radiation (Figure 4b). Interannual variations in the summer NDVI and autumn NDVI were better described by the two-part piecewise linear regression model.Both the summer NDVI and autumn NDVI decreased in 2002-2005 but changed to increasing in 2005-2015(Figures 4c, 4d). Summer precipitation decreased rapidly at a rate of 30.2 mm/a from 2002 to 2005 but changed considerably from 2005 to 2015, which was consistent with the summer NDVI trend during the two periods(Figure 4c).
3.4 Relationship between the NDVI and climate factors
Partial correlation analysis showed that the growing season NDVI was positively correlated with the spring NDVI, summer NDVI and autumn NDVI. Furthermore, the growing season NDVI had the strongest correlation with the summer NDVI (Table 1). The growing season NDVI was positively correlated with precipitation for the period 2002 - 2015 (R=0.693,P=0.012). The spring NDVI had no significant relationship with climate factors (Table 2). The summer NDVI was positively correlated with precipitation(R=0.688,P=0.007) and negatively correlated with temperature (R=-0.600,P=0.023). Moreover, significantly negative relationships were established between the autumn NDVI and temperature (R=-0.622,P=0.018)(Table 2).

Figure 4 Interannual variations in the average(a)growing season,(b)spring,(c)summer and(d)autumn NDVI and the corresponding climate variables.The black dashed line indicates simple linear fits during the period 2002-2015.The light grey and light magenta dashed lines represent segment fits before and after the change point of the NDVI trend,respectively
4 Discussions
In this study,by using linear models,we found a persistent increase in the NDVI of the VPS in 2002-2015,while change point analysis and the segmented regression models showed that the NDVI trend should be divided into two parts (decreasing and increasing parts)based on the change point in late 2005 (Figure 2).This result suggested that the overall linear trend calculated by simple linear regression models could not accurately obtain the actual temporal pattern of revegetation activities during the study period (2002-2015).Furthermore, this result highlights the significance of long-term ecological research on the temporal responses of vegetation to climate change (Piaoet al.,2011). The long time series study of VPS stability also confirms that ecosystems require a long time to achieve the synchronization of cause (external drivers) and effect (reaching a new stable state) (Hugheset al.,2013;Chenet al.,2019).
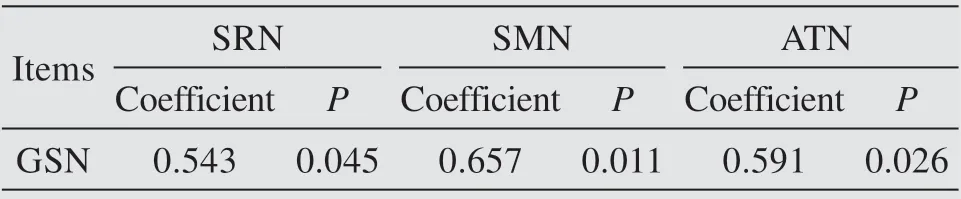
Table 1 Partial correlation analysis results of the NDVI in the growing season and the NDVI in spring,summer and autumn

Table 2 Partial correlation analysis results between the NDVI and climate factors in the growing season and in each season
However, the increasing trend in the NDVI was not significant. The NDVI was small in 2005 and 2010 (Figure 2), which could be attributed to our study area experiencing intense droughts in 2005 and 2010 during the growing season (Figure 2, Figure 4a).Drought significantly affects vegetation change by limiting photosynthesis (Krishnanet al., 2006), altering vegetation respiration (Evanset al., 2011) and changing vegetation mortality (Lloretet al., 2004). The decrease in rainfall (-1.156 mm/a) and the increase in temperature (0.0311 °C) in the growing season led to a slow growth of the NDVI in the VPS(Figure 2).
Furthermore, the changed trend in the growing season NDVI was largely attributed to summer and autumn NDVI changes (Table 1). This result was in line with the results of recent studies conducted in other regions (de Jonget al., 2012; Mohammatet al.,2013; Buermannet al., 2014), despite regional differences in the magnitudes of these trends and the turning point of the revegetation NDVI. Mohammatet al.(2013) found that the trend of NDVI greening has weakened since the 1990s in inland Asia, and summer is the earliest season that experiences the transition from greening to non-greening. Poulteret al. (2014)found that the trend change in the NDVI highlights the nonlinear response of revegetation to climate change in central Eurasia, which may have an important impact on the terrestrial carbon cycle and climate feedback.
The growing season NDVI and the NDVI in different seasons increased continuously, suggesting that, on the time scale of 14 years, the revegetation growth in the VPS showed an overall increasing tendency.This pattern was especially true in summer and autumn, when the rate of NDVI increase was relatively large. In particular, summer is the optimal season for revegetation growth.As mentioned above, revegetation growth is very sensitive to precipitation changes. Precipitation in summer showed a decreasing trend in the VPS over the period of 2002-2015 (Figure 4c). However, there is an increasing trend in the summer NDVI in the VPS (Figure 4c). This pattern suggests that the ecosystem is in a stable state and would not experience catastrophic changes under the influence of normal climate fluctuations. This result may be related to the BSC in the VPS.Previous studies have found that BSC may help plants (mainly shallow root herbs) establish and survive by providing safe microsites that buffer plants against drought and wind (Liet al.,2005;Thietet al.,2014;Songet al.,2017).
Our results suggest that climate change plays a major role in revegetation variations in the VPS in the growing season. The growing season NDVI has positive correlations with precipitation (Table 2). This result may indicate that revegetation growth in the growing season is mainly controlled by precipitation in arid and semiarid areas (Gessneret al., 2013). Precipitation reductions lead to a decrease in soil moisture, which in turn causes drought and reduces photosynthetic efficiency (Fensholtet al., 2012). In addition, the increase in temperature during the growing season,especially in summer,increases surface evapotranspiration, thereby increasing the soil water deficit(Quet al., 2016). We found that the negative correlations between the NDVI (summer NDVI and autumn NDVI) and temperature were stronger during the 2002-2015 period than in other periods. Continued warming in the absence of sustained increases in precipitation led to decreased revegetation growth in the growing season from 2002 to 2005(Figure 4).The correlation coefficients of the solar radiation data were 0.544, 0.431, -0.234 and 0.330 in the growing season,spring, summer and autumn, respectively (Table 2).These results suggest that there was no significant correlation between solar radiation and the NDVI in each season.Similarly,precipitation was the main climate driver of revegetation growth in summer (Figure 4, Table 2).The summer NDVI was positively related to precipitation and negatively related to temperature (Figure 4).This result indicates that warming in water-limited ecosystems has a negative effect on vegetation growth.(Xuet al.,2016)showed that the recent decline in vegetation in Central Asia was related to the decrease in precipitation and the increase in temperature,which led to an increase in the water deficit in summer. The autumn NDVI showed similar interannual variations with the growing season and summer NDVI but was not correlated with autumn precipitation and solar radiation(Table 2). Interestingly, we found negative correlations between autumn NDVI and autumn temperature(Figure 4,Table 2), implying that revegetation may have a short active period after temperature decreases in autumn.
Therefore, we concluded that the main factors affecting the NDVI were decreasing precipitation and increasing temperature, which may cause severe drought.(Barriopedroet al.,2012)found that the NDVI was severely affected by extreme summer and autumn droughts, which may result in a non-significant increasing trend in revegetation activity, especially in northern China.However,in this study,the NDVI presented a slow upward trend when the rainfall tended to decrease and the temperature continued to rise on the 14-year research scale.This result may be attributed to the establishment of the VPS and the restoration of the ecosystem;the ecosystem has been in a relatively stable state after more than 50 years. The improvement in soil properties may also be an important factor for the stabilization of the VPS. Previous studies have found that the soil physicochemical properties(e.g., water holding capacity, bulk density, and total carbon)in the VPS strongly resembled the soils of native vegetation (Liet al., 2010). With the reduced wind erosion initiated by the revegetation project,biocrust survived, and its cover and thickness increased over time (Chenet al., 2019). The growth in the biocrust increased the water holding capacity of the shallow soil layer (the top 40 cm), eventually decreasing the infiltration to deeper soil layers (Liet al., 2014).Greater rainfall retention in the shallow soil layer mainly benefits shallow-rooted grasses because shrub roots are concentrated in deeper soils(Chenet al.,2019).
5 Conclusions
In summary, revegetation growth is regulated by water and heat conditions, and revegetation growth sensitivity to water and heat varies significantly in different seasons. In spring, temperature is the dominant limiting factor for revegetation growth in the VPS,and in summer and autumn, revegetation is mainly constrained by precipitation. The NDVI decreased in 2002-2005 due to drought stress strengthened by reduced precipitation and warming. In studies focusing on the long NDVI time sequence, trend analysis during the seasonal time series may contribute to a better and deeper understanding of the NDVI changes. We also showed that the NDVI of the restored VPS can be effectively monitored and evaluated using a satel-
lite-derived vegetation index. This remote sensing dataset can clarify the relationships and influences of climatic factors on ecosystem productivity. The expansion of remote sensing applications in restoration ecology will enhance our in-depth understanding of ecosystem responses to ecosystem restoration. In addition, our understanding of long-term ecosystem restoration is enhanced by providing another common example of dry land restoration. However, due to the strong temporal variability of the vegetation activity,the lack of temporal resolution leads to potential uncertainty for the Landsat 7 data used in meso-and micro-scale study areas. Therefore, we should consider both temporal and spatial resolution in future studies to complement the advantages of Landsat and Modis ndvi data, which still depends on further development of image processing technology.
Acknowledgments:
The authors gratefully acknowledge the editor and two anonymous reviewers for valuable comments on the manuscript. We also acknowledge DingHai Zhang for their help in the data analysis.This work was supported by the Funds for Creative Research Groups of China (Grant No. 41621001), the National Natural Science Foundation of China (Grant Nos. 41530746;41901064) and the Foundation for Excellent Youth Scholars of NIEER,CAS.
 Sciences in Cold and Arid Regions2021年1期
- Sciences in Cold and Arid Regions的其它文章
- Constitutive models and salt migration mechanisms of saline frozen soil and the-state-of-the-practice countermeasures in cold regions
- Simulated effect of soil freeze-thaw process on surface hydrologic and thermal fluxes in frozen ground region of the Northern Hemisphere
- Direct incorporation of paraffin wax as phase change material into mass concrete for temperature control:mechanical and thermal properties
- The evapotranspiration and environmental controls of typical underlying surfaces on the Qinghai-Tibetan Plateau
- Evaluating effects of Dielectric Models on the surface soil moisture retrieval in the Qinghai-Tibet Plateau