
Simulated effect of soil freeze-thaw process on surface hydrologic and thermal fluxes in frozen ground region of the Northern Hemisphere
2021-03-25 06:07DiMaSiQiongLuoDongLinGuoShiHuaLyuXianHongMengBoLiChenLiHuiLuo
Di Ma,SiQiong Luo,DongLin Guo,ShiHua Lyu,XianHong Meng,BoLi Chen,LiHui Luo
1. Key Laboratory for Land Surface Process and Climate Change in Cold and Arid Regions, Northwest Institute of Eco-Environment and Resources,Chinese Academy of Science,Lanzhou,Gansu 730000,China
2.College of Atmospheric Sciences,Lanzhou University,Lanzhou,Gansu 730000,China
3. Nansen-Zhu International Research Center, Institute of Atmospheric Physics, Chinese Academy of Sciences, Beijing 100029,China
4. School of Atmospheric Sciences, Plateau Atmosphere and Environment Key Laboratory of Sichuan Province, Chengdu University of Information Technology,Chengdu,Sichuan 610225,China
5.Changzhou Meteorological Bureau,Changzhou,Jiangsu 213000,China
6. State Key Laboratory of Frozen Soils Engineering, Northwest Institute of Eco-Environment and Resources, Chinese Academy of Sciences,Lanzhou,Gansu 730000,China
ABSTRACT Soil freeze-thaw process is closely related to surface energy budget, hydrological activity, and terrestrial ecosystems. In this study, two numerical experiments (including and excluding soil freeze-thaw process) were designed to examine the effect of soil freeze-thaw process on surface hydrologic and thermal fluxes in frozen ground region in the Northern Hemisphere based on the state-of-the-art Community Earth System Model version 1.0.5. Results show that in response to soil freeze-thaw process, the area averaged soil temperature in the shallow layer (0.0175-0.0451 m) decreases by 0.35 ℃in the TP (Tibetan Plateau), 0.69 ℃in CES (Central and Eastern Siberia), and 0.6 ℃in NA (North America)during summer, and increases by 1.93 ℃in the TP, 2.28 ℃in CES and 1.61 ℃in NA during winter, respectively.Meanwhile,in response to soil freeze-thaw process,the area averaged soil liquid water content increases in summer and decrease in winter. For surface heat flux components, the ground heat flux is most significantly affected by the freeze-thaw process in both summer and winter, followed by sensible heat flux and latent heat flux in summer. In the TP area, the ground heat flux increases by 2.82 W/m2 (28.5%) in summer and decreases by 3.63 W/m2 (40%) in winter. Meanwhile,in CES,the ground heat flux increases by 1.89 W/m2(11.3%)in summer and decreases by 1.41 W/m2(18.6%)in winter.The heat fluxes in the Tibetan Plateau are more susceptible to the freeze-thaw process compared with the high-latitude frozen soil regions. Soil freeze-thaw process can induce significant warming in the Tibetan Plateau in winter.Also, this process induces significant cooling in high-latitude regions in summer.The frozen ground can prevent soil liquid water from infiltrating to deep soil layers at the beginning of thawing; however, as the frozen ground thaws continuously, the infiltration of the liquid water increases and the deep soil can store water like a sponge,accompanied by decreasing surface runoff. The influence of the soil freeze-thaw process on surface hydrologic and thermal fluxes varies seasonally and spatially.
Keywords:freeze-thaw effect;hydrologic and thermal;frozen ground;Northern Hemisphere
1 Introduction
Frozen ground includes permafrost and seasonally frozen ground(Lachenbruch and Marshall,1986).Permafrost is distributed in high-latitude and high-elevation regions, and occupies nearly one quarter of exposed land ground of the Northern Hemisphere(Zhanget al., 2008; Slater and Lawrence, 2013).As a main component of the cryosphere, frozen ground is extremely sensitive and vulnerable to climate change(Romanovskyet al., 2010; Slater and Lawrence,2013; Luoet al., 2016; Luoet al., 2017). Previous studies indicated that frozen ground has potential impacts on hydrology and water resources (Cuoet al.,2015; Liljedahlet al., 2016), ecosystems (Yanget al.,2010; Guoet al., 2011a,b), climate change (Burkeet al., 2013; Kovenet al., 2015; Schuuret al., 2015),and human infrastructure (Nelsonet al., 2001; Guo and Sun,2015;Guo and Wang,2016).
One of the important characteristics of frozen ground is seasonal soil freeze-thaw process (Liet al.,2002a, b; Poutouet al., 2004; Yanget al, 2007).Freezing and thawing process, accompanied by frequent phase transitions of water in soil, not only affects the thermal condition of soil, but also impacts energy and water exchanges between the surface and atmosphere due to different thermal capacities and conductivities between solid and liquid water (Liet al.,2002b; Luoet al., 2009; Guoet al., 2011a; Liet al.,2012; Chenet al., 2014). To quantify these influences,it is important in understanding the role of frozen ground in land-atmosphere interaction and climate.
The methods related to theoretical computations and observational data analyses were used to study the impact of soil freeze-thaw processes on the surface energy and water cycle at an observation site or permafrost watershed scale (Ishikawaet al., 2006;Yamazakiet al., 2006). Liet al.(2002a,b) found that the heat-exchange rate between ground surface and atmosphere during the freezing and thawing season can be twice more than those without a phase change. It indicated that the freeze-thaw process could affect regional hydrological processes in permafrost regions of Alaska and Siberia (Liet al., 2002a,b;Yamazakiet al., 2006). It also shows that near-surface soil freezethaw processes play an important role in diurnal variation of surface latent heat flux.Guoet al.(2011a,b)indicated that seasonal soil freeze-thaw process significantly affect surface heat fluxes on the Tibetan Plateau, and this effect is more significant during soil freezing stage than during thawing stage.
More recently, an advanced study by Chenet al.(2014) investigated the effect of soil freeze-thaw process on regional climate on the Tibetan Plateau using the land-atmosphere coupled numerical model of RegCM4. Their results indicate that frozen soil buffers seasonal changes in soil and near-surface temperatures and can strengthen the energy exchange between soil and atmosphere via the freeze-thaw process.
Considering the important role of soil freeze-thaw cycle in surface energy budget, hydrological activity,and terrestrial ecosystems, in this study we expanded the previous study of Chenet al. (2014) at the Northern Hemisphere frozen ground region as a whole. To quantify the effect of soil freeze-thaw process on surface hydrology and heat fluxes in frozen ground region of the Northern Hemisphere, the Community Earth System Model version 1.0.5 was used and two numerical experiments were conducted: control run(include the soil freeze-thaw effect) and sensitive run(exclude the soil freeze-thaw effect).
2 Models and experiment designs
2.1 Model description
The model used in this study is the Community Earth System Model version 1.0.5 (CESM1.0.5),which is a coupled climate model for simulating the Earth's climate system. This model can reproduce the main spatial pattern and magnitude of mean climate.The CESM model is composed of four separate models,the combination of which can simultaneously simulate the Earth's atmosphere, oceans, land ice and sea ice. For atmosphere component, both CAM4 and CAM5 are available in CESM1.The land component,the Community Land Model (CLM4.0), is maintained at the National Center for Atmospheric Research(NCAR)and was developed by the CESM Land Model Working Group(LMWG).Compared to former version's, the parameterizations and structure of CLM4.0 include updates to soil hydrology, soil thermodynamics, the snow model, albedo parameters, and the River Transport Model. CLM4.0 includes 15 ground layers with five additional hydrologically inactive ground layers (Lawrenceet al., 2008). In this version, the hydrology scheme has been modified to include revised evaporation parameterization and a revised numerical solution of the Richards equation (Sakaguchi and Zeng, 2009; Zeng and Decker, 2009). In addition, a representation of the thermal and hydraulic properties of organic soil, which operates in conjunction with mineral soil properties, is introduced in CLM4.0(Lawrence, 2008). The snow model has five resolved layers with state variables of ice density, water density, temperature and deposited aerosol concentration(Flanneret al.,2007;Lawrenceet al.,2011).
2.2 Experiment design
To quantify the impact of the soil freeze-thaw process on surface hydrologic and thermal fluxes, two simulations were designed: control run (including the soil freeze-thaw effect) (CTL) and sensitive run (excluding the soil freeze-thaw effect)(NSFT).Both simulations selected an active atmosphere model(CAM4.0),an active land model(CLM4.0),a thermodynamic-only sea ice model, and a data ocean model.These two simulations use the climatological presentday sea surface temperatures (SSTs). The model resolution is designed as f19_g16,with a finite volume dynamical core and a horizontal resolution of 1.9°×2.5°for land and atmosphere component. Also, the atmosphere and land components' timestep are 1,800 seconds. For ocean and sea ice components, the grid is 1.125 degrees in the zonal direction (320 points) and roughly 0.5 degrees in the meridional direction with higher resolution near the equator(Collinset al.,2006).
In CLM4.0, the parameterization scheme of the thaw process in the soil layers is expressed as follows:if the soil temperature (Ts) is higher than the freezing temperature of water (Tf, 273.15 K) and the soil ice mass(wice)is greater than zero,then the soil ice melts.
In CLM4.0,wliq,maxis defined as the maximum liquid soil water mass when the soil temperature is below the freezing temperature. When the soil temperature is lower than the freezing temperature of water and the soil liquid mass is greater than the maximum liquid soil water mass, then the soil liquid water begins to freeze.

Here,wsatis saturated soil water content,Lfis the latent heat of fusion,gis the gravitational acceleration,ψsatis the soil texture dependent saturated matric potential andBiis Clapp and Hornberger exponent.
In the sensitive simulation (NSFT), we close the soil freeze-thaw process through removing these three equations in phase change part of soil temperature's source code. In the CTL run, the freeze-thaw process occurs, whereas in the NSFT, it does not. Thus, for NSFT in the soil layers, the water phase change does not occur, even if the soil temperature is lower than the water freezing temperature. In other words, the soil ice content is fixed in NSFT. All simulations are conducted for 23 years from the same initial equilibrium state, and the last 20 years are averaged and analyzed. Both simulations start from December 31. The initial condition of soil ice of NSFT is the condition on December 31, which is the same to that of CTL.The difference between CTL and NSFT (CTL-NSFT)reveals the impact of the freeze-thaw effect in the twentieth century. To better understand the freeze-thaw effect on soil temperature and soil water at different depths,we selected three layers to represent the surface(0.0175-0.0451 m), shallow (0.1655-0.2891 m) and deep (0.8289-1.3828 m) layers. In this text, all differences described are statistically significant at theP<0.1 level,based on T test,unless stated otherwise.
3 Results
3.1 Soil ice and liquid water contents
The soil freeze-thaw process significantly impacts soil ice and soil liquid water contents, and these influences vary regionally and seasonally.Figures 1a and 1c show that, as the frozen soil thaws, soil ice contents significantly decrease in the shallow and medium layers in high-latitude regions in JJA (June-July-August).However, the soil ice contents at the deep layer increase in parts of Siberia and North America (NA)and decreases in the TP in JJA (Figure 1e). The soil ice contents change slightly in DJF (December-January-February) in all the layers, which is mainly due to that soil ice contents are fixed to the value on the simulation start date of December 31 in NSFT.
Correspondingly, as the frozen soil melts, soil liquid water contents in both shallow and medium layers increase in most of the high-latitude regions, including Central and Eastern Siberia (CES), the TP, and NA, during JJA (Figures 2a and 2c). During DJF, as the soil liquid water freezes, soil liquid water contents decrease in most of the high-latitude regions in the medium layer(Figure 2d).Unlike the soil liquid water in the medium layer, the soil liquid water in the shallow layer changes slightly during DJF (Figure 2b).The main reason for this change is the small amount of soil liquid water in the shallow layer. Here, note that the freeze-thaw effects on the soil liquid water and the soil ice content in the deep layer differ from those in the upper and medium layers during JJA. In the deep layer, the soil liquid water decreases over CES and NA and increases over the TP in summer(Figure 2e). In addition, soil ice contents increase over Siberia and NA and decreases over the TP in summer (Figure 1e). The underlying reason for these phenomena will be described in the next paragraph.
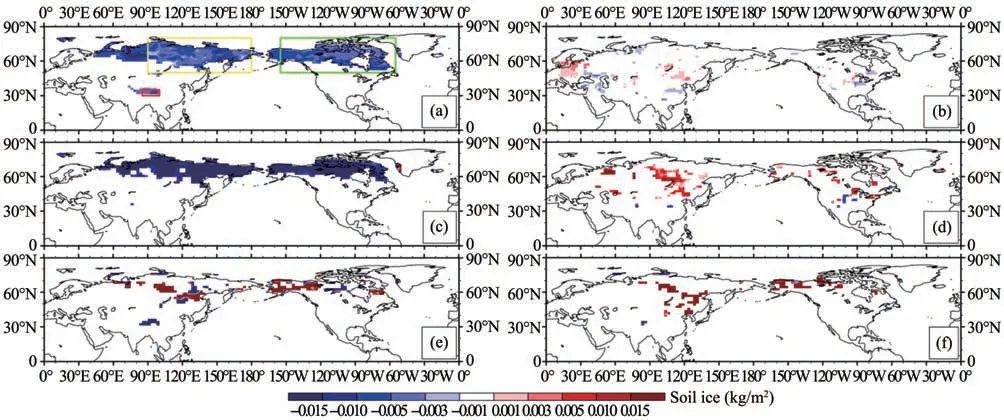
Figure 1 Differences between CTL and NSFT experiments(CTL-NSFT)of the soil ice(kg/m2)in three layers during JJA(left)and DJF(right):(a,b)shallow layer,(c,d)medium layer,and(e,f)deep layer.Yellow box indicates CES(Central and East Siberia);red box indicates NA(North America);red box indicates TP(Tibet Plateau).Colors indicate statistically significant changes(P<0.1)
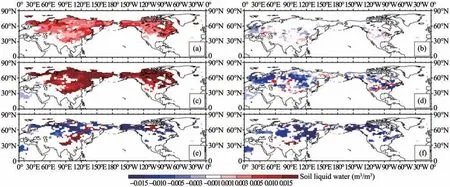
Figure 2 Differences between the CTL and NSFT(CTL-NSFT)experiments of the soil liquid water(m3/m3)in three layers during JJA(left)and DJF(right):(a,b)shallow layer,(c,d)medium layer,and(e,f)deep layer.Colors indicate statistically significant changes(P<0.1)
Three specific regions:TP(Tibet Plateau,30°N-35°N,85°E-100°E), NA (North America, 50°N-80°N,55°W-155°W) and CES (Central and East Siberia,50°N-80°N,90°E-180°E)(Figure 1)have been selected considering the different effect for the soil freezethaw process in different regions. Figure 3 shows that all frozen soil thaws, beginning with the top layer. In NA, the frozen soil starts thawing in the top layer after mid-April, the medium layer in approximately May, and the deep layer after July (Figures 3a1, 3a2,3a3). Also, the lower layers freeze or thaw later than the upper layers by as much as a week or a hundred days. In addition, these figures show that for all three regions, the frozen duration deceases with depth. For example, in NA, frozen durations of the top, medium,and deep layers are approximately eight months, seven months and four months, respectively. Moreover,Figure 3 shows that the freeze start date, thaw start date and freeze duration are different for different regions. Since the TP is located at middle latitudes and NA and CES are located at high latitudes, the TP receives more solar radiation and has a longer summer than the other two regions.This means that active layer thickness in the TP is deeper than that in NA and CES.The freeze duration in the TP is shorter than those in NA and CES in the same layer. The thaw start date in the TP is earlier than those in NA and CES by more than one month at the same layer. In the deep and medium layers, the thaw start dates are approximately April-May in NA and CES. However, in the deep layer, the thaw start date does not occur until late June in NA and CES. This means that in the deep layer, the soil does not start to thaw in JJA in NA and CES,however in the TP, the deep soil is already thawing. Thus,in the deep layer, soil ice contents increase in NA and CES during JJA and decrease in the TP(Figure 2e).
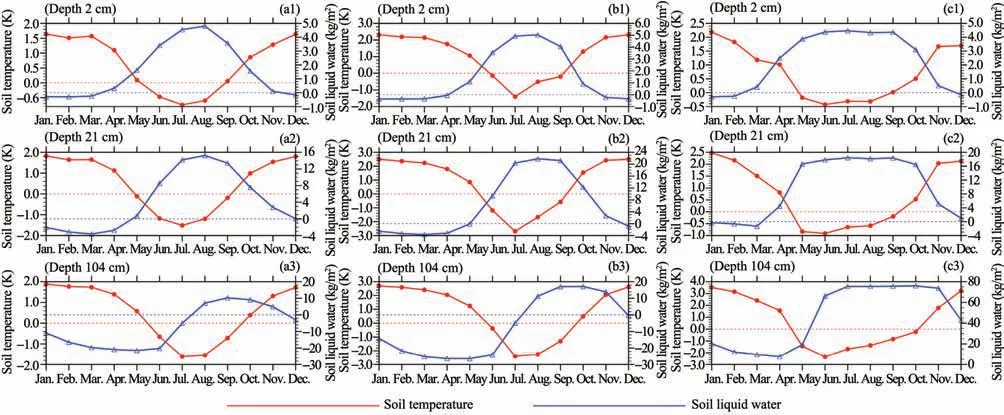
Figure 3 Simulated differences between CTL and NSFT(CTL-NSFT)of the soil temperature and soil liquid water at three different depths,which are area averaged over three specific regions of(a1,a2,a3)NA,(b1,b2,b3)CES,and(c1,c2,b3)the TP
3.2 Soil temperature
Compared to results from NSFT, the soil temperature changes significantly in high latitude regions. As the soil ice thaws, this phase change consumes heat,and as a result, the soil temperature decreases consistently during JJA (Figures 4a, 4c and 4e). The regions where soil temperature reduction mainly occurs include CES,the TP,and most of NA.Furthermore,in response to the thaw effect, the magnitude of the soil temperature reduction increases with depth. In NA, in the top,middle,and lower layers,the soil temperature decreases by 0.6 ℃,1.3 ℃,and 1.27 ℃,respectively.Meanwhile,over the CES region, the soil temperature decreases by 0.69 ℃, 1.85 ℃and 1.68 ℃in the top, middle, and lower layers, respectively. Finally, in the TP, the soil temperature decreases by 0.35 ℃, 0.72 ℃and 1.81 ℃in the top,middle,and lower layers,respectively.
In contrast with the boreal summer, as the soil liquid water freezes,the soil temperature in all three layers increases consistently in high-latitude regions in DJF (Figures 4b, 4d, and 4f). The results show that the soil temperature increases in CES, the TP, and most of NA.In NA,the soil temperatures of top, middle and lower layers increase by 1.61 ℃, 1.76 ℃and 1.80 ℃, respectively. Meanwhile, in CES, the soil temperatures of the top, middle, and lower layers increase by 2.28 ℃, 2.46 ℃and 2.63 ℃, respectively.Finally, in the TP, the soil temperatures in these three layers increase by 1.93 ℃, 2.29 ℃and 3.32 ℃,respectively.
Correspondingly, both the surface temperatures and 2-m air temperatures are significantly altered by the freeze-thaw effect. The surface temperatures significantly decrease by 0.44 ℃in CES and 0.41 ℃in NA during JJA(Table 1). Meanwhile, 2-m air temperatures decrease by 0.44 ℃in CES and 0.45 ℃in NA during JJA. During DJF, in the TP, 2-m air temperature and surface temperature significantly increase by 1.57 ℃and 1.75 ℃,respectively.
3.3 Surface energy budget
Note that all energy fluxes directed toward the air are defined as positive in this paper. The soil freezethaw process significantly impacts the surface energy budget,including the ground heat flux,latent heat and sensible heat flux.In summer,in response to the thawing process, the soil absorbs energy from the air, and as a result,the ground heat flux increases significantly in high-latitude regions of the Northern Hemisphere and part of the TP (Figure 5a). In contrast, in winter,because of the freezing process, the soil releases energy to the air, and thus, the ground heat flux decreases in high-latitude regions of the Northern Hemisphere and part of the TP(Figure 5b).
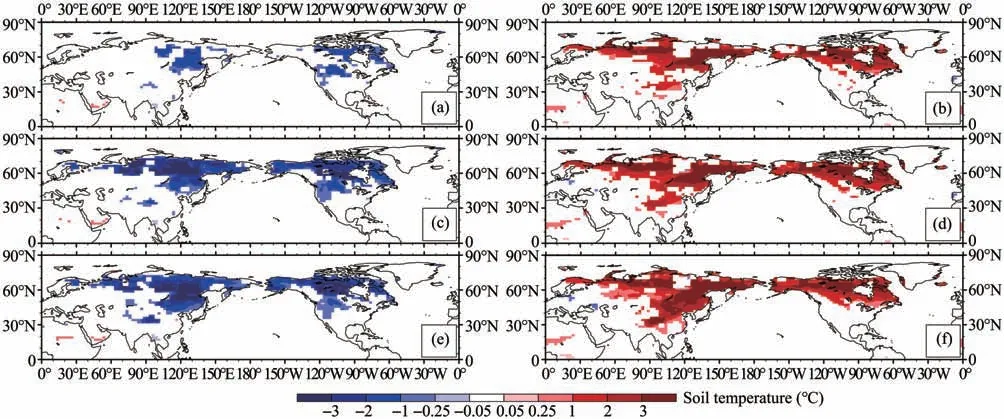
Figure 4 Differences between the CTL and NSFT experiments of the soil temperature(℃)in three layers during JJA(left)and DJF(right):(a,b)shallow layer,(c,d)medium layer,and(e,f)deep layer.Colors indicate statistically significant changes(P<0.1)
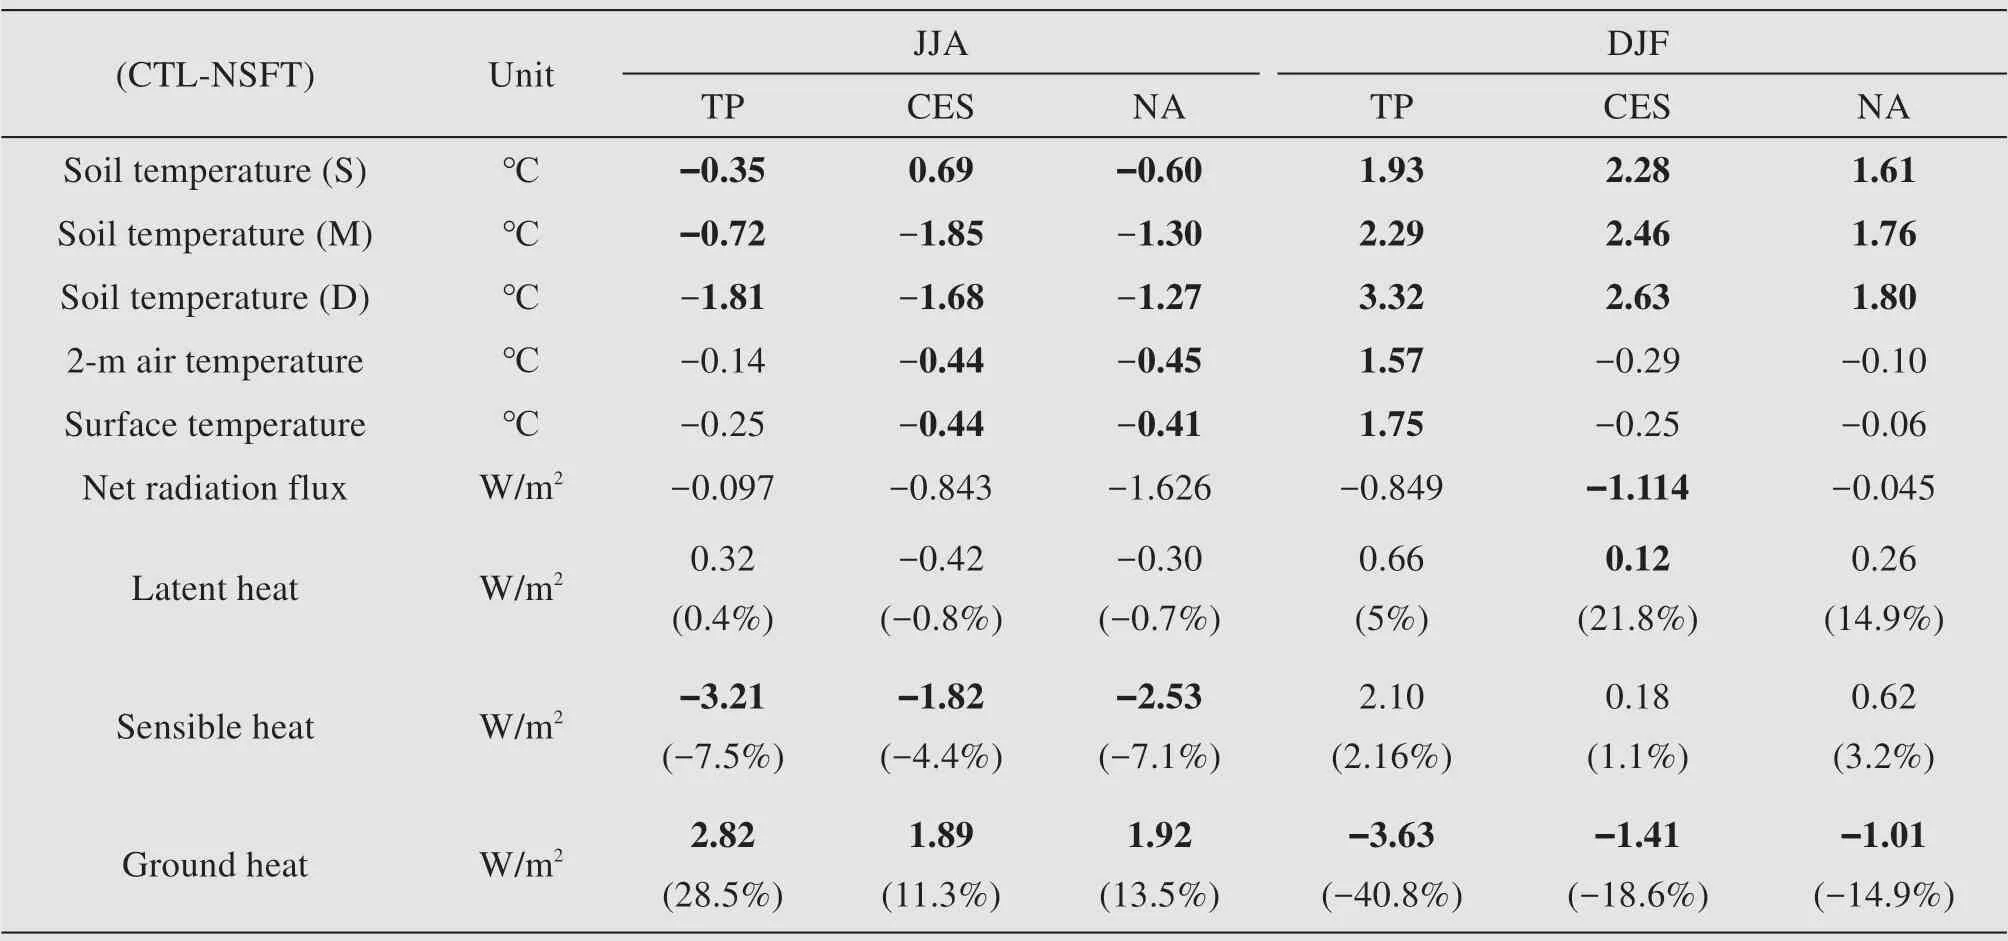
Table 1 Differences between the CTL and NSFT experiments(CTL-NSFT)for variables during the summer(JJA)and winter(DJF),averaged over the TP,CES and NA
Figure 6 shows that the amplitude of the ground heat flux is the largest component of the surface energy budget in the three regions.In NA,the ground heat flux increases by 1.92 W/m2(13.5%) in JJA and decreases by 1.01 W/m2(14.9%) in DJF (Table 1). In CES, the ground heat flux increases by 1.89 W/m2(11.3%) in JJA and decreases by 1.41 W/m2(18.6%)in JJA. Meanwhile, in the TP, the ground heat flux increases by 2.82 W/m2(28.5%) in JJA and decreases by 3.63 W/m2(40.8%) in DJF (Table 1). This shows that the variation of ground heat flux account for 28.5% and 40.8% over the TP in CTL in JJA and DJF,respectively (Table 1). This also indicates that among the three regions, ground heat flux in the TP is the most sensitive variable to the effect of the freeze-thaw process.
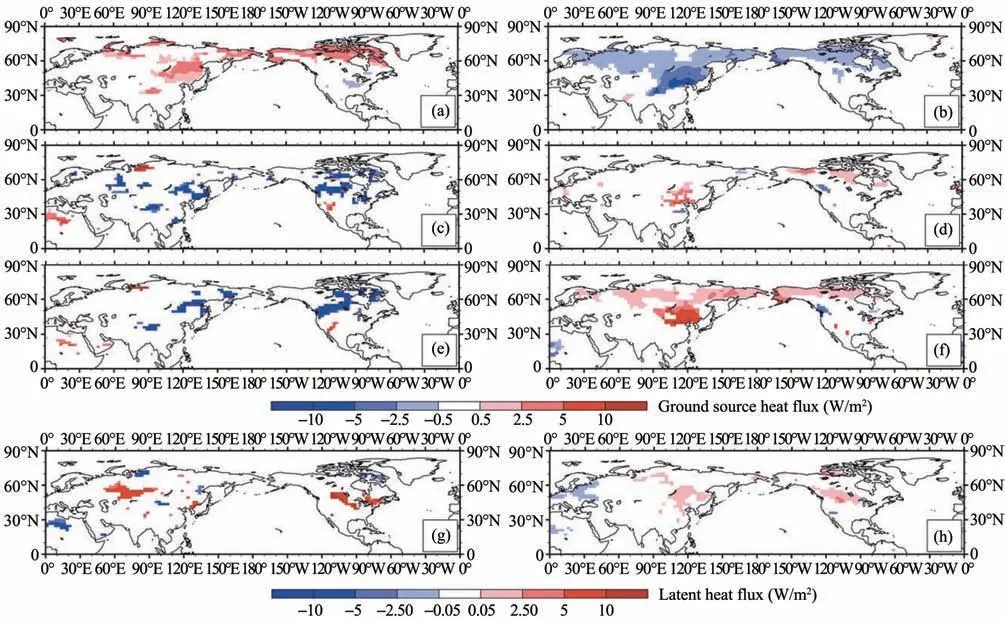
Figure 5 Differences between the CTL and NSFT(CTL-NSFT)experiments of the ground heat flux(a,b),sensible heat flux(c,d),ground source heat flux(e,f)and latent heat flux(g,h),(Unit:W/m2).Left column is in JJA;right column is in DJF.Colors indicate statistically significant changes(P<0.1)
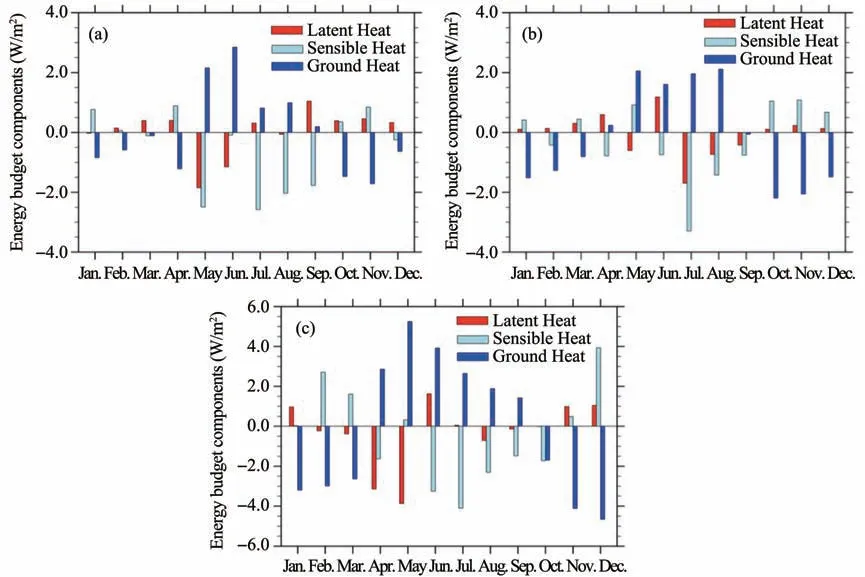
Figure 6 Simulated differences between CTL and NSFT(CTL-NSFT)of the energy budget components,including latent heat,sensible heat and ground heat,in the three specific regions of(a)NA,(b)CES,and(c)TP
Correspondingly, the soil freeze-thaw process also affects the sensible heat flux and latent heat flux. Because of difference of the lower ground and near surface layer temperature, the sensible heat flux decreases in most of the high-latitude regions and the TP during JJA (Figure 5c). In JJA, the sensible heat flux significantly decreases by 3.21 W/m2(7.5%), 1.82 W/m2(4.4%), and 2.53 W/m2(7.1%), in the TP, CES and NA, respectively. In contrast, the higher surface temperature increases the sensible heat flux in some of the high-latitude regions during DJF (Figure 5d). In DJF,the sensible heat flux increases by 2.10 W/m2(2.16%),0.18 W/m2(1.1%), and 0.62 W/m2(3.2%) in the TP,CES and NA, respectively. The latent heat flux increases in parts of high-latitude regions during JJA because of sufficient soil moisture supply (Figure 5g).During DJF, the higher temperature increases the latent heat flux in parts of NA and CES (Figure 5h).Table 1 shows that the latent heat flux change is not significant in NA, CES, and TP region in both JJA and DJF, except for CES in DJF. Compared to the ground heat flux variation,all of the sensible heat flux and latent heat flux variations are small(Table 1).
The ground source heat flux is defined as the sum of sensible heat flux, latent heat flux, and net longwave radiation. By studying the ground source heat,we can directly determine how much energy is transported from the ground to the air. During JJA, in response to the freeze-thaw process, the ground source heat significantly decreases in the TP,and parts of CES and NA(Figure 5e).In contrast,the ground source heat increases over most of CES and NA during DJF (Figure 5f).This result indicates that,because of the freezethaw process,the ground releases energy to the air during JJA and receives energy from the air during DJF.In other words, frozen soil can buffer the local climate by adjusting the surface energy budget.
3.4 Surface hydrological process
The freeze-thaw process can also significantly change the local water cycle.On the whole,the freezethaw process can limit precipitation over the three frozen soil regions. The freeze-thaw process can reduce precipitation in winter and early summer in NA(Figure 7a).The main reason is that there is anomalous descent in response to summer cooling during this season over NA region(Figure 8a).Figure 7a shows that the freezethaw process can enhance precipitation during late summer and early autumn over NA. The main reason is that there is anomalous ascent from 1,000 hPa to 250 hPa over NA during the same season (Figure 8a). The same as for NA,precipitation significantly decreases in winter in CES in response to freeze-thaw process (Figure 7b). This is mainly because of the decrease in precipitable water (Figure omitted). Figure 7c shows that precipitation significantly decreases in spring, summer and early autumn over the TP.The reason is that anomalous descent over the TP is due to summer cooling(Figure 8c). In addition, the impact of the freeze-thaw process on evaporation is slight in all three regions(Figures 7a,7b and 7c).
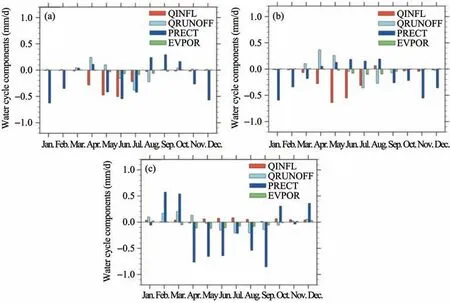
Figure 7 Simulated differences between CTL and NSFT(CTL-NSFT)of the water cycle components,including infiltration,runoff,precipitation,and evaporation,in the three specific regions of(a)NA,(b)CES,and(c)TP

Figure 8 Simulated differences between CTL and NSFT(CTL-NSFT)in the vertical profiles of vertical motion,in the three specific regions of(a)NA,(b)CES,and(c)TP(Pa/s)
Meanwhile, infiltration and runoff can also be influenced by the freeze-thaw effect. Runoff and infiltration of the two simulations in the three different regions are presented in Figure 9.The seasonal cycle of runoff in NA and CES looks similar (Figures 9a and 9b). As the temperature increases, runoff increases sharply in approximately March and peaks in approximately June in NA and CES (Figures 9a and 9b). The runoff peak occurs in August in the TP region, two months later than that in NA and CES (Figures 9c).The shaded area shows that during summer, runoff in NSFT is larger than that in CTL in all of the three regions (Figures 9a, 9b, 9c). Meanwhile, shading area shows that infiltration in CTL is larger than that in NSFT in all of the three regions (Figures 9d, 9e, 9f).From March to mid-May, runoff in CTL is larger than that in NSFT because at the beginning of the thawing season,the presence of soil ice can prevent part of the water produced by snow melting from infiltrating into deep soil, causing runoff in CTL to be greater than that in NSFT. During the peak runoff period, from June to September,runoff in NSFT is greater than that in CTL (Figures 9a and 9b). Meanwhile, Figures 9d and 9e shows that infiltration in CTL exceeds that in NSFT from July to September. The period during which runoff decreases and infiltration increases almost overlaps. This observation indicates that during summer, the thawing of soil ice leads to increased infiltration and decreased runoff. Figures 9a, 9b also show that runoff in CTL is significant lager than that in NSFT from March to June. During the same time,infiltration in CTL is significant less than that in NSFT.This observation indicates that at the beginning of thawing, due to the presence of frozen soil, infiltration is restrained, and runoff can be enhanced. Once the entire frozen soil has completely thawed, infiltration in CTL is larger than that in NSFT, and then, the soil acts like a sponge,i.e., runoff in CTL is smaller than that in NSFT. In other words, during the early thawing stage, the frozen soil can induce more runoff and less infiltration. Once the deep frozen soil has thawed, runoff will decrease because of increased infiltration.
Unlike NA and CES,the runoff peak in the TP occurs in approximately August. Figure 9c also shows that the freeze-thaw process increases runoff because the unfrozen soil is very effective in preventing the water from infiltrating. Infiltration increases and runoff decreases in the same period. However, the lower latitude leads the active layer thickness of the TP exceeds that in NA and CES,the soil infiltration increases earlier in the TP than in the other two regions.

Figure 9 Runoff(first row)and infiltration(second row)in CTL and NSFT simulations in three specific regions:(a,d)NA,(b,e)CES,and(c,f)the TP.For runoff,with the shaded area indicating that runoff in NSFT is larger than that in CTL;and infiltration,with the shaded area indicating that infiltration in CTL is larger than that in NSFT
4 Conclusions and discussions
This study demonstrates that the freeze-thaw process substantially impacts the energy and hydrologic exchange over the Northern Hemisphere. The soil freeze-thaw process regulates the ground thermal budget. During the freeze-thaw process, the ground releases energy to the air during the melting season and receives energy from the air during the freezing season. Among the surface energy budget fluxes, the ground heat flux is most affected by the freeze-thaw process in both summer and winter, followed by the sensible heat flux in summer; the effect on the latent heat flux in summer is slight. It also found that the ground heat flux of the TP region is the most sensitive variable among those of the three main permafrost regions. In the TP area, the ground heat flux increases by 2.82 W/m2(28.5%) in summer and decreases by 3.63 W/m2(40%) in winter. Meanwhile, in CES area,the ground heat flux increases by 1.89 W/m2(11.3%)in summer and decreases by 1.41 W/m2(18.6%) in winter. Also, in response to soil freeze-thaw process,the area averaged soil temperature in the shallow layer (0.0175-0.0451 m) decreases by 0.35 ℃in the TP(Tibetan Plateau), 0.69 ℃in CES (Central and Eastern Siberia),and 0.60 ℃in NA(North America)during summer, and increases by 1.93 ℃in the TP,2.28 ℃in CES and 1.61 ℃in NA during winter,respectively.
In addition, the soil freeze-thaw process significantly impacts the local hydrological cycle.The influence of the freeze-thaw process on evaporation is slight; in contrast, the influence of the soil freezethaw process on runoff and infiltration is significant.The primary reason for this phenomenon is that the presence of ice in the soil can prevent soil water from infiltrating into the deeper soil during the freezing season and can store water similar to a sponge during the warm season.As the temperature increases,the frozen soil begins to thaw, causing an increasing amount of soil water to infiltrate into the deep soil. After the whole depth of soil ice has thawed,the runoff decreases because infiltration increases; at this time, the soil acts like a sponge, restoring water in the soil. Briefly,during the freezing and pre-thawing seasons, the frozen soil can significantly prevent soil water infiltration. However, during the mid- and late-thawing seasons, infiltration increases, and the frozen soil acts similar to a sponge.This conclusion is consistent with the study of Wanget al.(2009).
Moreover, the influence of the soil freeze-thaw process on the climate and hydrological processes varies in different regions. The freeze-thaw process can induce significant cooling in high-latitude regions during summer,and warming in the TP during winter.Although this work was based on simulations alone, it highlights that the effect of permafrost degradation on the climate varies in different regions because of their different latitudes and altitudes.
It should be noted that the simulation in this study has several limitations.These simulations use the prescribed SST and sea ice,which could affect the global atmospheric circulation and precipitation. This effect will be included in further studies.Another limitation of this study is that all of the solid ice content is not converted to liquid water, which would be more accurate to quantify the freezing and thawing effect.Thus,the insufficient soil ice converted into soil will weaken the freeze-thaw influences on surface hydrologic and thermal fluxes. This study examined the effect of soil freeze-thaw process on surface hydrology and heat fluxes. Continued studies could focus on the effect of soil freeze-thaw process on circulation, monsoon activity, and climate. The study presented here indicates that the soil freeze-thaw is an essential process in climate models, and permafrost can regulate the local climate by tuning the surface energy budget.
Acknowledgments:
This work was supported by the National Nature Science Foundation of China (42075091, 41991281,41975096 and 41675015). This work was also supported by CAREERI STS Funding (Y651671001).We acknowledge computing resources and time on TH-1A in the National Supercomputer Center in Tianjin. The authors thank XinYao Rong for fruitful discussions.
 Sciences in Cold and Arid Regions2021年1期
- Sciences in Cold and Arid Regions的其它文章
- Constitutive models and salt migration mechanisms of saline frozen soil and the-state-of-the-practice countermeasures in cold regions
- Direct incorporation of paraffin wax as phase change material into mass concrete for temperature control:mechanical and thermal properties
- Response of revegetation to climate change with meso-and micro-scale remote sensing in an arid desert of China
- The evapotranspiration and environmental controls of typical underlying surfaces on the Qinghai-Tibetan Plateau
- Evaluating effects of Dielectric Models on the surface soil moisture retrieval in the Qinghai-Tibet Plateau