Inspection interval optimization for aircraft composite structures with dent and delamination damage
CAI Jing and DAI Dingqiang
College of Civil Aviation, Nanjing University of Aeronautics and Astronautics, Nanjing 211106, China
Abstract: The optimization of inspection intervals for composite structures has been proposed, but only one damage type, dent damage, has been addressed so far. The present study focuses on the two main damage types of dent and delamination, and a model for optimizing the inspection interval of composite structures is proposed to minimize the total maintenance cost on the premise that the probability of structure failure will not exceed the acceptable level. In order to analyze the damage characteristics and the residual strength of the composite structure, the frequency, energy, size, and depth of the damage are studied,and the situation of missing detection during the inspection is considered. The structural residual strength and total maintenance cost are quantified corresponding to different inspection intervals. The proposed optimization method relieves the constraints in previous simulation methods, and is more consistent with the actual situation. Finally, the outer wing of aircraft is taken as an example, and with the historical cases and experimental data, the optimization method is verified. The optimal inspection interval is shorter than the actually implemented inspection interval, and the corresponding maintenance cost is reduced by 23.3%. The result shows the feasibility and effectiveness of the proposed optimization method.
Keywords: civil aircraft, composite structure, accidental impact damage, failure probability, inspection interval.
1. Introduction
Composite materials have the advantages of light weight,fatigue resistance, high specific strength and stiffness [1],which can meet the requirements of modern civil aircraft structure. Therefore, composite materials are increasingly used in modern civil aircraft structure. However, their use does present some engineering and maintenance challenges. It is one of the ideal ways for the challenges to use sensors to monitor the structure in real time, but it has not been applied in practice due to the limitation of technology and cost. Therefore, at present, scheduled maintenance still dominates the structural maintenance of aircraft[2].
The reasonable structure inspection interval ensures that the structure damages can be detected before residual strength falls below the acceptable levels. In the fatigue damage (FD) analysis of maintenance steering group(MSG)-3 for metal structures, the initial inspection interval is related to the detectable size of the fatigue damage,and the repeated inspection interval depends on the crack propagation curve from the detectable length to the critical length [3]. Different from the traditional metal structure, the concept “no damage extension designing” is generally applied to civil aircraft composite structures [4],which ensures that the damage will not extend during the service life by limiting the working strain, and the damage size is considered constant and will never increase to the critical threshold. It has been shown that the composite structures are insensitive to fatigue at the design stress levels [5]. Delamination may occur when the impact happens, but the traditional MSG-3 analysis is based on the experience that only considers dent damage. This makes the MSG-3 analysis less suitable for the assessment of the composite structure inspection interval. Therefore, the selection of the inspection interval for composite structural parts becomes a key challenge [6,7].
The service data of main composite structures certified based on FAR-25 and CS-25 requirements (such as Boeing 737 horizontal stabilizer, Boeing 777 tail fin and airbus series tail fin) indicate that the main composite structures of aircraft have excellent resistance to environmental degradation (ED) and FD [8].Therefore, for the composite structures of civil aircraft, the accidental damage(AD) is the main damage source. Alderliesten et al. [9]studied the fatigue problem of the aircraft composite structure and compared it with the metal structure, and found that the composite material had better fatigue resistance. Cheng et al. [10] analyzed the influencing factors of impact resistance of composite structure. Huang [11]analyzed the accidental impact events during the aircraft operation or maintenance. Chen et al. [12] used the probability method and Monte Carlo simulation to optimize the inspection interval of composite structure based on dent damage.
In this study, the outer wing skin of an aircraft is taken as an example, and the probability analysis method is applied to analyze the probability of structure failure, focusing on the two main damage types of dent and delamination. In order to analyze the damage characteristics and the residual structure strength of the composite structure,the frequency, energy, size and depth of the damage are studied, and the situation of the missing detection during the inspection is considered. Furthermore, the inspection interval is optimized to minimize the total maintenance cost with the requirement of the probability of structure failure.
2. Impact characteristics
2.1 Average impact during service life
During the service life of an aircraft structure, the number of impact damages Ndis a discrete variable, and is generally supposed to follow a Poisson distribution [13],namely Nd∼P(λ):

where λ represents the average number of impact damages during the service life of the structure, k is an integer that represents the real number of impact damages.
According to the statistics of wing structure maintenance records of 12 aircrafts in a fleet from 2002 to 2012 [14],there were 19 impact damages on composite skin panels.Generally, the service life of the aircraft in China is about 30 years, therefore, the average number of impact damages during the service life of the aircraft is about19×(30÷10)÷12 ≈5 times, that is, λ=5.
2.2 Time of impact
The impact damage caused by runway debris, hail, human maintenance maloperation, etc., is highly random and accidental, and many studies have shown that the impact time t can be described by a uniform distribution[15,16]. The probability density function is as follows:

where a and b respectively represent the lower and upper limit values.
2.3 Impact energy distribution
According to the U.S. military manual MIL-HDBK-17F[17], 1 644 impact damages observed on the metal structure are converted into energy levels using the calibration curve obtained from the F-15 wing as shown in Fig. 1.Because the U.S. navy military aircraft and civil aircraft have similar maintenance tools and operations, the data of 1 644 impact damages are wildly used in the research of composite aircraft structure [16].
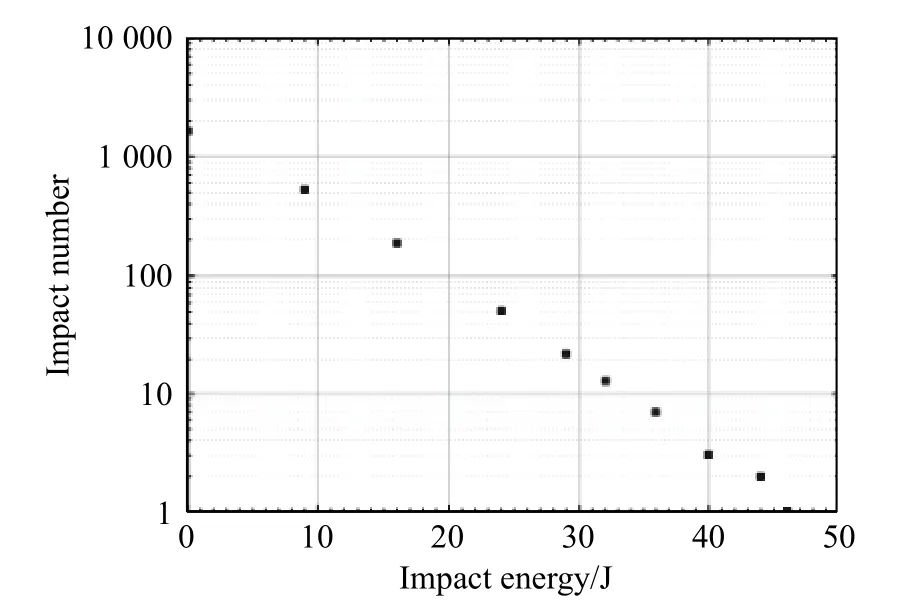
Fig. 1 Impact energy statistics
The data of 1 644 impact damages can be used to obtain the probability distribution of impact energy [18,19],that is, marine corps airforce (MCAir) impact threat,which would be adopted to describe the possible impact on the fuselage structure of civil aircraft during service.The probability density function of impact energy [18,19]can be described as

where E represents the impact energy, α and β respectively represent the shape and dimension parameters of the Weibull distribution.
However, due to different impact sources during the service, the actual impact threat depends on the location of the structure. In order to establish different distributions based on different impact sources, different structures, and their location in the region, Kan [18] divided the MCAir impact threat into three levels, namely low threat, medium threat, and high threat, and the corresponding parameters are shown in Table 1.

Table 1 Parameters of different impact probability distributions
2.4 Damage characteristics
2.4.1 Damage size distribution In order to determine the relationship between the impact energy and the damage size, a low-speed impact test on composite laminates is performed. The original parameters of the impact dent damage test piece are as follows:
(i) Material type: P2352W-19 (T300).
(ii) Geometric size: 150 mm × 100 mm × 4.56 mm (the nominal thickness of a single layer is 0.190 mm).
(iii) Laying sequence: [45/0/-45/90]3s, a total of 24 layers.
(iv) Original strength: 450 MPa (equivalent to a load of 152 792 N).
In the test, the detection parameters are determined according to [19], and the test data are shown in Table 2.
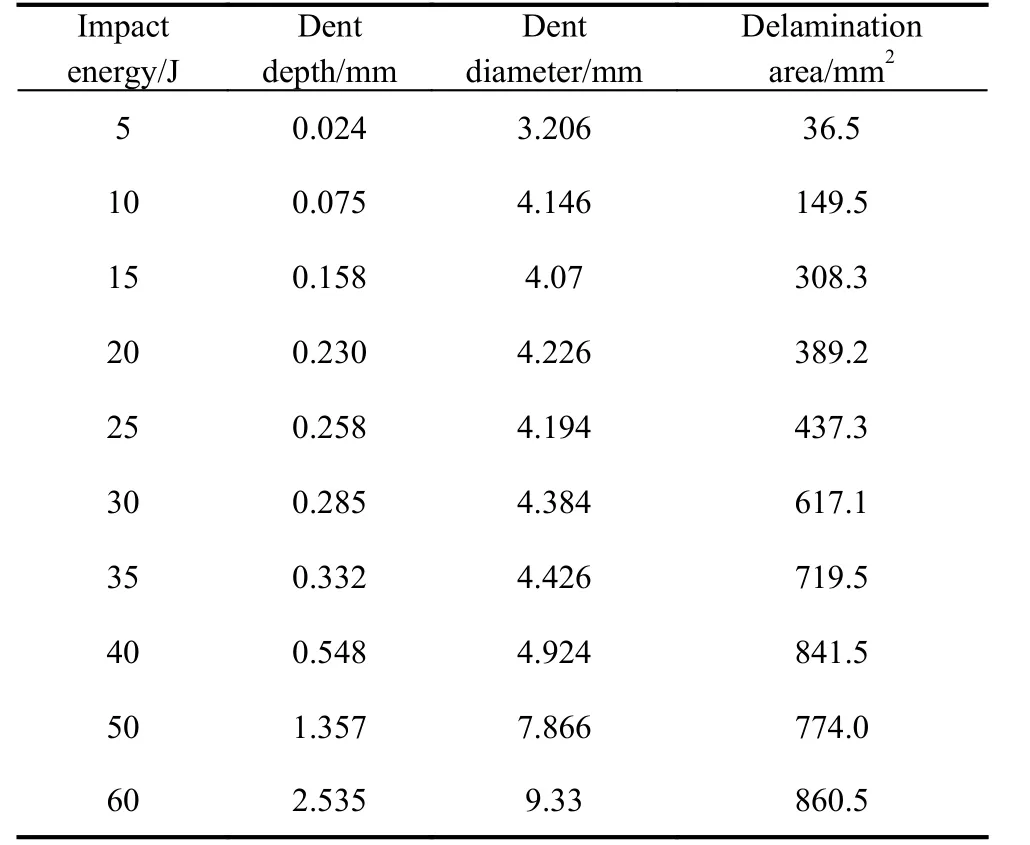
Table 2 Impact test data
According to the test data, different fitting curves are obtained to describe the relationships between the impact energy and the dent depth, as well as the dent diameter and delamination area respectively, as shown in Fig. 2.
The corresponding functions of the three fitting curves in Fig. 2 are as follows:

where a is the dent depth, d is the dent diameter, and S is the delamination area.
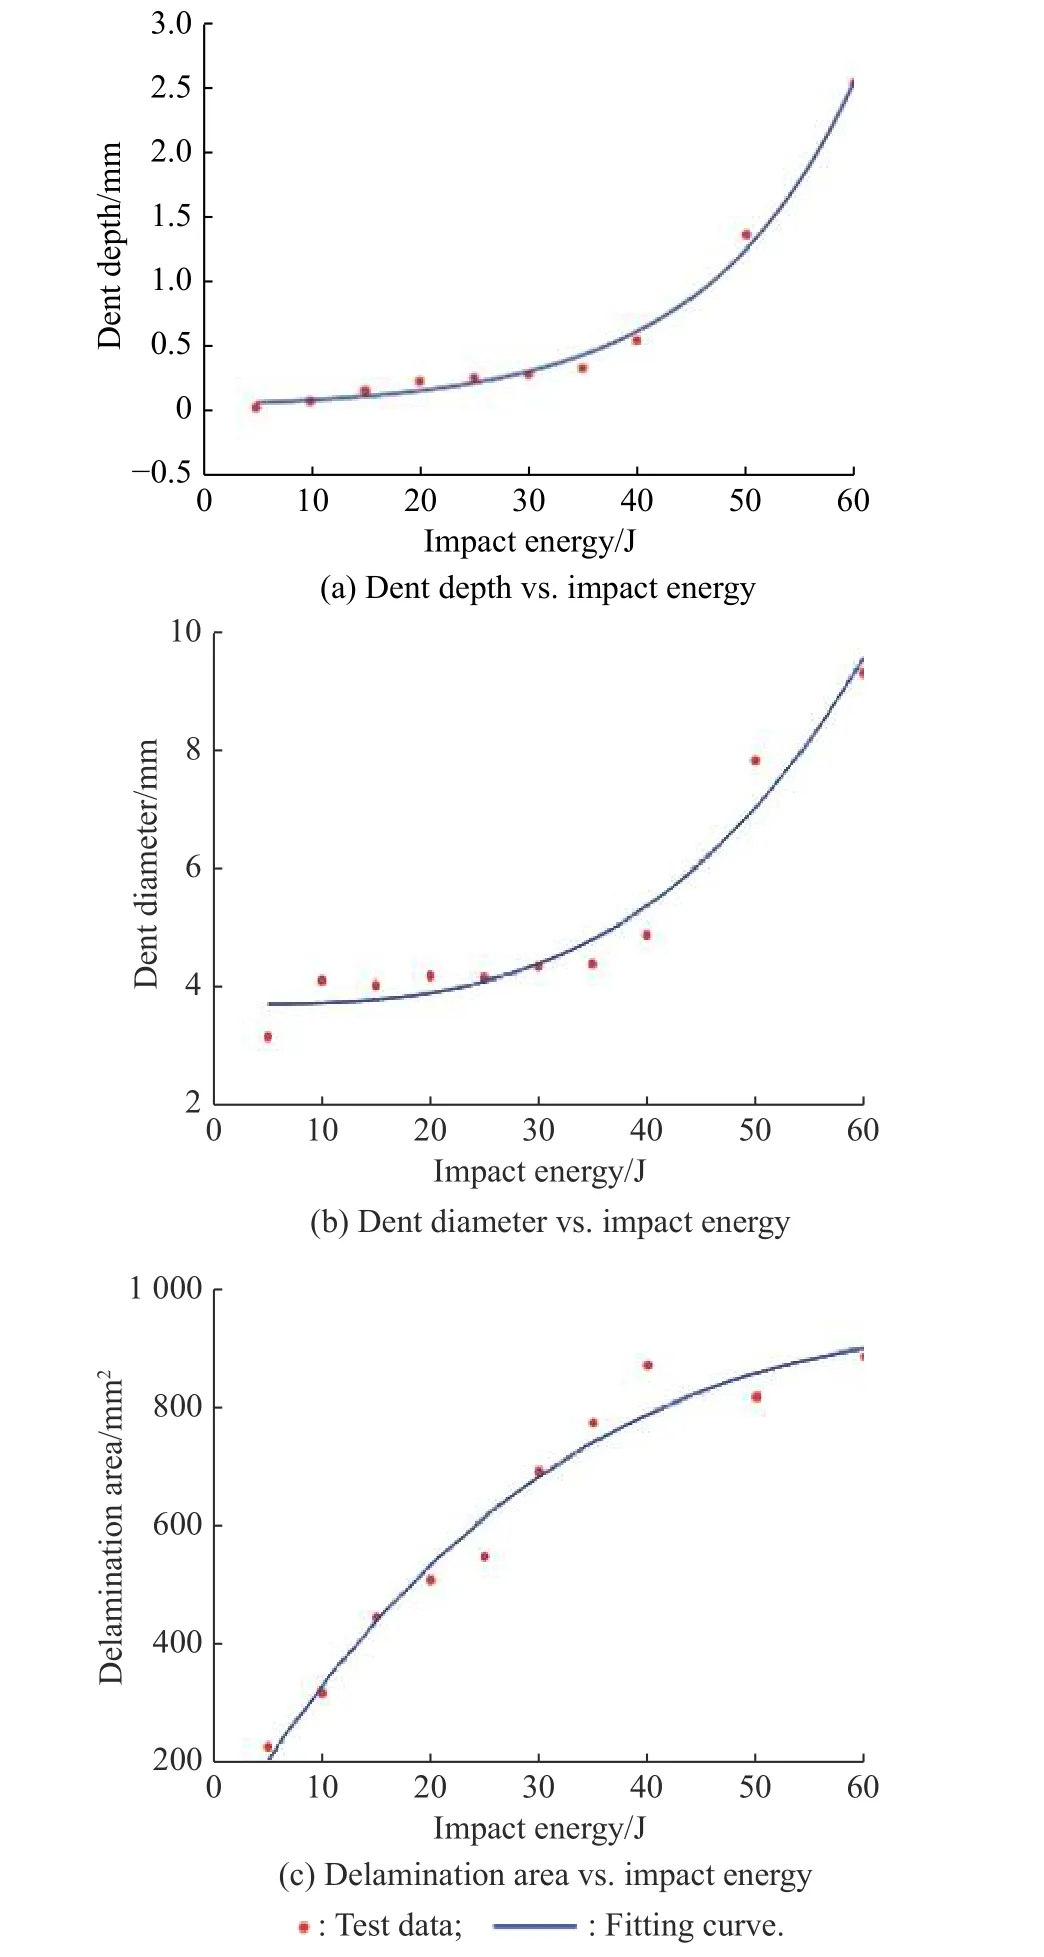
Fig. 2 Relationships between impact energy and dent depth, dent diameter and delamination area respectively
2.4.2 Statistics of delamination depth
For the delamination damage of composite structure, the depth of the delamination is an important damage characteristic parameter. It has a significant effect on the damage detection and the residual strength. Therefore, firstly the distribution of the delamination depth should be determined. According to [20], the proportion of the delamination near the 1/2 depth is the most, up to 52.43%; the second is 38.93% near the 1/3 depth, and the others are totally 8.64% at the 1/4 and shallower depth, which are shown in Fig. 3.
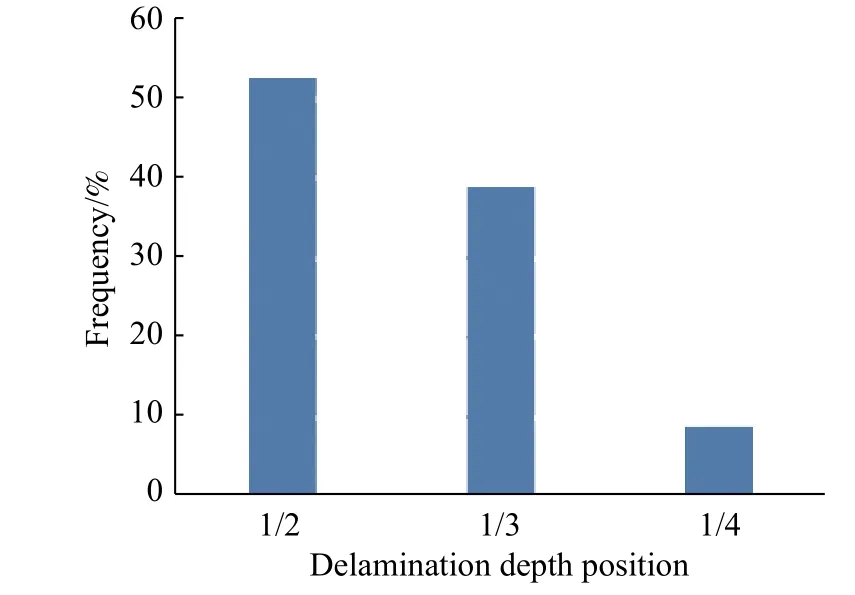
Fig. 3 Statistics of delamination depth
3. Inspection and maintenance
3.1 Probability of detection
3.1.1 Dent
The current study on the detection of the impact damage of composite structure shows that the depth is the main parameter to characterize the dent damage. The detailed visual inspection (DET) is generally implemented to detect the dent damage [21], and the detection probability of DET ( pdent) depends on the depth a, and can be described with a lognormal distribution [22].

where µ and σ are respectively the mean and standard deviations of the detection probability.
The maximum likelihood estimation method is used for the parameter estimation µ and σ. According to the records of dent detection [23], the likelihood function can be described as

where aiis the depth of the ith dent, ziis 1 when the dent is detected, or 0 otherwise. µ=−1.869, σ =0.612 can be obtained by solving the following equations.

In order to eliminate human errors during the test in[23] and guarantee the validity of the data, the detection probability of the dent damage at the 95% confidence level should be selected to characterize the damage detection efficiency [24], and the corresponding mean and standard deviations are µ95=−1.785, σ95=0.677. pdent(a)is shown with different confidence levels in Fig. 4.
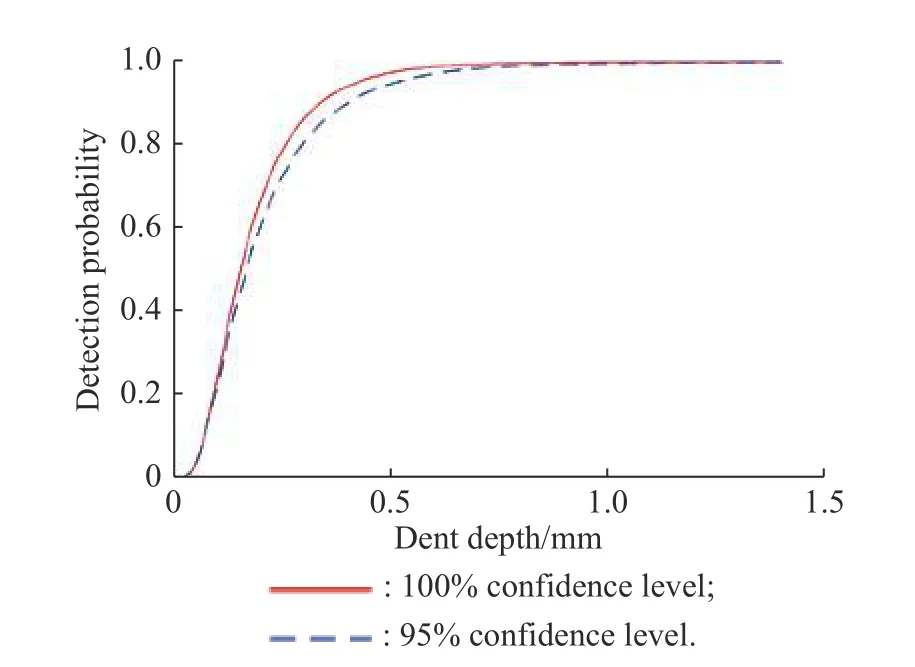
Fig. 4 Detection probability with different confidence level
3.1.2 Delamination
According to [25], the detection probability of the delamination diameter can be described with a lognormal distribution:

where d is the delamination diameter, ς and ω are undetermined parameters. ς = -9.87 and ω = 3.13 can be obtained according to the data in [25]. Therefore, the detection probability of different damage diameters are shown in Fig. 5.
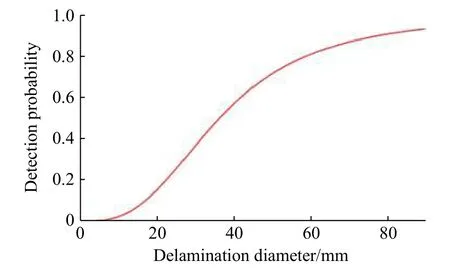
Fig. 5 Detection probability of delamination damage
3.2 Residual strength
3.2.1 Influence of dent on residual strength
In order to study the influence of the dent damage on the residual strength of the composite structure, the residual strength test is performed by using a laminate with the dent damage. In order to eliminate the influence of different test piece thicknesses, the experimental data of both the dent depth and the laminate residual strength are normalized, and the relative dent depth ( ∆a) and relative residual strength ( Rrs) are calculated, as shown in Table 3.
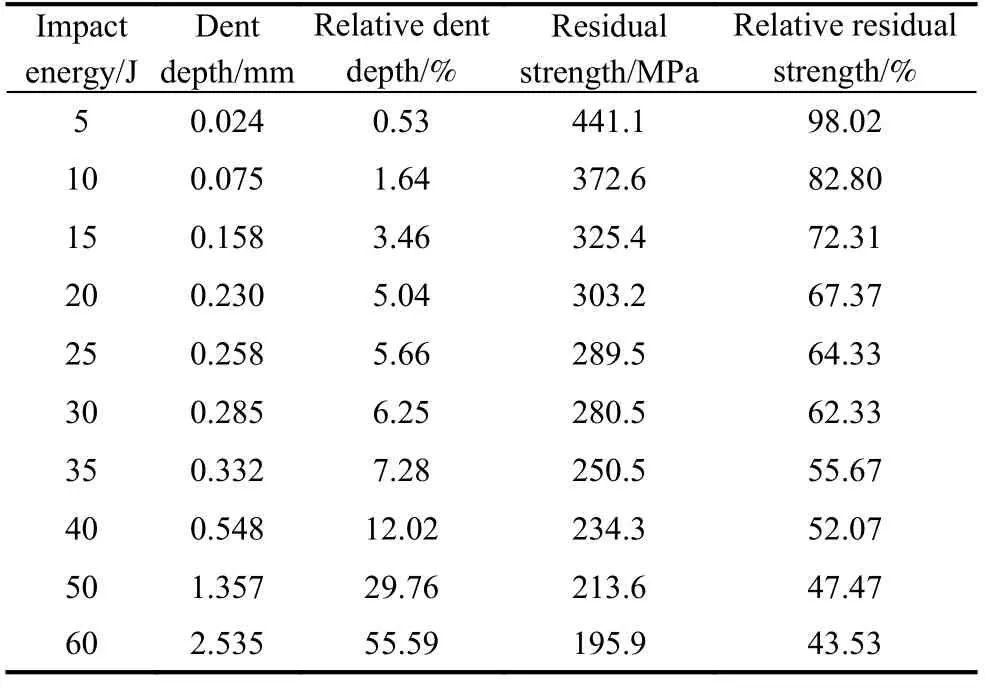
Table 3 Residual strength test data
The relationship between the relative dent depth and the relative residual strength is obtained by fitting the experimental data, as shown in Fig. 6. The relative residual strength can be expressed by

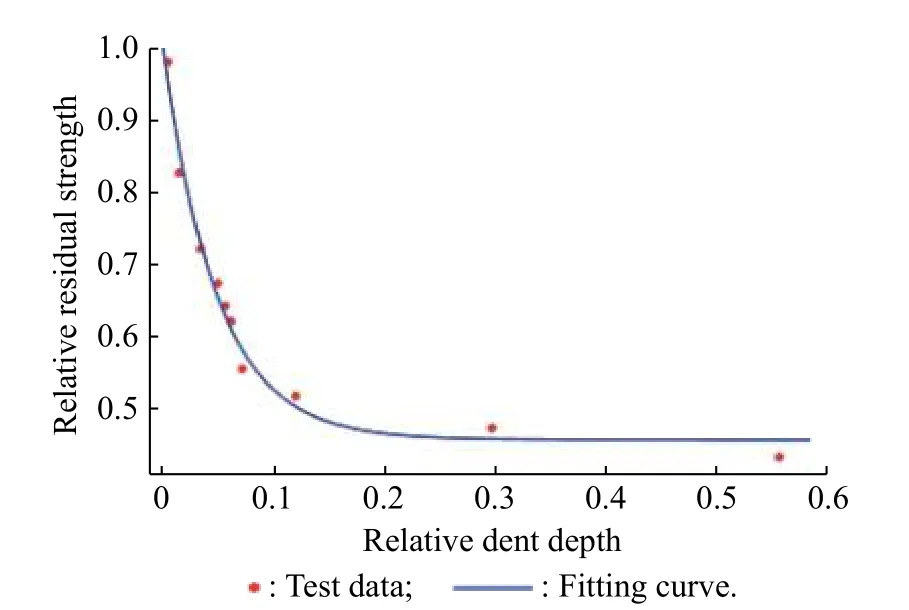
Fig. 6 Relationship between relative dent depth and relative residual strength
3.2.2 Influence of delamination on residual strength
As for the delamination damage of the composite structure, according to the experimental results in [26], it can be known that the residual strength monotonically decreases with the increasing of the diameter of the damage area. The residual strength with different delamination depths can be expressed by

3.3 Repair policy
According to the structural repair manual, the repair policies of the structure damage are divided into the following three cases:
(i) Do not repair: When the damage size of the structure is smaller than the lower limit of the repair tolerance,do not repair.
(ii) Repair: When the damage size of the structure is between the lower limit and the upper limit of the repair tolerance, repair is performed.
(iii) Replacement: When the damage size of the structure is greater than the upper limit of the repair tolerance,replacemerd is performed.
According to [24], the repair tolerance of the dent damage is that the depth a ∈[1.0 mm,2.5 mm], and according to [8], the repair tolerance of the delamination damage is that the diameter d ∈[15 mm,50 mm].
3.4 Recovery of residual strength
According to the repair experience in airlines, referring to the descriptions in [13,16], the recovery coefficient of the residual strength after repair obeys a uniform distribution between 0.85 and 0.95. Obviously, the residual strength remains unchanged if no repair performed, and the residual strength restores to the original structure strength level if replacement is performed.
The structure is subjected to varying degrees of accidental impacts during the service life, and the damage is detected and maintained with different repair policies,therefore, the strength of the structure may be attenuated or restored to varying levels, as shown in Fig. 7.
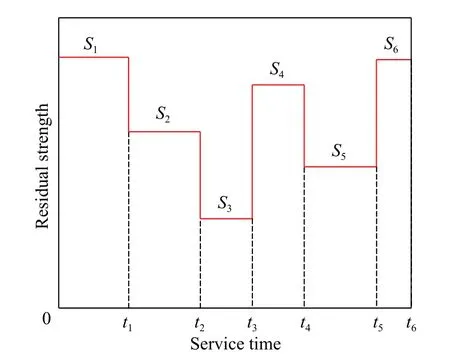
Fig. 7 Schematic diagram of structural residual strength during the service life
In Fig. 7, it is assumed that the initial strength is S1,and the structure sustained the impact damage at time t1,t2, t4respectively, and the corresponding structure strength is attenuated to S2, S3and S5. However, at time t3and t5, the damage is detected and repaired, so the strength of the structure is restored to the higher levelsS4and S6, respectively.
4. Inspection interval optimization
4.1 Probability of structure failure
The aircraft structure will fail when its load on the structure is greater than the residual strength of the structure,the situation of which should be avoided or controlled at a very low probability. Therefore, the probability of the structure failure should be estimated accurately. For the composite structure of civil aircraft, the gust load Lgustis the main concern [8,27].
The study [8] has shown that in one flight hour (FH),the occurrence probability of the gust load, which is greater than a specific load between the limit load and the ultimate load, can be described by a log-linear model as follows:

where RSLLand RSULare the limit load and the ultimate load respectively, and a and b are undetermined parameters.
According to [8], it is known that

It is generally known that RSULis 1.5 times of RSLL,therefore, a and b can be obtained by (14), andcan be expressed as

Therefore, the probability of the structure failure per FH with the change of the gust load can be illustrated in Fig. 8.
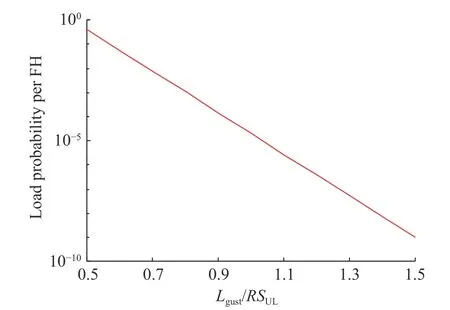
Fig. 8 Probability of structure failure per FH
As described in Fig. 7, according to the structural residual strength, the whole service life is divided into different segments, and the residual strength remains unchanged in each segment. Therefore, the probability of the structure failure in every segment depends on both the length of the segment and the gust load, and can be expressed as

where tiand Rsiare the length and the residual strength of the ith segment respectively, and Nsis the number of segments during the service life.
Therefore, the probability of the structural failure during the whole service life can be calculated by using the following formula:

4.2 Maintenance cost
According to the characteristics of structure maintenance[23], the maintenance cost of structure comprises three parts: the periodic inspection cost Ci, the repair cost Crrelated to the damage, and the replacement cost Crp.Ciand Crpdo not change with different damages, and are usually considered as constants [16]. However, Crdepends on many aspects such as actual repair conditions,and degree of damage. Therefore, based on the actual operating experience of the airlines, the repair cost of the damage [28,29] can be described as

Since the main purpose of the study is to optimize the inspection interval, instead of the maintenance cost itself,it is enough to optimize the inspection interval when the proportion of every part in terms of the maintenance cost is confirmed. According to the calculation and statistics of maintenance cost in [29], assuming the basic unit of maintenance cost is 1, the values of every part in terms of the maintenance cost are shown in Table 4.
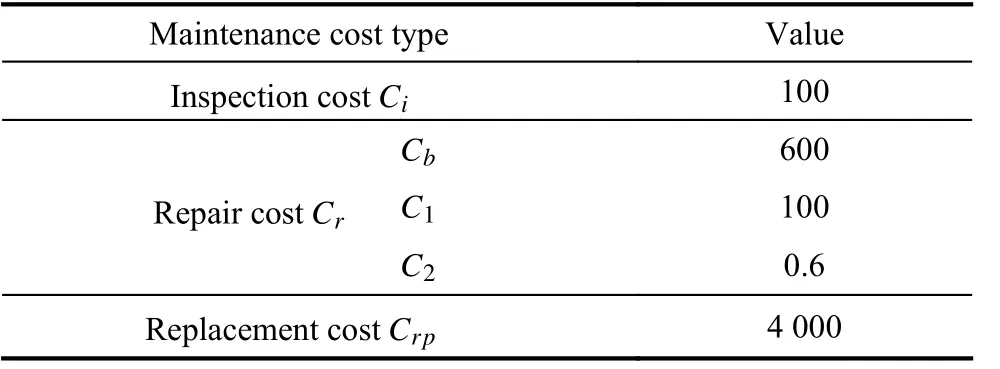
Table 4 Values of maintenance cost
4.3 Optimization model
Based on the above analysis, the inspection interval T has an effect on the probability of the structure failure and total maintenance cost, therefore, the optimization model is proposed to obtain the optimal inspection interval, and to minimize the total maintenance cost with the requirement of the probability of structure failure. The optimization model can be described as

where N(T) , L(T) and K(T) are the numbers of inspections, replacement and repair in the service life, respectively.
It is obvious that N(T) , L(T), K(T) and tidepend on the inspection interval T, but it is difficult to obtain the N(T), L(T), K(T), tiand T. The Monte Carlo simulation analytic expressions to describe the relationship between method is suitable for this problem, and is adopted in this study.
In the case of the fixed inspection interval, the simulation process of the failure probability and total maintenance cost of the composite structure during the service life is shown in Fig. 9.
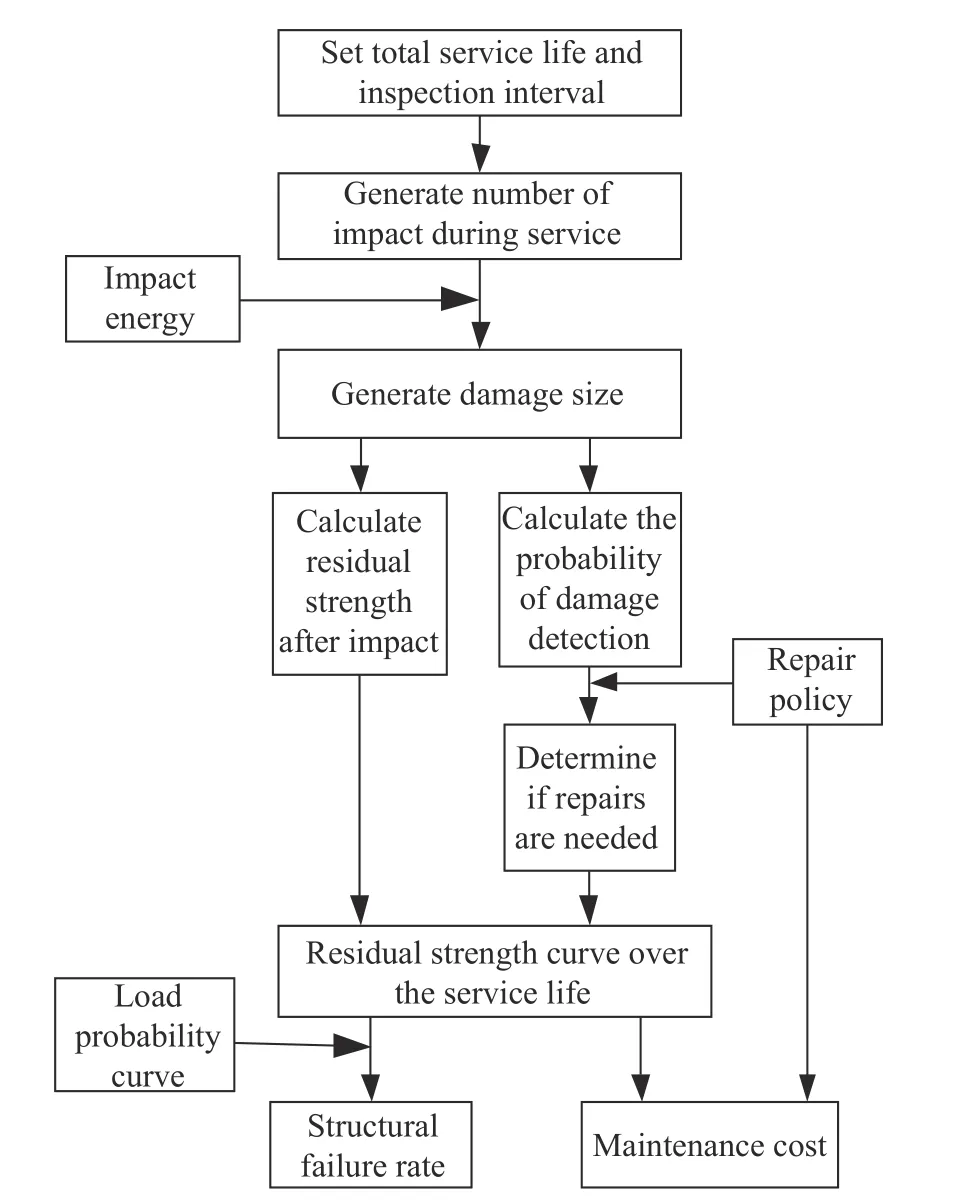
Fig. 9 Calculation of structural failure probability and total maintenance cost
Firstly, set the aircraft service life as the total length of the simulation, and a fixed inspection interval is set for each simulation cycle. Then, according to the impact characteristics determined in Section 2, the impact information is generated, including the number of impact during the service life of the aircraft, the impact time, and the impact energy. Based on the relationship between the impact energy and the damage size, dimensional information such as the dent depth and the delamination area of each damage is generated. Chronologically, considering the detection probability and different repair policies, calculate the residual strength of the structural. Finally, the probability of structure failure and total maintenance cost during the service life are obtained.
5. Case simulation
The outer wing skin structure of the aircraft is taken as an example. According to the flowchart in Fig. 9, the simulation is carried out by using Matlab. There is a result of one simulation as shown in Fig. 10, and in this simulation, the structure suffers three damages, all of which are repaired, and the residual strength of the skin structure with the increasing of time is obtained. Then the probability of structure failure and total maintenance cost can be obtained with (18) and (19).
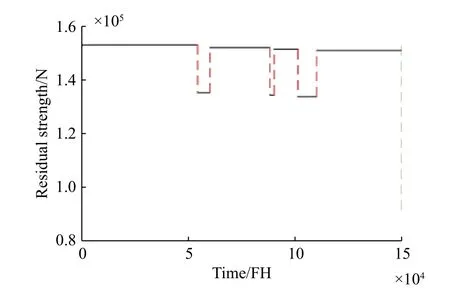
Fig. 10 Residual strength with the increasing of time
The impact energy, damage size and detection probability vary in different simulations, therefore, in order to eliminate the influence of the randomness, more simulations should be implemented to obtain the average of the simulation results. For example, when taking 5% of the service life as the inspection interval, it can be seen from Fig. 11 that with the increasing number of simulation,the probability of structural failure and the total maintenance cost gradually converge. When the number of simulations exceeds 1 500, the results are basically stable.
Therefore, in this study, the case when the inspection interval is 1% - 20%, the service life is analyzed, and 1 500 repeated simulations are performed for every inspection interval. The average probability of structural failure and total maintenance cost under different inspection intervals are shown in Fig. 12.
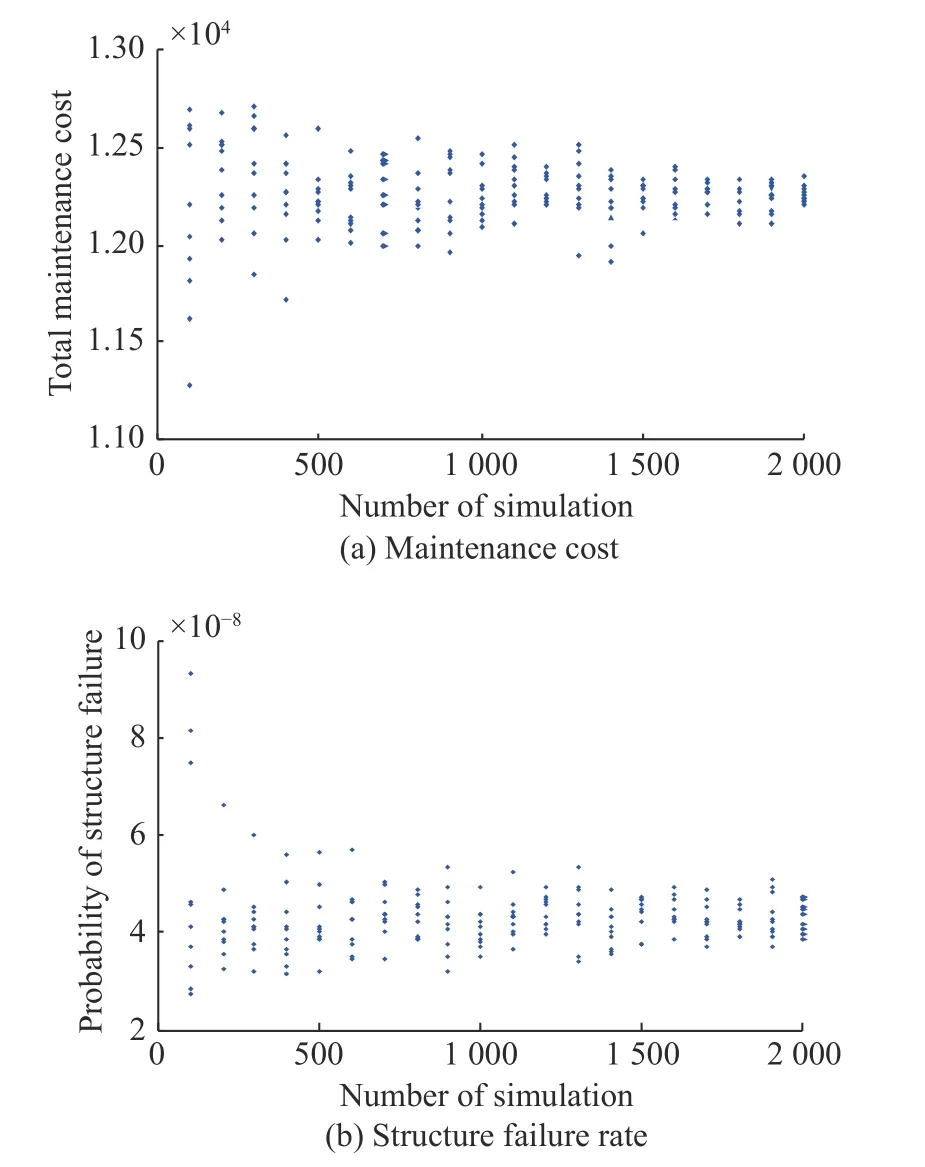
Fig. 11 Failure rate and total maintenance cost at different repetition times
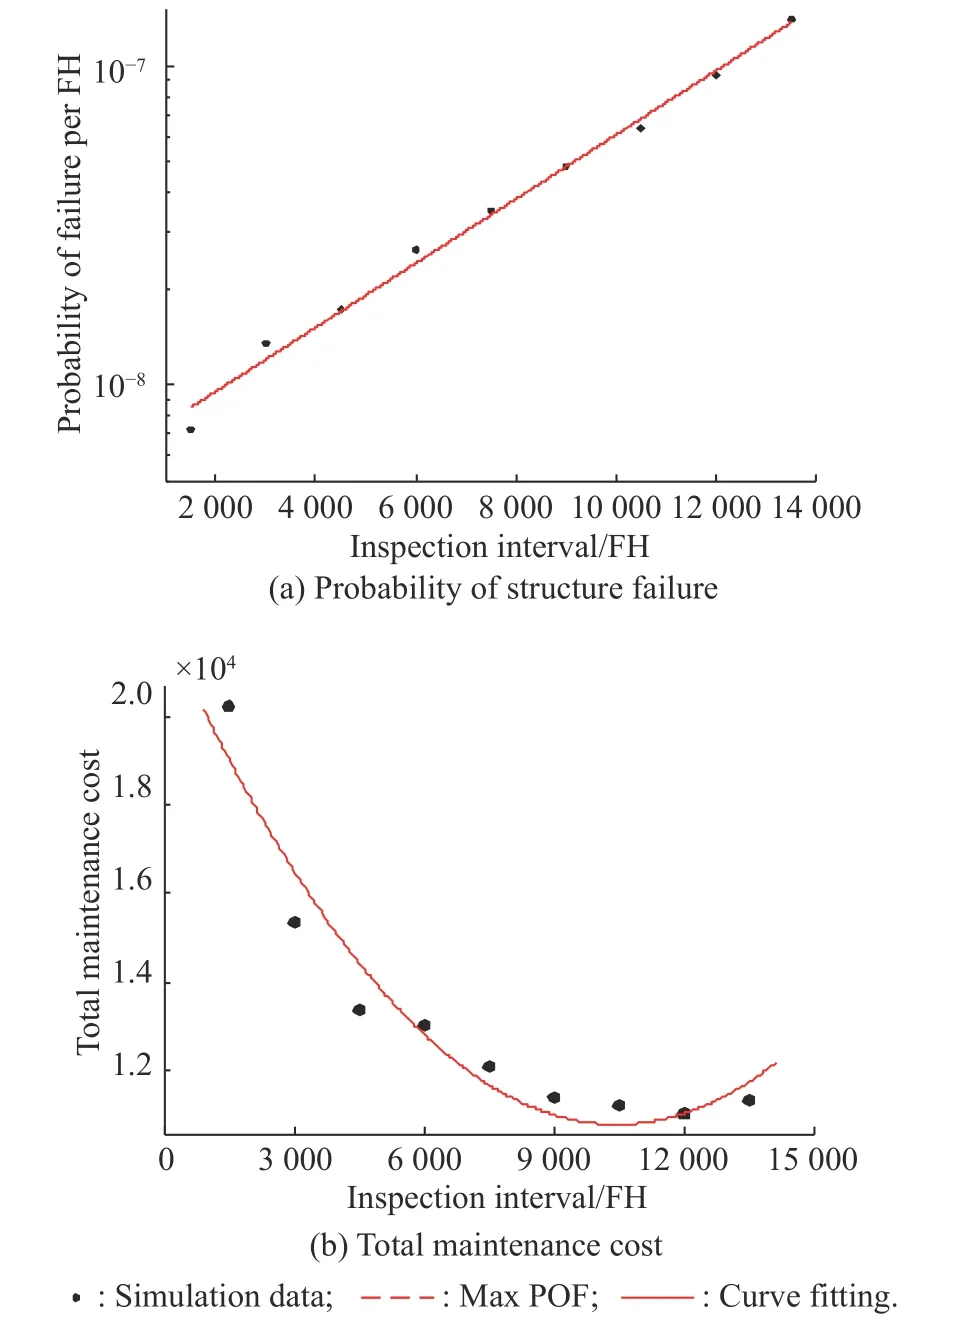
Fig. 12 Probability of structure failure and total maintenance costs at different inspection intervals
As shown in Fig. 12, when T ≤12 641 FH, the requirement for the probability of structure failure POF ≤10−7per FHcan be fully satisfied, which is the maximum acceptable threshold for major safety accident. The total maintenance cost during the service life of the structure is minimized when T =10 393 FH.
According to the analysis of the traditional MSG-3,the DET interval for composite structural parts is “4C”(16 000 FH). According to the simulation, when taking T =4C, the probability of structure failure will exceed the threshold. The reason is that the MSG-3 analysis is based on the experience only considering the dent damage, while delamination is considered in the simulation,making the simulation process closer to the actual situation. The maintenance cost when “4C” is taken as the inspection interval is 1.405 9 × 10⁴units, and it decreases to 1.078 4 × 10⁴units at the optimal inspection interval obtained by the simulation, with a decrease of 23.3%. It can be seen that the optimization method has a significant effect on the optimization of maintenance costs.
6. Conclusions
For civil aircraft composite structures, the probability analysis is proposed to analyze the probability of structure failure and the total maintenance cost to optimize the inspection interval, and the following conclusions are obtained.
In addition to the generally analyzed dent damage, the delamination is taken into consideration. The probabilistic analysis method and the test data are used to calculate the probability of structure failure and the total maintenance cost of the outer wing skin of the aircraft under different inspection intervals. The inspection interval should not exceed 12 641 FH when the probability of structure failure does not exceed 1×10⁻⁷per FH, and the minimum total maintenance cost is obtained at the inspection interval of 10 393 FH, with 23.3% decrease of the total maintenance cost. Compared with the experience and logical based method MSG-3, the analysis process of this probabilistic analysis method is completely quantitative. This quantitative method can provide a reference for the assessment of the accident impact damage tolerance of composite structures and the optimization of the inspection interval in the maintenance plan.
The advantage of the probabilistic analysis method is that, for different composite structures, the inspection interval can be dynamically adjusted according to different acceptable probabilities of structure failure in the airline.
In the future research, based on the optimization model proposed in this study, the sensitivity analysis of maintenance costs can be performed to explore which type of costs has the greatest impact on the total maintenance cost to reduce maintenance costs.
 Journal of Systems Engineering and Electronics2021年1期
- Journal of Systems Engineering and Electronics的其它文章
- Unsplit-field higher-order nearly PML for arbitrary media in EM simulation
- A deep learning-based binocular perception system
- STAP method based on atomic norm minimization with array amplitude-phase error calibration
- Higher order implicit CNDG-PML algorithm for left-handed materials
- Fast and accurate covariance matrix reconstruction for adaptive beamforming using Gauss-Legendre quadrature
- Multiple interferences suppression with space-polarization null-decoupling for polarimetric array
