SAR image de-noising via grouping-based PCA and guided filter
FANG Jing, HU Shaohai, and MA Xiaole
1. Institute of Information Science, Beijing Jiaotong University, Beijing 100044, China; 2. Shandong Province Key Laboratory of Medical Physics and Image Processing Technology, School of Physics and Electronics,Shandong Normal University, Jinan 250014, China
Abstract: A novel synthetic aperture radar (SAR) image de-noising method based on the local pixel grouping (LPG) principal component analysis (PCA) and guided filter is proposed. This method contains two steps. In the first step, we process the noisy image by coarse filters, which can suppress the speckle effectively. The original SAR image is transformed into the additive noise model by logarithmic transform with deviation correction. Then, we use the pixel and its nearest neighbors as a vector to select training samples from the local window by LPG based on the block similar matching. The LPG method ensures that only the similar sample patches are used in the local statistical calculation of PCA transform estimation, so that the local features of the image can be well preserved after coefficients shrinkage in the PCA domain. In the second step, we do the guided filtering which can effectively eliminate small artifacts left over from the coarse filtering. Experimental results of simulated and real SAR images show that the proposed method outstrips the state-of-the-art image de-noising methods in the peak signalto-noise ratio (PSNR), the structural similarity (SSIM) index and the equivalent number of looks (ENLs), and is of perceived image quality.
Keywords: synthetic aperture radar (SAR) image de-noising,local pixel grouping (LPG), principal component analysis (PCA),guided filter.
1. Introduction
Synthetic aperture radar (SAR) remote sensing has many advantages compared with optical remote sensing, mainly the capture ability of all-day and all-weather [1]. However, the main drawback of SAR images is the existence of speckle noise, which is a kind of signal related particle noise called speckle noise. Speckle noise can affect the subsequent image interpretation and information extraction [2-4].
During the past three decades, several SAR image denoising methods have been proposed. Many scholars take a great loss of image resolution as the cost and average a certain number of independent images to solve this problem. Some of the early speckle reduction techniques are based on the logarithmic transformation to obtain an additive model which is easier to deal with. Then some famous methods to de-noise the additive white Gaussian noise (AWGN) can be used as a reference to deal with the transformed model [5,6]. These methods often neglect some basic properties of the speckles although they are easy to implement. In practical terms, the log-transformed speckle noise does not strictly obey the zero mean Gaussian distribution. Therefore, the deviation needs to be corrected before any other processing is carried out [7]. In the corresponding period, more ambitious techniques tackle de-noising in the original domain based on the multiplicative speckle model. These early articles have clearly shown that some form of local adaptation is needed to account for the nonstationarity of the image[8-11]. With the development and continuous improvement of the multi-scale analysis tool, there are more and more techniques tackling de-noising in the transform domain. After a homomorphic transformation, wavelet shrinkage can be readily applied to the transformed coefficients. As well as the spatial domain, the wavelet-based techniques take some advantages of spatial adaptivity when filtering the image so as to better retain image textures and boundaries [12-16].
The nonlocal means (NLM) methods as a brand-new image de-noising strategy were proposed in recent years[17-24]. The basic idea is to use the self-similarity of natural images. The NLM methods have been used in SAR image de-noising. Among them the most famous algorithms are the probabilistic patch-based (PPB) algorithm[18] and the SAR block matching 3D (SAR-BM3D) algorithm [21]. In recent years, the convolutional neural networks have been developed rapidly and play an important role in Gaussian noise filtering which have been extended to SAR images de-noising [25,26]. Nevertheless,it can be a time-consuming operation to train these networks and set up a training set with pairs of speckle-free SAR images.
In this paper, we go one step further and propose a semi-non-local principal component analysis (PCA)-based de-noising method for SAR images. The PCA is a classical de-correlation technology in statistical signal processing which is widely used in pattern recognition and dimensionality reduction and other fields [27]. In the PCA domain, the principal components (PCs) represent the scene information, while the last secondary components mainly represent the noise information [28]. The adaptive PCA de-noising method proposed by Muresan and Parks [29] and the local pixel grouping PCA (LPG-PCA)method proposed by Zhang et al. [30] all adopt linear minimum mean-square error (LMMSE) to shrink the PCA transform coefficients, so as to achieve the purpose of filtering Gaussian noise. Both methods are more effective than the traditional wavelet-based de-noising methods.
Aiming at the multiplicative nature of speckle noise, a new de-noising strategy based on the LPG-PCA technology is established in this paper. Considering the particularity of the SAR image in the original domain, we construct the pixel to be processed and its nearest neighbors as a vector. Inspired by [21], we select the training samples by an ad hoc measure and obtain the vectors of similar image patches. Through similarity grouping, the local statistical information of the SAR image can be better calculated. Thus, the edge information of the scene can be better protected when the PCA transform coefficients are shrunk. However, there may be the wrong grouping caused by strong noise. We use the guided filter as a good contour preserving strategy to improve the de-noising results [31,32].
The rest of this paper is arranged as follows. Section 2 reviews the data formation and statistics of SAR images after logarithmic transformation based on the PCA. Section 3 introduces the SAR image de-noising method based on the LPG-PCA. Section 4 recommends the guided filter. Section 5 describes the proposed method. Section 6 shows the results obtained by using both simulated and real SAR images. Finally, in Section 7, we make a conclusion.
2. SAR image statistics and PCA
In this section, two important preprocessing steps are introduced that will run through this article. First we review the logarithmic SAR statistics and get the mean and variance of the log-transformed model. Then, we briefly review the procedure of the PCA.
2.1 SAR image statistics
SAR remote sensing is an active acquisition device which transmits radar signals and captures the reflected echoes from the in-phase and quadrature channels. The received echoes are very difficult to analyze. Due to the unevenness of the reflector, the interference will occur in each resolution cell. As a result, light and dark particles will inevitably appear in SAR images called speckle noise.
Assuming that the speckle noise is fully developed, the received reflected signal model can be denoted by

where I denotes the observed noise image, R represents the noise-free reflected signal which is an auto-correlated random process, and V is the speckle fading term which obeys auto-correlation stationary random distribution. The model represented by (1) is suitable for single-look or multi-look images and the quantities can be amplitude or intensity. Goodman [2] proved that fully developed speckle follows the Gamma distribution. In a homogeneous region, the equivalent number of looks (ENLs) is often regarded as a known parameter which can be calculated as

where µ denotes the mean value and σ denotes the standard deviation of the homogeneous region.
Since the observed signal and the noise-free signal are nonlinear, it is a very difficult task to filter the SAR speckle noise. The multiplicative noise model is transformed into the additive noise model by logarithmic transformation, i.e.,

The mean of ln(V) can be calculated by the following formula:

and the variance also can be denoted by

where ψ(m)(L) is the Poly-Gamma function with order m[7]. The model after logarithmic transformation does not strictly obey the Gaussian distribution with zero mean. It is necessary to correct the deviation, so the observed signal can be denoted by

In the following research, we will start from the above model and further assume that the signal and noise are not spatially correlated. Firstly, the PCA is introduced.
2.2 PCA
Letx=[x1,x2,···,xm]Tbe a vector variable with m components and

be the sample matrix of x, whereare the samples of variable xi, i=1,2,···,m , and j=1,2,···,n. The sample vector Xiis the ith row vector of sample matrix X which includes n elements denoted by

We can calculate the mean value of Xias

The sample vector Xiis centralized as


Finally, we can calculate the co-variance matrix ofas


The terms φ1,φ2,···,φmand λ1,λ2,···,λmare the eigenvectors and eigenvalues of Ω respectively. Meanwhile the eigenvalues are in the non-increasing order. The purpose of PCA transformation is to find the orthonormal transformation matrix to de-correlate the data matrix. By setting

3. SAR image de-noising by LPG-PCA
In Section 3, based on the aforementioned model and the de-correlation between the signal and the noise in the logtransform domain, we will first introduce the local pixel grouping and the block similarity measure (BSM) applying to the SAR image.
The size of the SAR image is usually very large. It often ignores weak patterns when grouping the image pixels directly. Therefore, we divide the large image into several training blocks and get the training samples. Suppose there is a K×K training block as shown in Fig. 1. We model the central pixel to be de-noised and its nearest neighbors as a vector. An N×N window centered on the pixel is shown in Fig. 1. Obviously there are N2elements in the window, which is defined as x=[x1,x2,···,xm]T,m=N2. We perform the noise removal on the obtained vector, rather than on the single pixel in the center of the window.
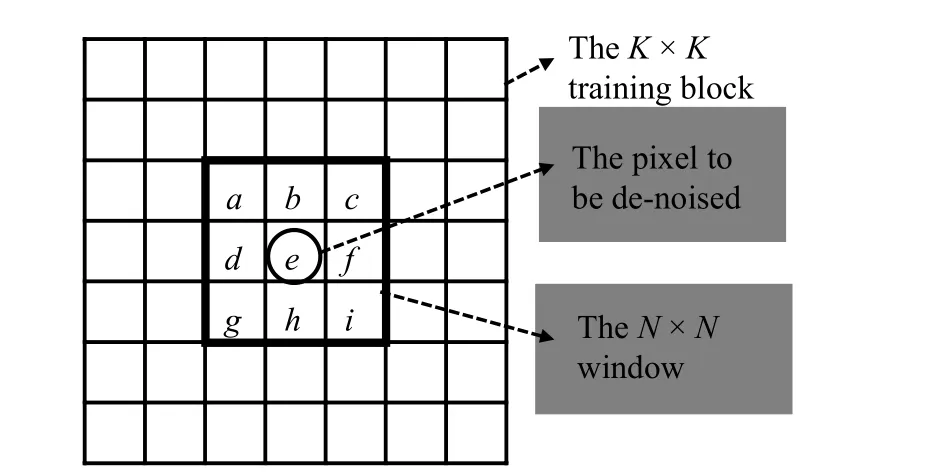
Fig. 1 Schematic diagram of local-pixel-grouping
According to the additive noise model discussed in Section 2, the patch variable in the training block can be denoted by

3.1 LPG in SAR images
The similarity between vectors is usually inversely proportional to some distance measure. Therefore, the smaller the distance is, the higher the similarity becomes.There are different approaches to look for the similar patches, such as K-means clustering, block matching, and lp-norm. The original LPG-PCA algorithm utilizes the Euclidean distance as the similarity measurement between the patch vectors. Considering the distribution of actual speckle noise, it is not an appropriate choice for SAR images. Parrilli et al. [21] proposed an ad hoc BSM.In this paper, the BSM is used as the similarity measurement between different patches.
Let yrbe the “reference column vector” which contains all the pixels in the central N×N window. r denotes the pixel to be processed and k is used to scan the whole window. The other patches in the training block can be denoted by yi, where i =1,···,(K −N+1)2−1. Letand xibe the noiseless column sample vectors corresponding to yrand yi, respectively.
Considering the SAR image model, we define the BSM as
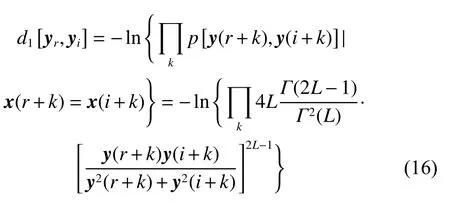
where Γ() is the Gamma function and L is the ENLs.
Equation (16) can be further simplified by the properties of logarithmic operation,
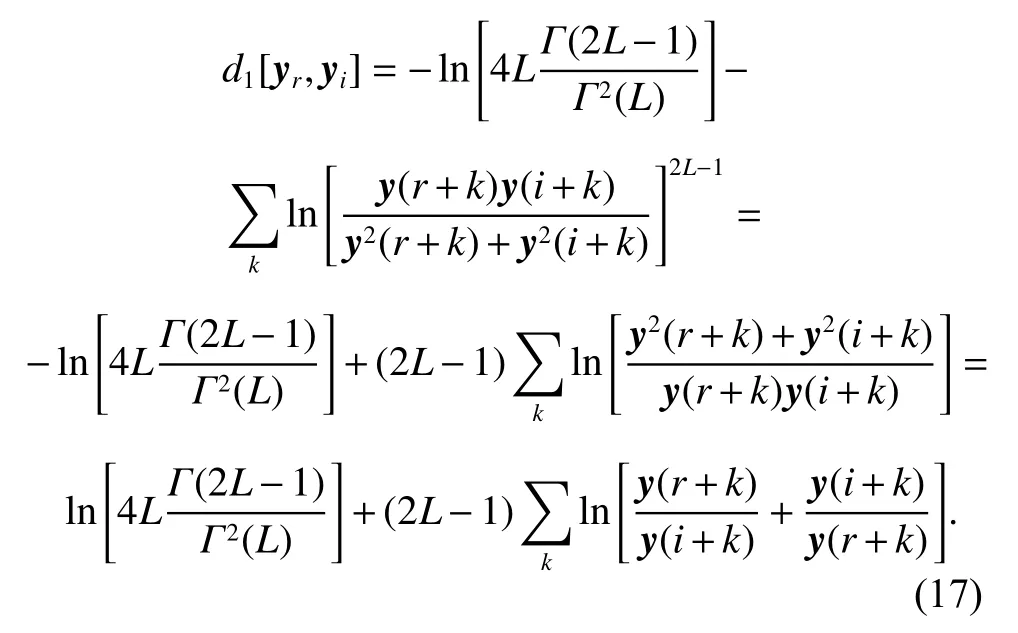
The first term is constant which can be discarded. Thus the BSM can be represented as

If d-distance follows (19), we consider yithe similar sample vector of yr,

Suppose n sample vectors of y have been selected,which can be written as yr,y1,y2,···,yn−1. The corresponding noiseless vector can be denoted by xr,x1,x2,···,xn−1. Then the training dataset for y is denoted by

The noiseless counterpart of Y is formed by

In order to calculate the PCA transformation matrix more accurately, n should not be too small. In general, we select at least c·m similar samples from the training blocks, where c is a constant between 7 and 10 determined by experiments. That is to say, if n <c·m, we will use the best c ·m matched samples in PCA training. Generally, the most similar training samples can improve the robustness of local information estimation. The accuracy of the PCA transformation matrix can be improved by using local similarity grouping.
3.2 SAR image de-noising in the PCA domain
Next, we discuss how to recover the noiseless dataset X from the noisy measurement Y.
In the m×n dataset matrix Y, each component yiof the vector y has n samples, where i =1,2,···,m . Let Yibe the row vector which contains n samples of yi. Thus the dataset Y can be denoted by

As we have discussed in Subsection 2.2, once the covariance matrixis calculated, the PCA transformation matrixcan be obtained. Instead, depressingly, the centralized datasetis corrupted by the noise which makes it difficult to calculate the covariance matrixIn order to solve this problem, we first calculate the covariance matrix of, denoted byCarrying out singular value decomposition (SVD) on the covariance matrixwe can obtain the PCA bases. That is,

As described in [30], the eigenvector matrices ofandare the same. Thus in practical implementation we can perform SVD onto get the PCA bases,

The PCA bases can be denoted by


Then adding the mean values back towe get the denoised dataset
4. De-noising refinement by guided filter
The original LPG-PCA method can suppress most of the noise. Yet there is still residual noise in the filtered image. To illustrate this problem, in Fig. 2 we add multiplicative noise to the test image “Boat”. Fig. 2(a) shows the original image “Boat” and Fig. 2(b) is the noisy version by four-look speckles. Fig. 2(c) is the de-noised image by the original LPG-PCA de-noising procedures and most of the speckles is reduced. Fig. 2(e) is the local amplification of Fig. 2(c).
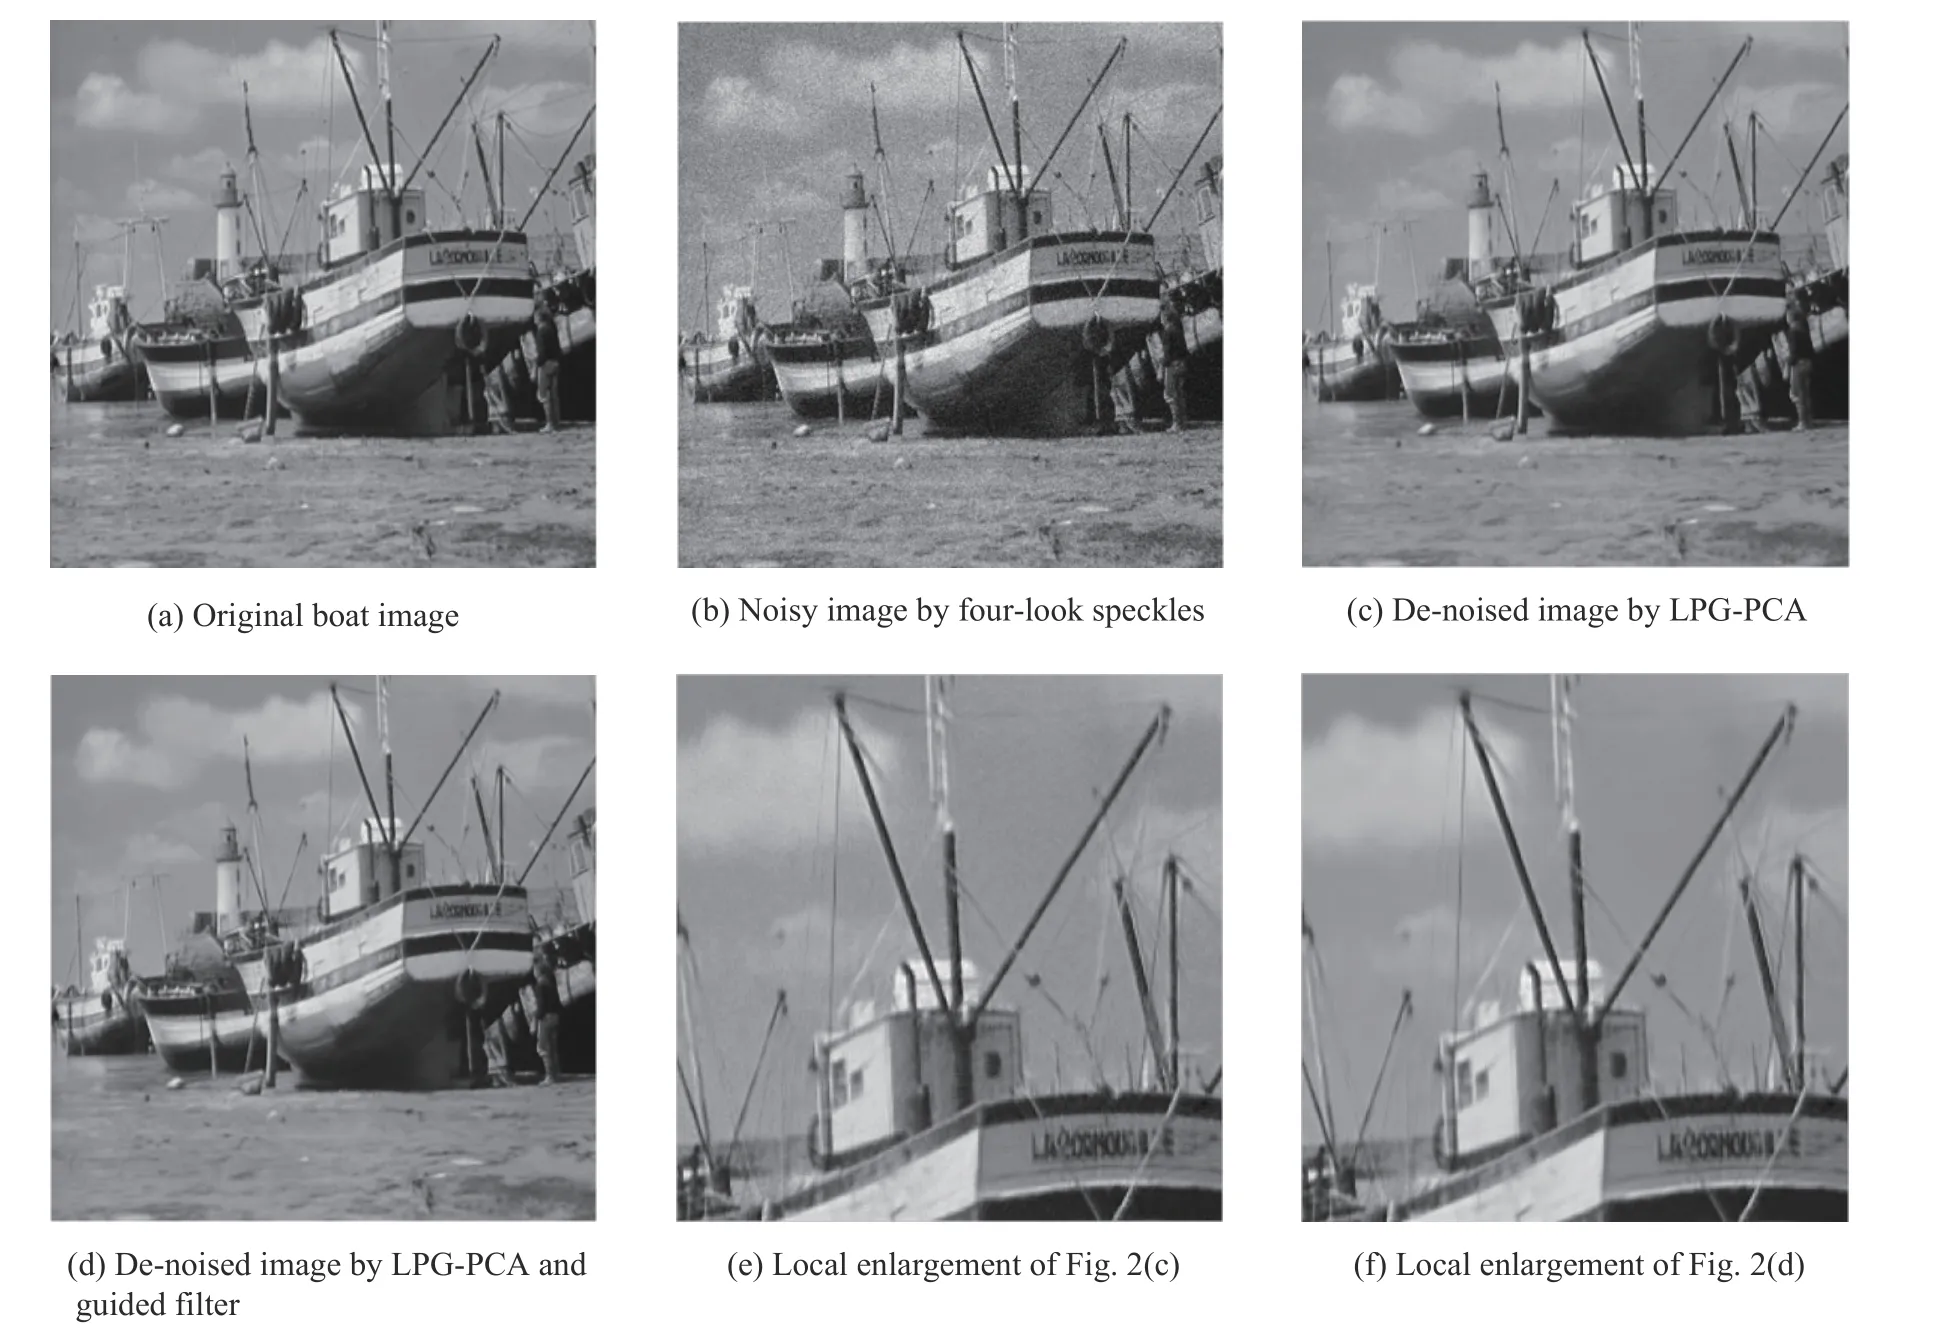
Fig. 2 Boat image de-noised by the two steps
We can see more clearly that although most of the speckle noise is removed by the LPG-PCA, the noise residue still exists in Fig. 2(e). This is mainly due to the strong speckle noise in SAR images which maybe lead to estimation bias of the PCA transformation matrix. Consequently, we need to further process the LPG-PCA denoising results to achieve a better noise reduction. As a fast non-approximate linear-time method, the guided filter was presented by He et al. in 2013 [31] and updated the fast algorithm in 2015 [32], which can be used as a good edge preserving smoothing method. The guided filter combines the original image and a guidance image to establish a linear filter. The guidance image may be the original input image or another related image. The guided filter can effectively suppress gradient-reversal artifacts.In the following, we refer to the fast guided filter in [32]to update the noise level.

where i denotes the index of a pixel belonging to a local square window ωkand k is the index of ωk. By minimizing the cost function, we can get the linear coefficients:
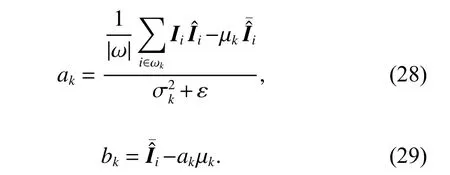
where µkis the mean andis the variance ofand|ω| denote the mean and the number of pixels in ωkrespectively. Applying (27) to all local windows in the whole image and averaging all the possible values of qi,we obtain the output data:

The de-noising results by the LPG-PCA and the guided filter are shown in Fig. 2(d). Fig. 2(f) is the local amplification of Fig. 2(d). We can clearly see that the residual noise is removed greatly after the guided filter.
5. The proposed method
A new SAR image de-noising method based on the LPGPCA and the guided filter is proposed in this paper. First,we perform logarithm transformation on the multiplicative model to obtain the additive model. Instead of applying the PCA to the original dataset, we suggest using LPG-PCA fitting for SAR images. Although de-noising via the LPG-PCA can suppress the speckle effectively, it also has some error both in the PCA transformation and in LPG because of the strong noise in SAR images. In order to solve this problem, we adopt an improved filtering step in which the output of the LPG-PCA method is filtered by the guided filter. The whole algorithm is presented in Algorithm 1. The detail of the proposed local pixel grouping for SAR images can be seen in Algorithm 2.
Algorithm 1The proposed SAR images de-noising method.
InputThe noisy SAR image I.
Step 1 Coarse filtering.
Logarithmic transformation with bias correction.
f oreac h pixel yiin I(ln), do
Patch extracting. Extract the sliding patchesof size N×N in the K×K training block.
Patch grouping. Group the similar patches based on LPG.
De-noising via the PCA.
end for
Obtain the full de-noised imageof I(ln).
Exponential transformation. Apply exponential transformation toand obtain the coarse filtering result
Step 2 Improved filtering.
InitializeInput imageand guidance image I.
Local window ωk.
Calculate akand bk.
Obtain the de-noised image.
OutputThe final filtering result
Algorithm 2The proposed local pixel grouping algorithm for SAR images.
InputThe image patchesyi(i=1,···,N(p))
InitializeThe training block K ×K.
Choose the central patch as the initial patch, denoted by yr.
Let yrbe the current patch and yibe sample patches around yrin the training block.
fori =1 to N(p)−1 do
Calculate the BSM of yrand yiby (18). Choose the patches according to (19) and get the training samples similar to yr.
end for
OutputThe training set for yi.
6. Experimental results
Without the original noiseless SAR image, it is difficult to make an objective assessment of the method in SAR image de-noising. Therefore, inspired by [14,15], we add simulated speckle noise to the optical test images and calculate the objective evaluation index. Then in Subsection 6.2, experiments on real SAR images are discussed. We compare the proposed method with several state-of-theart de-noising methods, such as the Frost filter [3], the homomorphic version of learned simultaneous sparse coding (H-LSSC) [24], original LPG-PCA [30] and nonlocal fast adaptive nonlocal SAR de-noising (FANS) [23].
6.1 Results with simulated speckle
Fig. 3 shows the tested optical images, including House and Cameraman images often used in the AWGN denoising literature. Furthermore, we choose an “Intersection” image which is more similar to SAR images in the aspect of ground information. The simulated images are obtained by multiplying optical images by simulated white speckle noise with different looks.

Fig. 3 Original images used in the experiments
The peak signal-to-noise ratio (PSNR) and structural similarity (SSIM) are used to evaluate the de-noising performance. SSIM was proposed in [33] and often used in the evaluation of despeckling methods. It mainly measures the changes of structure information before and after image filtering.

where Ipandrepresent noise-free image patches and denoised image patches respectively. C1and C2denote constants that are not zero. SSIM is a number greater than 0 and less than 1. The closer SSIM is to 1, the more similar the structure is.
Table 1 shows the PSNR of different realizations of the noise process. As can be seen from Table 1, the PSNR by our method is similar to FANS and much better than the other methods. Especially when L is smaller, the value of PSNR by the proposed method is about 5 dB larger than that of the H-LSSC. This is mainly due to lots of irrelevant patches in the learned dictionary which are not helpful for sparse representation. The SSIM indices by different methods are shown in Table 2. We can see that the SSIM indices obtained by our method is optimal.

Table 1 PSNR results of the de-noised image by different methods dB
Due to the limitation of space, only partial de-noising results are shown in this paper. Fig. 4 shows the denoised images by different methods for the “Intersection”image with L=2. From the de-noised images in Fig. 4, we notice that the Frost filter cannot remove all of the speckle noise. H-LSSC keeps working very well on the homogeneous region while unsatisfactory on the heterogeneous region. The original LPG-PCA method de-noises the log-transformed data directly which is not suitable for SAR speckle noise and produces many dark artifacts. Our method considers the multiplicative properties of speckle noise and uses the ad hoc BSM based on the real speckle noise distribution which greatly outperforms the original LPG-PCA on different looks. From Fig. 4, we can see that both FANS and the proposed method can suppress speckle noise without destroying boundary information while the proposed method produces fewer artifacts.
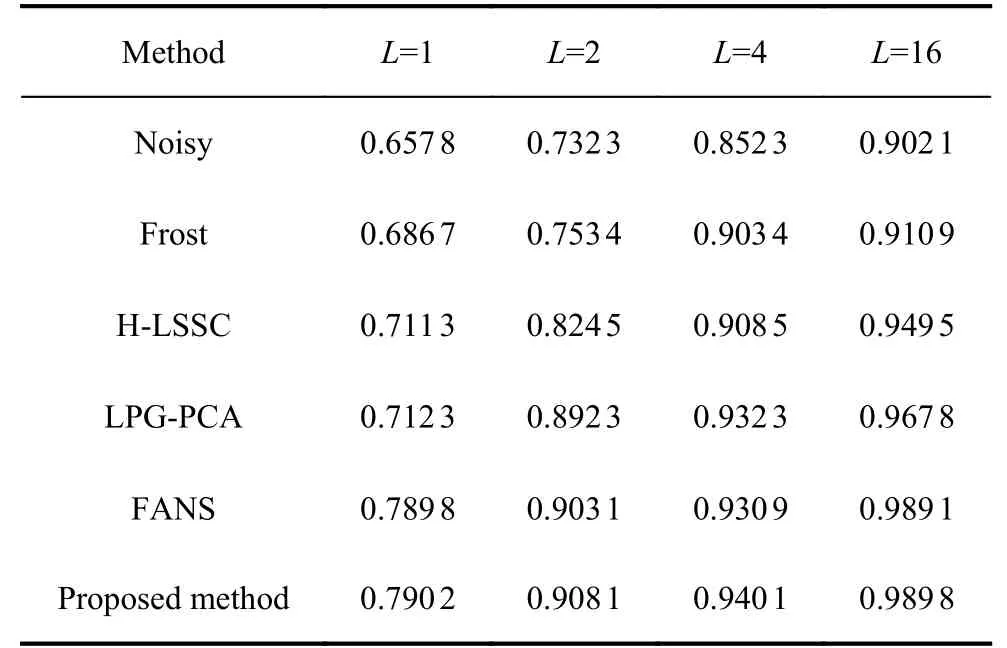
Table 2 SSIM results for “Intersection”
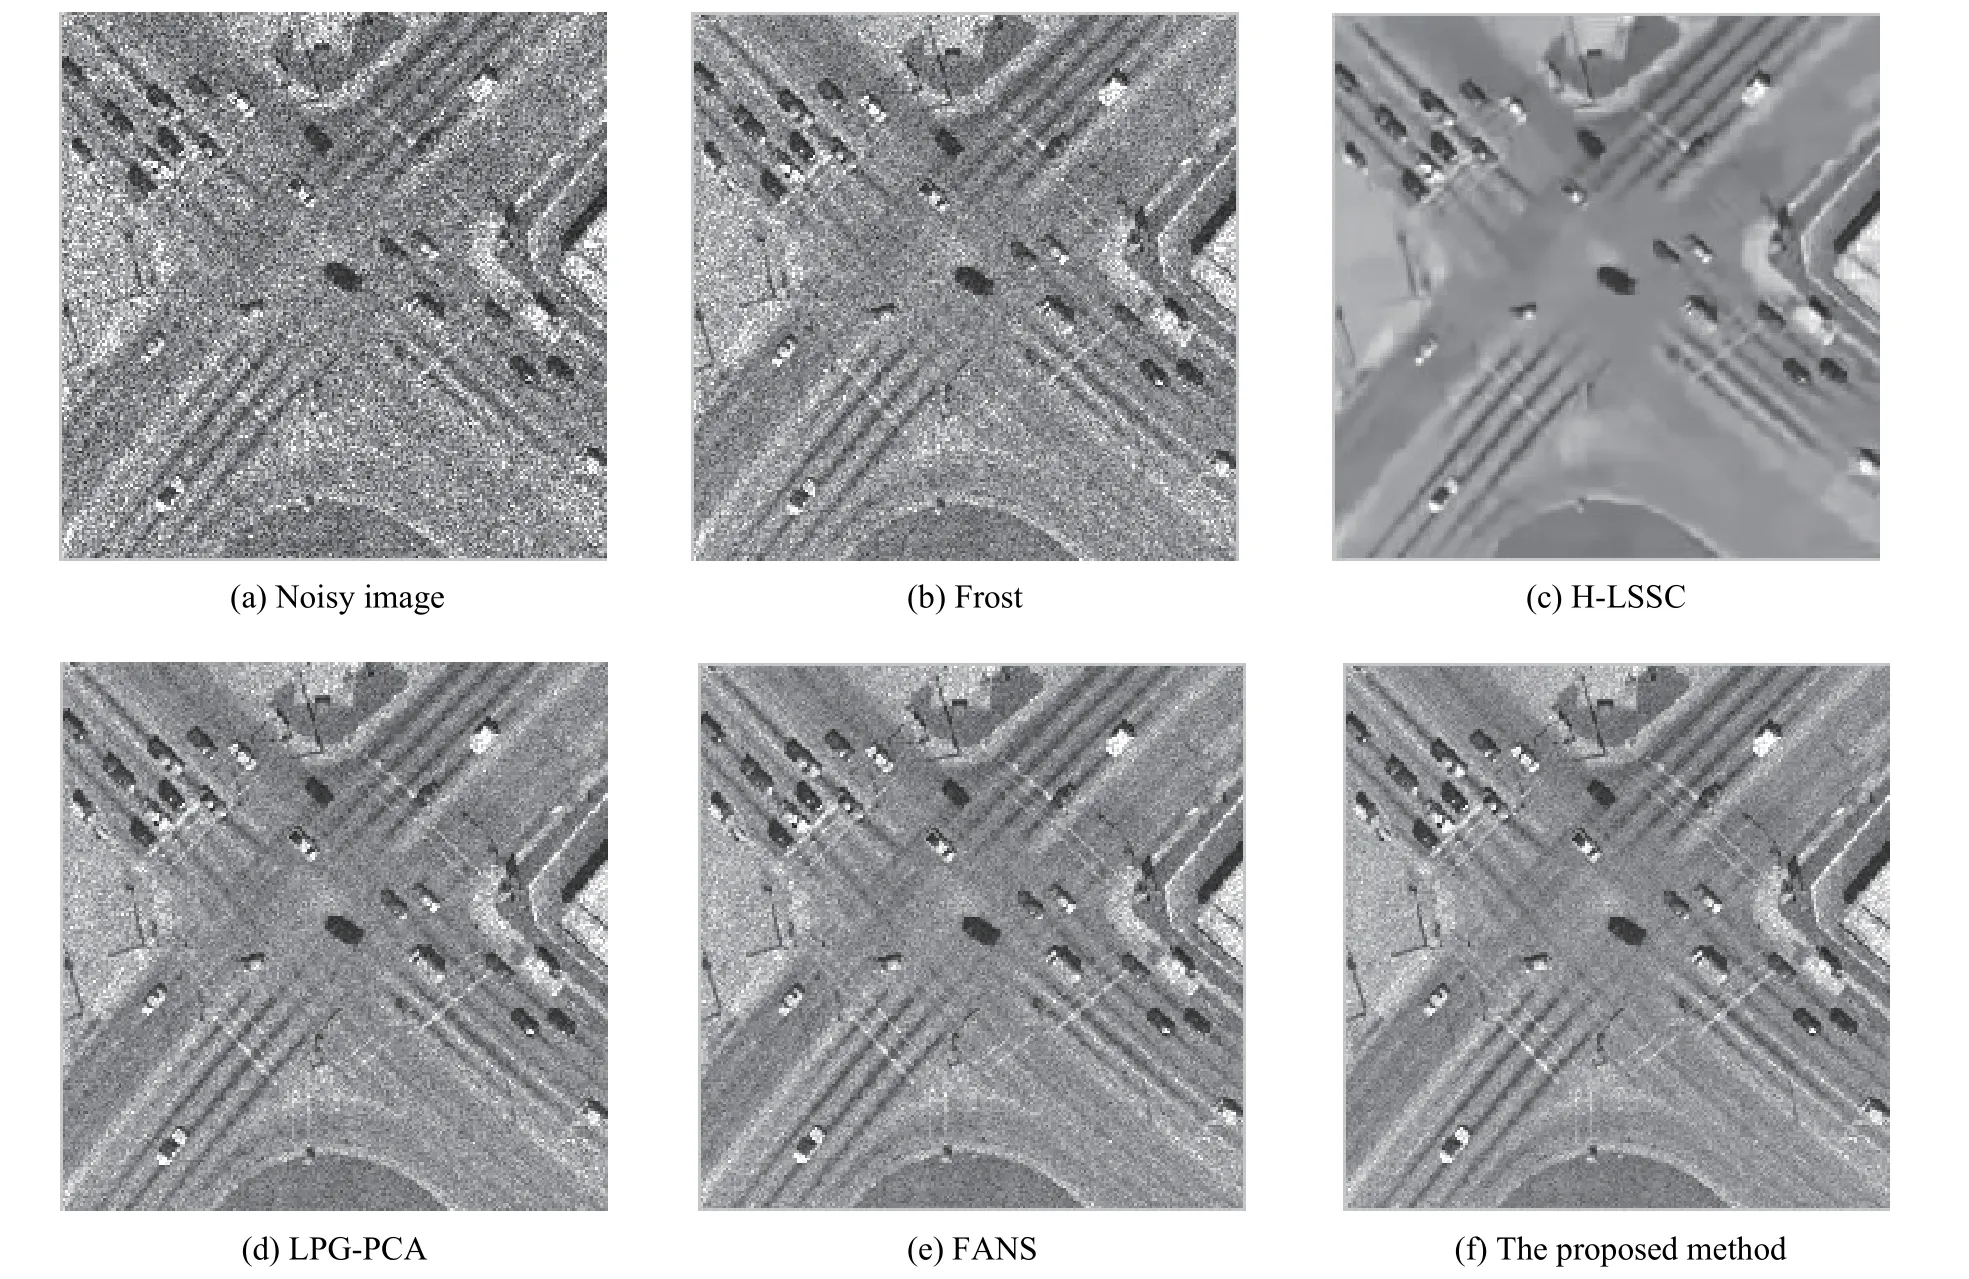
Fig. 4 De-noised images for “Intersection” corrupted by two-look speckles
6.2 Results with real SAR images
In order to further verify the effectiveness of the proposed method, comparison experiments of different methods on the real SAR images taken by TerraSAR-X over Swabian Jura (SJ) in Germany and Black Rock City (BRC) in USA are shown in Fig. 5 and Fig. 6. As we know, the ENLs is a standard parameter widely used in the remote sensing. It can measure the ability to suppress the noise in homogeneous areas. The white boxes in Fig. 5(a) and Fig. 6(a) are used to compute the ENLs. Larger ENLs values indicate stronger speckle suppression and an improved ability to distinguish different gray levels. From the ENLs results in Table 3, we can find that the proposed method has excellent ENLs in homogeneous areas.
From Fig. 5 and Fig. 6, we can find that Frost still remains much noise in both homogeneous and heterogeneous areas. H-LSSC may over-smooth the whole area.All methods preserve well on the linear structures expect for some lost in H-LSSC. The original LPG-PCA produces some artifacts because of the unsuitable grouping.The proposed method outperforms FANS in terms of small details preservation especially in heterogeneous areas.Overall, it shows that the proposed method is better than the other referenced methods in terms of both simulated images and real SAR images.
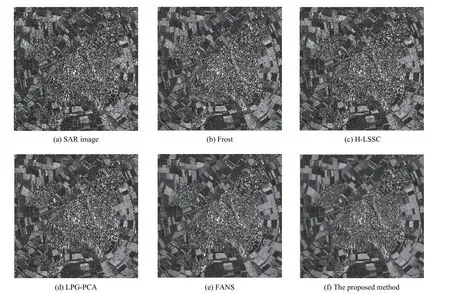
Fig. 5 De-noised images for SJ
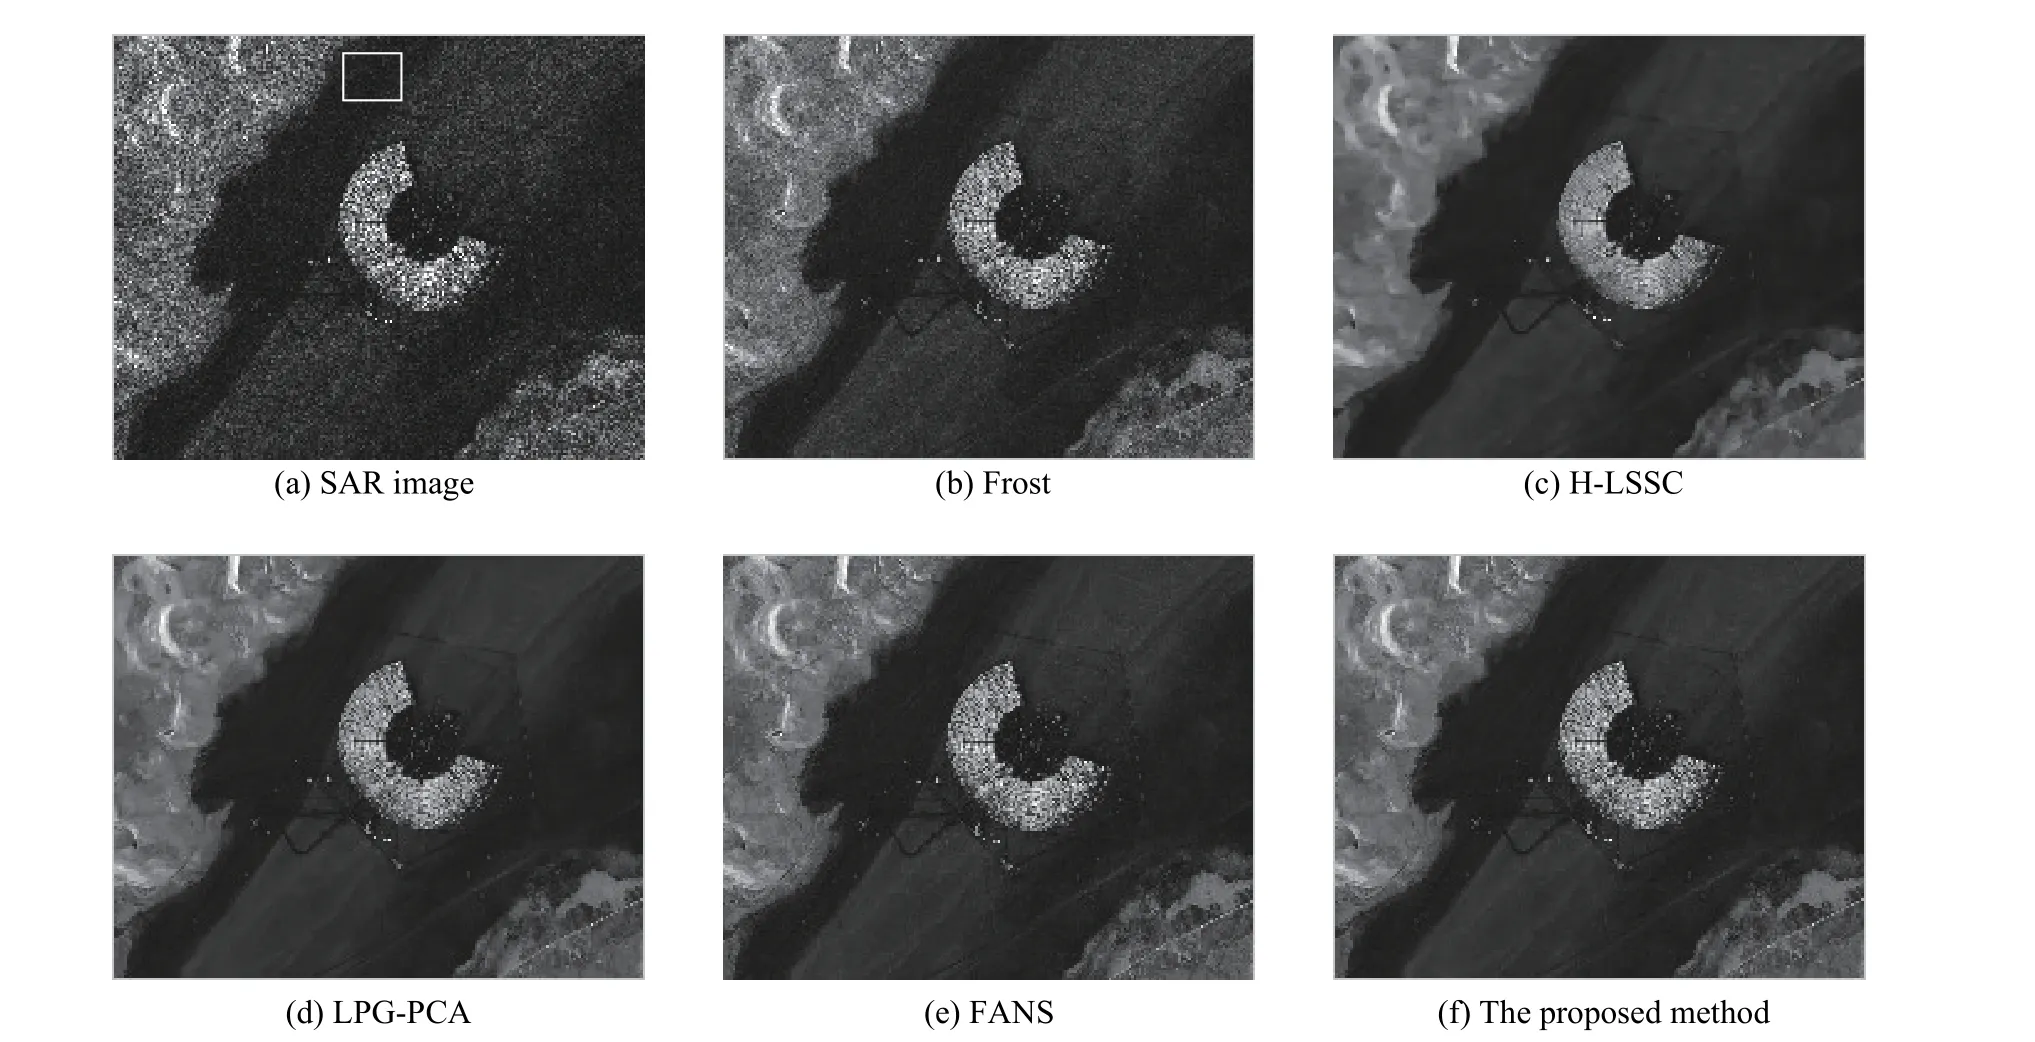
Fig. 6 De-noised images for BRC
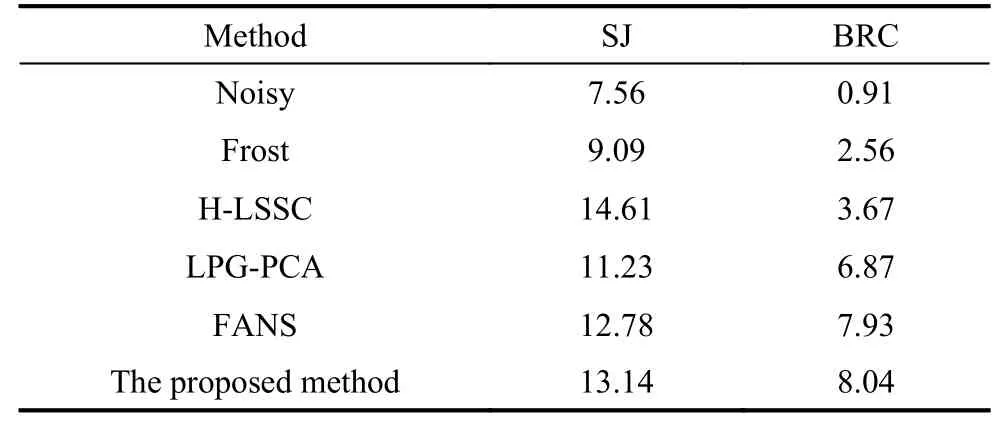
Table 3 ENLs for real SAR images
7. Conclusions and future work
A spatially adaptive image de-noising method by using the LPG-PCA and the guided filter is proposed in this paper. Compared with the state-of-the-art SAR image denoising methods, the proposed method achieves a better performance in terms of PSNR and SSIM by the experiment on simulated images. Besides, our method has better visual effects and shows fewer artifacts. For real SAR images, the ENLs is used to evaluate the ability of noise suppression in homogeneous areas. The proposed method has a very strong noise reduction ability while preserving the detail better.
Different from ordinary optical images, there are much texture information and edge features in SAR images. A certain point in SAR images may correspond to a building on the ground. The isolated structures have almost no similar patches in the search area which may lead to inaccurate estimation of the covariance matrix. Future research will concentrate on the separation of the isolated structures and perform different de-noising methods in different areas.
 Journal of Systems Engineering and Electronics2021年1期
- Journal of Systems Engineering and Electronics的其它文章
- Unsplit-field higher-order nearly PML for arbitrary media in EM simulation
- A deep learning-based binocular perception system
- STAP method based on atomic norm minimization with array amplitude-phase error calibration
- Higher order implicit CNDG-PML algorithm for left-handed materials
- Fast and accurate covariance matrix reconstruction for adaptive beamforming using Gauss-Legendre quadrature
- Multiple interferences suppression with space-polarization null-decoupling for polarimetric array
